


1. Introduction
Football, known as soccer in some regions, has an unparalleled influence worldwide, transcending cultural and geographical boundaries. It is more than just a sport; it is a powerful social phenomenon that unites people across diverse backgrounds. Major events like the FIFA World Cup capture the attention of billions, fostering a sense of global community and shared excitement.
According to data, all clubs in the top 10 of player market values are powerhouses. Although the Premier League does not have any teams in the top three, it boasts five clubs in the top 10—Manchester City, Manchester United, Chelsea, Arsenal, and Liverpool—representing a significant advantage for the Premier League among elite clubs. Additionally, in the rankings of the top 20 and top 50 clubs, the Premier League has seven and 15 clubs listed, respectively, leading among the top five leagues. This demonstrates that the Premier League is not solely reliant on a few big teams.
Injuries pose significant challenges for football players, affecting their physical performance and mental well-being. Physically, injuries can lead to setbacks, as time away from the game hinders a player’s development and form. Some injuries may also result in chronic issues, impacting career longevity and overall health. All in all, injuries represent a significant hurdle for football players.
We have also noticed that in our group, older players have a slightly higher risk of injury compared to younger athletes. Our viewpoint is the same as that presented in Arni Arnason’s article on Risk factors for injuries in football.
In our research, we will focus on the physical condition of football players, average yellow card occurrences per match, total yellow cards, ground confrontation, and header confrontation to study the relationship between these factors and the risk of injury for players. In conclusion, we found that the physical condition of football players has little correlation with the risk of injury, while factors that reflect the players' on-field behavior show a certain degree of relevance to injury risk.
2. Data and tools
In this section, we briefly describe the data sets we used and tools in our football analysis.
2.1. Data selection
In the beginning, we tend to collect a whole team’s injury record for two or three seasons (https://www.tzuqiu.cc/stats.do, https://m.7m.com.cn/data/index.html) because we believe that players from the same team face similar competition schedules, training plans, and also have very similar dietary habits. Therefore, we think selecting data from the same team will eliminate a significant number of irrelevant variables. After reviewing the transfer records of the Premier League in these years (the 2020-21 season, the 2021-22 season, and the 2022-23 season), we found that the rosters of some teams have changed significantly. As a result, we decided to abandon the approach of studying a single team. On the contrary, we began to consider analyzing players as individuals. Since each player comes from a different team, the samples better represent the overall characteristics of the league. Additionally, we believe that the standardization of the Premier League and the differences in competition format can help mitigate some of the variations.
2.2. Data preprocessing
In this section, we briefly describe the data sets we used and tools in our football analysis. In order to make the research more time-sensitive, we choose the football player from the FA Premier League whose player’s time on the court ranked in the top twenty in each of the three seasons: the 2020-21 season, the 2021-22 season, and the 2022-23 season. In the Premier League, there are a number of substitute players whose playing time, match appearances, and performance data are too limited to be included in our analysis.
To avoid incorporating data from these players, we will focus on statistical analysis of the top twenty players with the highest playing time in each season. This approach ensures that our sample consists of players who have had significant contributions on the field, providing a more reliable dataset for our study.
In the course of further research on the data of these players, we found that a portion of these players are goalkeepers. We began to re-evaluate the purpose and practical significance of our research. We hope that our research can have universality and be applicable to most players, due to the different movement patterns and training methods of goalkeepers compared to most other players [1]. Goalkeepers typically possess a greater height compared to players in other positions. In our research sample, we found that goalkeepers are indeed represented among the taller individuals. We decided to remove this part of the goalkeeper's data.
As we delved deeper into the data, we discovered that a few players presented special cases: some ranked among the top twenty in playing time for a particular season across all Premier League players. While this allowed these players to be included in our analysis, unforeseen circumstances, such as severe injuries, caused them to miss a significant number of matches over the past three years. For example, Stuart Dallas from Northern Ireland ranked seventh in playing time during the 2020-2021 season in the Premier League (this ranking includes goalkeepers), with a total of 3,410 minutes on the pitch. However, he suffered a leg fracture during a match against Manchester City in 2022, which significantly impacted his career, ultimately leading to his retirement in 2024. To avoid the influence of these data points on our analysis, we decided to remove these players from the dataset. This will help ensure the accuracy and reliability of our results.
2.3. Quantitative strategy
The next issue we face is how to quantify the injury risk of football players. To enhance the practical significance of our research, we decided to quantify the injury risk of players by measuring the number of days they miss due to injuries(In the following article, we will use match-loss to replace the number of matches missed by players due to injury. This metric will help us better understand the health status of players throughout the season and analyze factors related to injuries. By doing so, we can more accurately assess the injury risks of different players and their potential impact on team performance. At the same time, for the team, both the manager and the fans are more concerned about whether players will miss the next match. During our research, we also discovered that some players experience minor injuries, which might persist for two to three days. Interestingly, despite these injuries, many of these players choose to continue participating in matches rather than sitting out.
2.4. Data analysis
After completing the data preprocessing work, we began analyzing the data. We conduct OLS regression analysis on the basic variables: age, weight, and height.
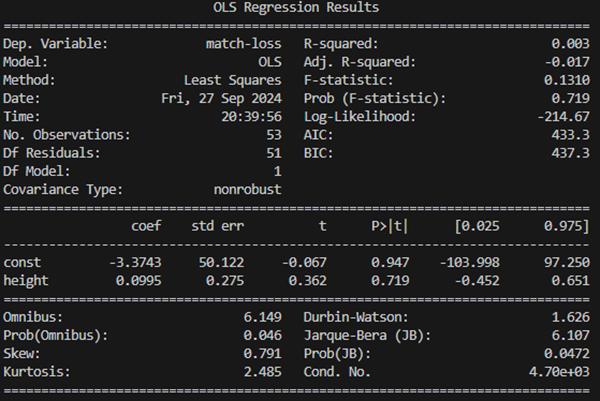
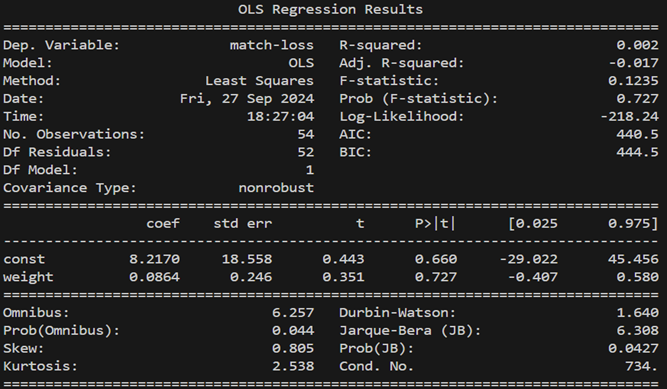
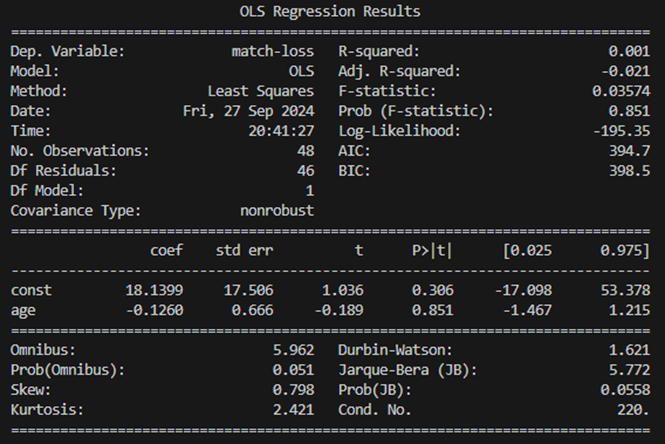
We conducted an OLS regression analysis using players' height, age, weight, and the number of match-loss. Figure 1 shows that the R-squared of height and match-loss is 0.003(0<R-squared<1). Combined with other data, it also shows that a player's height does not have much to do with injury risk. As shown in Figure 2, the R-squared of age and match-loss is 0.001(0<R-squared<1). Similarly, we cannot conclude that there is a significant correlation between a player's age and injury risk. and the R-squared of weight and match-loss is 0.002(0<R-squared<1) (see Figure 3). These analysis results indicate that the players' weight[2][3], height, and age have little correlation with match-loss.
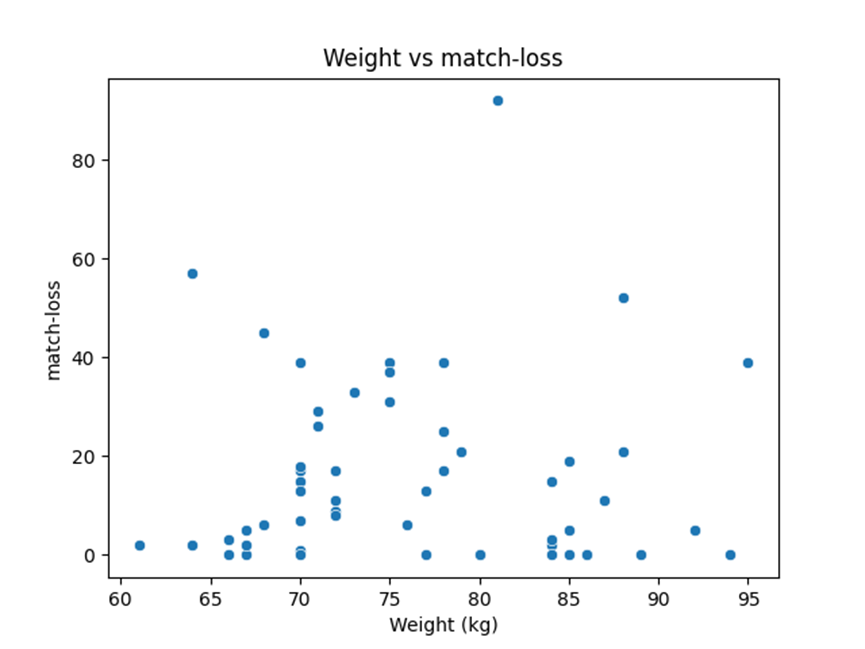
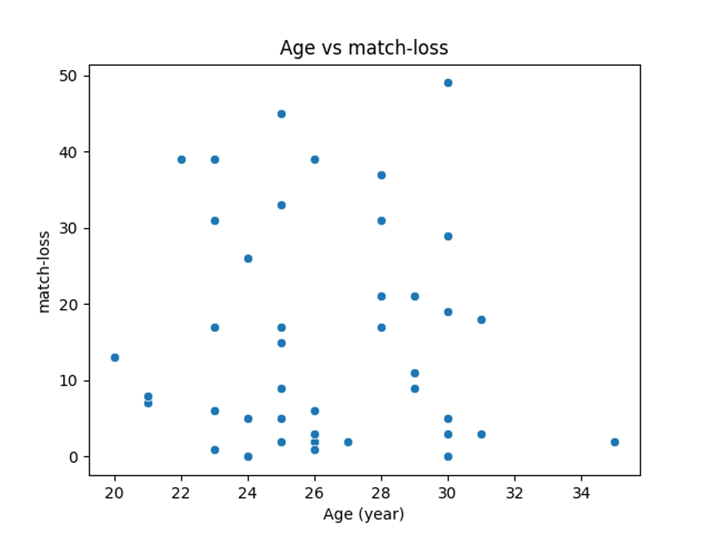
To further validate that age and weight do not correlate to a certain extent for a player's athletic risk, we visualized individual data samples. Figure 4 shows there was no linear or other correlation between the distribution of data between age and the player's injury risk. As shown in Figure 5, there is also no clear indication of age and athletic risk in players, suggesting a strong correlation between player’s age and injury risk.
3. Interpretation of the data results
Then, we visualized the data on weight, age, and match-loss and found that neither shows any correlation with match-loss. This also indirectly confirms our previous data analysis results.
We began to reflect on why our previous assumption that the players' basic data and match-loss were related was incorrect. For football players, various physical attributes are indeed important factors. However, injuries often occur when players engage in particularly risky actions. Thus, we shifted our focus to analyzing player behavior rather than their physical attributes[4]. We began to consider whether there is a standardized assessment or metric for analyzing overly dangerous movements in football players.
Therefore, we thought about analyzing the number of yellow cards received by football players. We also concluded that the number of ground duels and aerial duels in football can also serve as indicators to assess the risk associated with the sport. This time, to more intuitively illustrate the relevant analytical results, we used the heat map to represent the relationship between various variables and match-loss.
In this picture, tackle total refers to the player's total number of sliding tackles in three seasons(the 2020-21 season, the 2021-22 season, and the 2022-23 season). Tackle average refers to the average number of sliding tackles per game.
Quantity yellow refers to the player's total number of yellow cards in three seasons (the 2020-21 season, the 2021-22 season, and the 2022-23 season). Average yellow refers to the average number of yellow cards per game. Head refers to the number of header confrontations. And ground refers to the total number of ground confrontation.
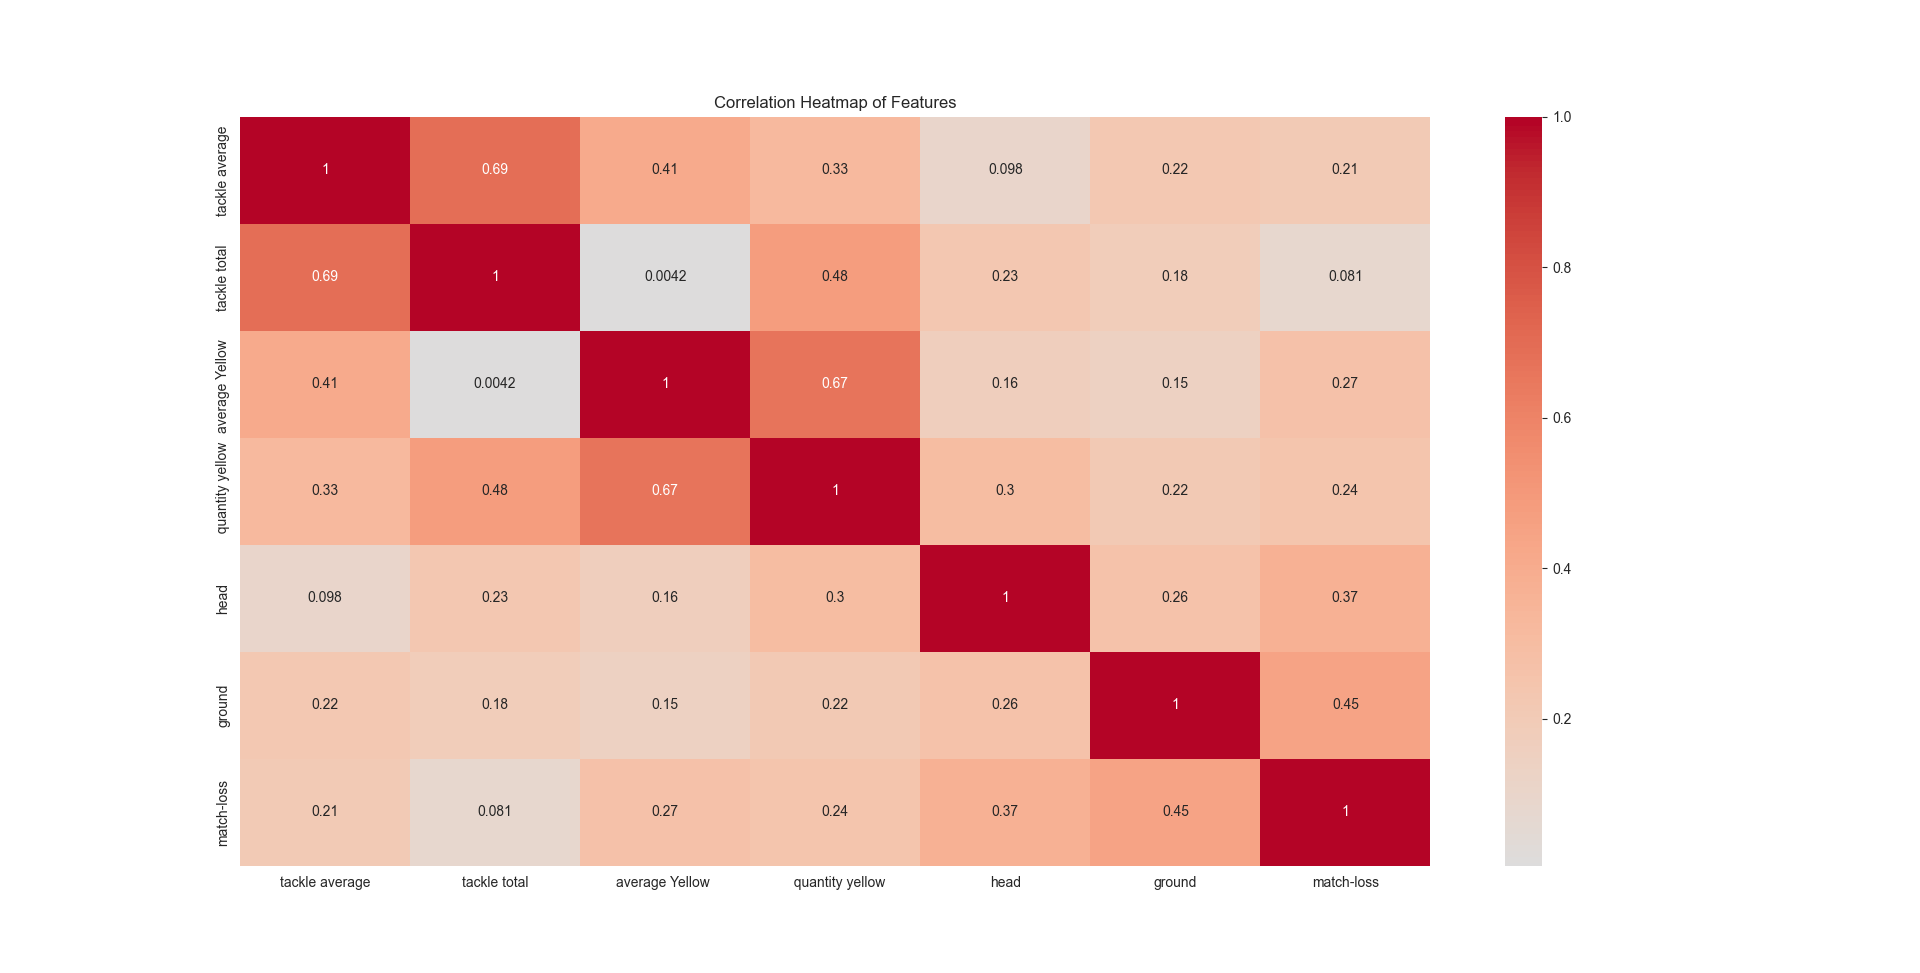
Figure 6 shows that the number of yellow cards, the average number of yellow card per game, header confrontation and ground confrontation are highly correlated with the injury risk of players [5].
|
Correlation |
P value |
|
|
Ground |
0.448162 |
0.01986 |
|
Head |
0.366320 |
0.01878 |
After that, we conducted a t-test on the ground confrontation and header confrontation that showed significant results in the heat map. Table 1 shows that our Ground p-value is 0.01986(0.01<p value<0.05) and Head p-value is 0.01878(0.01<p value<0.05). This also validates the results of our previous correlation analysis.
3.1. Player’s age
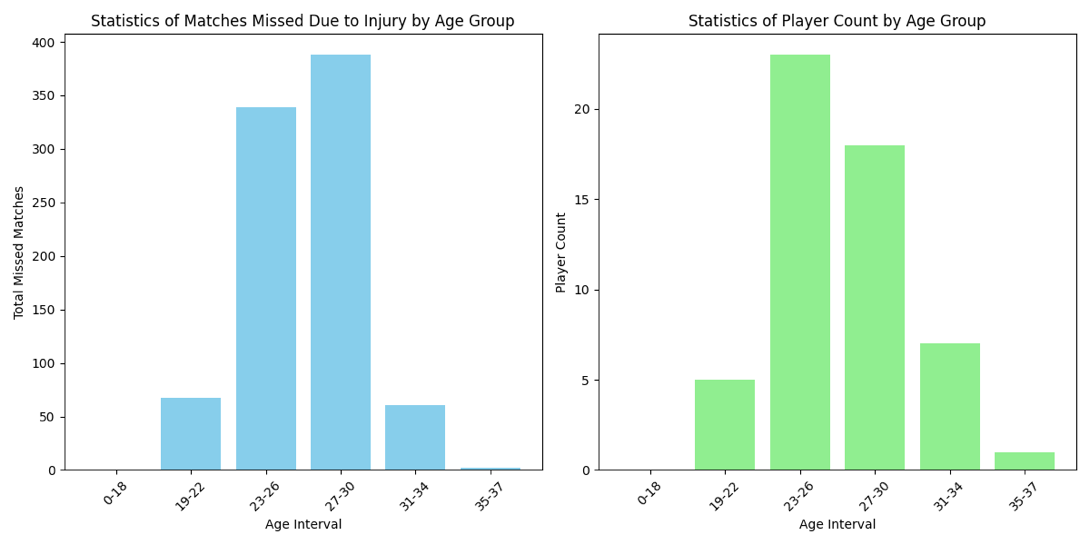
Figure 7 shows that height and age have no correlation, the weight and match loss have a weak correlation. Payer’s age and game loss have a weak relation, but it’s still reflecting some facts. Due to the players ' numbers, 23-26 is the biggest, but 27-30 players have the most injuries, and the players between 27-30 have the most probably injuries that lead to match loss[6].
Besides physical conditions, the action in the match is also related to the player’s injuries[7], especially when players are having an aggressive game or having strong physical confrontations.
3.2. Movement of player
The tackle average, tackle total, average Yellow, quantity yellow, head[8], and ground all have different positive levels of correlation with injuries. Compliance with the rules of football is fundamental to ensuring fair play and player safety. The yellow card system, as a key disciplinary measure in the game, is designed to warn players and prevent the repetition of misconduct, thereby maintaining the integrity and flow of the game. Through an in-depth analysis of the patterns and reasons for the issuance of yellow cards in football matches, this paper explores the behaviors that lead to players getting yellow cards and further studies the impact of these behaviors on the process of the game, tactical arrangements, and athletes' individual performance. The overview of the yellow card rules is that according to the regulations of the International Football Federation (FIFA), yellow cards apply to a range of behaviors. This includes but is not limited to, inappropriate behavior, violent behavior, serious fouls, use of insulting language or gestures, and diving. Yellow cards are issued to warn players to avoid repeated fouls or more serious violations.
3.3. Yellow card
The main reason for getting a yellow card:
3.3.1. Foul play
Foul play is the most common cause of yellow cards. This includes excessive physical contact in the contest for the ball, improper tackles, and pulling on opponents[9].
3.3.2. Improper behavior
Dissatisfaction and protests against refereeing decisions, as well as the use of abusive language or gestures, are also common reasons for yellow cards to be issued.
3.3.3. Tactical fouls
A player may commit a tactical foul in order to interrupt the rhythm of an opponent's attack or to protect their own goal, which is usually also punishable by a yellow card warning. Psychological and social factors behind yellow cards:
Competitive mentality: Athletes' competitive mindset can lead them to adopt riskier behaviors at critical moments.
Team strategy: Coaches' tactical arrangements may sometimes require players to commit fouls to achieve this, which can also increase the risk of yellow cards[10].
Referee's penalty standards: Different referees have different standards of punishment
The main function of yellow cards is to help players, coaches, and referees to manage the game better, reduce unnecessary fouls, and improve the enjoyment and fairness of the game.
Above all, A less talented team might choose to delay the game and stop an opponent's attack by committing fouls to compensate for their inability to guard an opponent's player. A more aggressive game should show up with more steals, so we standardized the number of fouls as the number of fouls a team committed to determine the likelihood that a tackle led to a foul.
4. Discussion
Our paper studies the relationship between the basic physical conditions of football players, such as height, weight, and age, as well as factors like aggressive behavior, the number of yellow cards, and the risk of injury. We conclude that the basic physical conditions of players have little relationship with the risk of injury. At the same time, the average number of yellow cards per game for players is somewhat related to the risk of injury. Finally, ground confrontation and header confrontation among football players are strongly correlated with the risk of injury.
At the same time, our paper has limitations in the data. Our data covers the time span from 2020 to 2023. However, during the COVID-19 pandemic, the Premier League was impacted, with a suspension from March 2020 to June 2020. Additionally, the implementation of certain preventive measures may have influenced our data collection and the performance of some players. Additionally, some players participated not only in Premier League matches but also in other competitions during certain years, resulting in varying levels of athletic intensity and match density over a short period. Due to the unique circumstances of some players, there may be instances where a player ranks in the top twenty for playing time in the Premier League one year, but then transfers to another league the following year. This also contributes to potential inaccuracies in our data.
To address this challenge, we propose increasing the sample size, as the phenomenon of players participating in other league matches is common in the Premier League. This could help reduce the impact of some irrelevant variables.
We believe that football clubs in different leagues and regions have varying conditions regarding diet, training plans, officiating standards, average attacking intensity, average defensive intensity[11], and tactical strategies. Therefore, we think that future research should focus more on the risk of injuries in other regions, providing scientific guidance for teams and players.
5. Conclusion
In this study, we examined various factors related to football players, including their physical condition, average yellow card occurrences per match, total yellow cards, ground confrontation, and header confrontation, to explore the relationship between these elements and the risk of injury. Our findings indicate that the physical condition of football players has little correlation with injury risk.
Conversely, aspects that reflect the players' on-field behavior demonstrate a certain degree of relevance to the likelihood of sustaining injuries. This suggests that focusing on behavioral metrics may provide valuable insights for injury prevention strategies in football.
References
[1]. Della Villa, F. , Mandelbaum, B. R. , & Lemak, L. J. (2018). The Effect of Playing Position on Injury Risk in Male Soccer Players: Systematic Review of the Literature and Risk Considerations for Each Playing Position. American journal of orthopedics (Belle Mead, N. J. ), 47(10), 10. 12788/ajo. 2018. 0092.
[2]. Kwakye, S. K. , Mostert, K. , Garnett, D. et al. Risk factors associated with football injury among male players from a specific academy in Ghana: a pilot study. Sci Rep 13, 8070 (2023). https://doi. org/10. 1038/s41598-023-34826-0
[3]. Seow D, Massey A, Correlation between preseason body composition and sports injury in an English Premier League professional football team BMJ Open Sport & Exercise Medicine 2022;8:e001193. doi: 10. 1136/bmjsem-2021-001193
[4]. Junge, Astrid; Dvořák, Jiri . (2015). Football injuries during the 2014 FIFA World Cup. British Journal of Sports Medicine, 49(9), 599–602. doi:10. 1136/bjsports-2014-094469
[5]. Arnason, A. , Sigurdsson, S. B. , Gudmundsson, A. , Holme, I. , Engebretsen, L. , & Bahr, R. (2004). Risk factors for injuries in football. The American journal of sports medicine, 32(1 Suppl), 5S–16S.
[6]. Sonesson, S. , Lindblom, H. , & Hägglund, M. (2023). Higher age and present injury at the start of the season are risk factors for in-season injury in amateur male and female football players-a prospective cohort study. Knee surgery, sports traumatology, arthroscopy: official journal of the ESSKA, 31(10), 4618–4630.
[7]. den Hollander, S. , & Gouttebarge, V. (2023). Headers and concussions in elite female and male football: a pilot study. South African journal of sports medicine, 35(1), v35i1a15236.
[8]. Rinaldo, N. , Gualdi-Russo, E. , & Zaccagni, L. (2021). Influence of Size and Maturity on Injury in Young Elite Soccer Players. International journal of environmental research and public health, 18(6), 3120.
[9]. Ryynänen, J. , Dvorak, J. , Peterson, L. , Kautiainen, H. , Karlsson, J. , Junge, A. , & Börjesson, M. (2013). Increased risk of injury following red and yellow cards, injuries and goals in FIFA World Cups. British journal of sports medicine, 47(15), 970–973.
[10]. Angoorani H, Najafi S , Sobouti B, Zarei M, Nejati P. The Association of Emotional Intelligence with Sport Injuries and Receiving Penalty Cards Among Iranian Professional Soccer Players. Asian J Sports Med. 2020;11(1):e97321.
[11]. Zhao, Y. , & Liu, T. (2022). Factors that influence actual playing time: evidence from the Chinese super league and English premier league. Frontiers in Psychology, 13, 907336.
Cite this article
Pu,Z.;Wang,C. (2025). The Factors in Professional Soccer Can Lead to Players Injuries. Lecture Notes in Education Psychology and Public Media,105,43-56.
Data availability
The datasets used and/or analyzed during the current study will be available from the authors upon reasonable request.
Disclaimer/Publisher's Note
The statements, opinions and data contained in all publications are solely those of the individual author(s) and contributor(s) and not of EWA Publishing and/or the editor(s). EWA Publishing and/or the editor(s) disclaim responsibility for any injury to people or property resulting from any ideas, methods, instructions or products referred to in the content.
About volume
Volume title: Proceedings of the 3rd International Conference on Global Politics and Socio-Humanities
© 2024 by the author(s). Licensee EWA Publishing, Oxford, UK. This article is an open access article distributed under the terms and
conditions of the Creative Commons Attribution (CC BY) license. Authors who
publish this series agree to the following terms:
1. Authors retain copyright and grant the series right of first publication with the work simultaneously licensed under a Creative Commons
Attribution License that allows others to share the work with an acknowledgment of the work's authorship and initial publication in this
series.
2. Authors are able to enter into separate, additional contractual arrangements for the non-exclusive distribution of the series's published
version of the work (e.g., post it to an institutional repository or publish it in a book), with an acknowledgment of its initial
publication in this series.
3. Authors are permitted and encouraged to post their work online (e.g., in institutional repositories or on their website) prior to and
during the submission process, as it can lead to productive exchanges, as well as earlier and greater citation of published work (See
Open access policy for details).
References
[1]. Della Villa, F. , Mandelbaum, B. R. , & Lemak, L. J. (2018). The Effect of Playing Position on Injury Risk in Male Soccer Players: Systematic Review of the Literature and Risk Considerations for Each Playing Position. American journal of orthopedics (Belle Mead, N. J. ), 47(10), 10. 12788/ajo. 2018. 0092.
[2]. Kwakye, S. K. , Mostert, K. , Garnett, D. et al. Risk factors associated with football injury among male players from a specific academy in Ghana: a pilot study. Sci Rep 13, 8070 (2023). https://doi. org/10. 1038/s41598-023-34826-0
[3]. Seow D, Massey A, Correlation between preseason body composition and sports injury in an English Premier League professional football team BMJ Open Sport & Exercise Medicine 2022;8:e001193. doi: 10. 1136/bmjsem-2021-001193
[4]. Junge, Astrid; Dvořák, Jiri . (2015). Football injuries during the 2014 FIFA World Cup. British Journal of Sports Medicine, 49(9), 599–602. doi:10. 1136/bjsports-2014-094469
[5]. Arnason, A. , Sigurdsson, S. B. , Gudmundsson, A. , Holme, I. , Engebretsen, L. , & Bahr, R. (2004). Risk factors for injuries in football. The American journal of sports medicine, 32(1 Suppl), 5S–16S.
[6]. Sonesson, S. , Lindblom, H. , & Hägglund, M. (2023). Higher age and present injury at the start of the season are risk factors for in-season injury in amateur male and female football players-a prospective cohort study. Knee surgery, sports traumatology, arthroscopy: official journal of the ESSKA, 31(10), 4618–4630.
[7]. den Hollander, S. , & Gouttebarge, V. (2023). Headers and concussions in elite female and male football: a pilot study. South African journal of sports medicine, 35(1), v35i1a15236.
[8]. Rinaldo, N. , Gualdi-Russo, E. , & Zaccagni, L. (2021). Influence of Size and Maturity on Injury in Young Elite Soccer Players. International journal of environmental research and public health, 18(6), 3120.
[9]. Ryynänen, J. , Dvorak, J. , Peterson, L. , Kautiainen, H. , Karlsson, J. , Junge, A. , & Börjesson, M. (2013). Increased risk of injury following red and yellow cards, injuries and goals in FIFA World Cups. British journal of sports medicine, 47(15), 970–973.
[10]. Angoorani H, Najafi S , Sobouti B, Zarei M, Nejati P. The Association of Emotional Intelligence with Sport Injuries and Receiving Penalty Cards Among Iranian Professional Soccer Players. Asian J Sports Med. 2020;11(1):e97321.
[11]. Zhao, Y. , & Liu, T. (2022). Factors that influence actual playing time: evidence from the Chinese super league and English premier league. Frontiers in Psychology, 13, 907336.