


1. Introduction
Stress has become a hot topic in the present times as it is a very common thing in our life as it correlates our daily performances, mood, and also mental health. Sleep has a complex relationship with stress levels, and this relationship plays a vital role in maintaining body homeostasis when faced with internal or external challenges. The quality of sleep can be measured using physical or physiological characteristics such as heart rate, body temperature, and body movement [1]. Stress can have negative influence on sleep and caused serious problems. For instance, according to the cognitive model of insomnia, an individual's preoccupation with sleep problems leads to heightened arousal, which then hinders the initiation and continuity of sleep. The fear or experience of insomnia can further worsen an already stressful situation [1,2]. This model’s role is predicting the stress levels in sleep patterns by using machine learning method. This model can be useful to explore link between stress and sleep [3]. Predicting the stress level in sleep pattern can potentially contribute to public health efforts, raise individuals’ awareness to relieve stress and reduce issues that are triggered by excessive stress.
While stress and sleep pattern are popular topics, scholars have done various works and researches on exploring the relationship between stress and sleep. For example, they used the movement of a sleeping individual to identify sleep. Webster presented the first system for automatic scoring. Cole discovered that the ideal sleep detection precision was 88% [4]. During sleep, heart rate exhibits variations: it increases and decreases in response to sleep arousal events. Recent studies have also established a correlation between heart rate and sleep quality. Specifically, stages 3 and 4 of sleep display significantly lower frequency when compared to stages 1 and 2 [5,6]. There are also many studies suggest that hypothalamus-pituitary-adrenal (HPA) axis, which are closely linked to stress as well as sleep, may explain the relationship between sleep and stress. The presence of acute stress is often associated with a reduction in slow wave and rapid eye movement (REM) sleep. Additionally, sleep deprivation, when used as a stress-inducing factor, has significant impacts on both the structure of sleep and the natural rhythms of the body [7]. The technique uses in the study applies random forest classier. Over the years, researchers have done various efforts on improving the classification model as traditional machine algorithm generally yield low accuracy. In 1996, Leo Breiman introduced the Bagging algorithm, an early-stage algorithm [8]. Amit and Geman further developed this approach by defining a wide range of geometric features. They then employed a random selection method to search for the optimal split at each node [9]. Subsequently, influenced by Amit and Geman's paper, Breiman incorporated their ideas into his thoughts on random forests. He introduced a step of randomizing the outputs in the original training set, which subsequently generated a new training set. This innovation led to the development of the Random Forest Classifier, a powerful ensemble model that combines a series of tree-based classifiers. As a result, the Random Forest Classifier has gained widespread popularity in various applications, particularly in classification and prediction.
The random forest machine learning algorithm is utilized in this study with the primary aim of predicting stress levels based on sleep patterns. First and foremost, the SayoPllow datasets. Author repossesses csv and checked for null values to simplify the prepossessed step. Then author has exploratory data analysis, which allows us to visualize the data and investigate the relationship between different variables. Following that, author uses a random forest classifier to discover factors in sleep patterns that have the greatest influence on stress. Following that, author splits the data in order to fit it into the training model: random forest classifier. The fundamental principle underlying the random forest algorithm involves the construction of a multitude of decision trees, which are subsequently combined to make predictions. Every decision tree is trained using training samples that are randomly drawn and characteristics that are randomly selected. This implies that individual decision trees have been trained using distinct subsets of data and characteristics, thereby mitigating the issue of over-fitting in the model. The random forest algorithm can perform precise classification, which helps the model to make prediction of the stress level, allowing people to deal with reducing stress and raise awareness to improve the sleep patterns.
2. Methodology
2.1. Dataset description and preprocessing
The dataset, obtained from Kaggle [10,11] under the name "SayoPillow.csv," provides valuable insights into the relationship between various parameters and stress levels. The parameters include the user's snoring range, respiration rate, body temperature, limb movement rate, blood oxygen levels, eye movement, number of hours of sleep, heart rate, and Stress Levels (ranging from 0 - low/normal to 4 - high). The dataset is derived from SaYoPillow, a cutting-edge Smart-Yoga Pillow designed to investigate the correlation between stress and sleep. The pillow aims to achieve the concept of "Smart-Sleeping" by incorporating an edge device that analyzes the physiological changes occurring during sleep. Based on these changes, the model proposes stress prediction, contributing to a better understanding of sleep-related stress factors.
For the preprocessing unit, the first step is understanding the data. Rows and columns of the datasets needed to be shaped, identified and displayed. Then, the names for the columns Data Frame can be renamed to achieve the better readability and understanding. For example, returning row for the object based on position can quickly test if the right type of data in it. After that, all columns of the input should include in the output and to show the statistical summary. Last steps are checking null values and checking distribution of target variable. Checking null values can ensure that there are no missing values in any of the columns of the datasets, and to check distribution of the target variable, it is feasible to create a count plot to visualize it.
2.2. Proposed approach
The primary goal of the study is to construct a model that can predict the stress level in the sleeping pattern, and using random forest to train the datasets for better accuracy. Figure 1 above explicitly lay out the procedure made in the model. After the preprocessing unit, it is necessary to make the exploratory analysis in order to have a better understanding of the relationship between the features and the selected targeted variable. To achieve this, the target variable (stress level) can be first made. After that, violin plots for numerical features based on the target variable is constructed to visualize each feature’s distribution by the target variable. In addition, a pair plot needed to be created in order to visualize the pairwise relationships between variable and have target variable as the hue. The last thing for the exploratory analysis is to make a correlation analysis through making a correlation matrix heat map. Next step is splitting the datasets for training, which is an important stage in machine learning. Data is first split into feature and the target variable, then split into training and testing sets, having overall 4 sets. After split the datasets for training, it is very important to identify the most important features in the datasets. To do that, random forest classifier is utilized. First of all, an instance of the Random Forest Classifier with hyper parameters is created with deciding the number of trees and controlling the randomness. Secondly, random forest classifier is fit into the data in order to train the random forest classifier on the training data. Since Random Forest Classifier incorporates the Gini importance and can choose the impurity-based feature importance, feature importance can be got from the trained Random Forest Classifier. Then, looping over each feature and its importance can have the importance score for all the features, and then the features’ names with their corresponding importance score can be printed out for visualization. Feature importance can be also shown in a bar chart to make a comparison between each feature’s importance score. Ultimately, random forest classifier is used again to predict the accuracy of the data. First, number of trees in the forest are set and random forest classifier is fit on the datasets. Then, the score of the training data can be yielded by random forest classifier. In addition, the confusion matrix and classification report can be printed based on the prediction to better understand the result trained by random forest classifier, which both can help assess model’s classification performance.
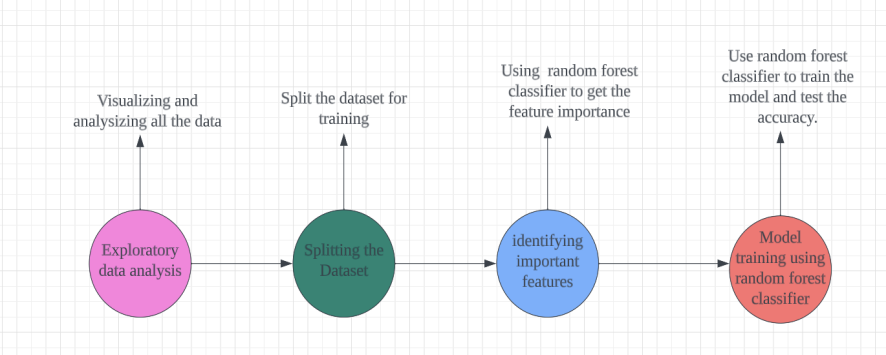
Figure 1. The process of the study
2.2.1. Random Forest Classifier algorithm. Random forest is a supervised machine learning algorithm which ensures high stability and diversity. The structure involved in Random Forest Algorithm can be seen by the Figure 2, which employs multiple decision trees for primarily classification and regression tasks. In the random forest model, first step is to acquire a random subset from the training data through the Bootstrap sampling. This subset comprises a segment of the initial training data and may contain duplicated samples. After that, each decision tree is constructed follow by the rules of decision tree algorithm, which rule is recursively splitting the datasets into subsets until the criterion is met such as reaching a predefined depth. Following by constructing every decision tree, outputs are generated by each tree, and the final output is considered based on majority of votes for classification or regression. Random forest involves random feature selection, helping reduce the correlation between individual trees, which can effectively deal with the over-fitting problem.
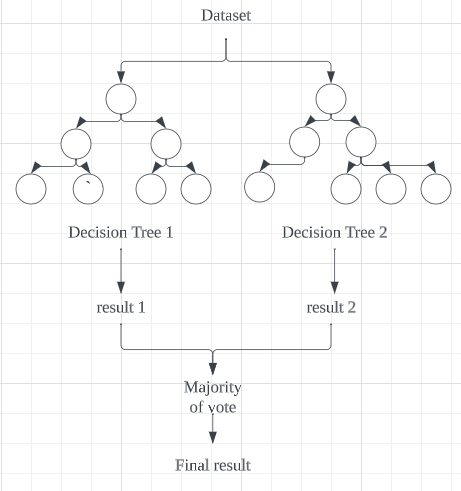
Figure 2. The process of the random forest
2.2.2. Evaluation Metrics and Visualization Tools. Evaluation of the Random Forest Model includes metrics and visualization tools, including accuracy and classification report.
\( Accuracy=\frac{Number of correctly classified samples}{Total number of samples}. \) (1)
This metric provides an indication of the frequency with which our classifier produces accurate results. The calculation involves the summation of all verifiable values, which are then divided by the total number of values. The confusion matrix presents a table that has different outcomes of the prediction and results of a classification problem. Confusion Matrix can be served as a powerful tool that visualize the outcomes The classification report is a valuable tool for assessing the performance of a machine learning model, offering a comprehensive summary of various metrics that indicate model effectiveness. These metrics include precision, recall, and F1-score. Precision measures the accuracy of positive predictions by comparing true positives (TP) to the total number of predicted positives (TP + FP). It gauges the model's proficiency in correctly identifying positive samples. In contrast, recall calculates the true positive rate by dividing the number of true positives by the total number of actual positives (TP + FN). It evaluates the model's ability to detect all positive samples without missing any. Lastly, the F1 score represents the harmonic mean of precision and recall, combining both metrics to provide an overall evaluation of the model's performance.
2.3. Implemented details
The study utilizes Pandas for data manipulation, NumPy for numerical operations, and matplotlib for creating visualization. It also imports seaborn for advanced visualizations and statistical graphics. To implement the random forest classifier, it uses sklearn and python3.10. The study also implement Evaluation Metrics and Visualization Tools by importing sklearn metrics.
3. Result and discussion
After preprocessing, exploratory data analysis split the dataset, identify important features and model training, the relationship between features are visualized and learned and the result trained by random forest classifier is yielded.
The computation of feature importance in a random forest classifier involves calculating the mean and standard deviation of the impurity decrease accumulated within each tree. During the iteration process, the algorithm discloses both the features and their respective importance scores. From the Table 1 above, the model places significant importance on the variables 'eye movement' and 'blood oxygen' when predicting stress levels during sleep. High values of these characteristics may suggest heightened levels of stress. The variables 'snoring rate', 'limb movement', and 'heartrate' exhibit significant significance, suggesting their relevance in the prediction of stress levels. However, the feature 'sleeping hours' appears to have the least influence based on this model. Nonetheless, it is still crucial to take it into account during the analysis.
Table 1. The importance score of the feature.
Features | Snoring_rate | Respiration rate | Body- temperature | Limb_movement | Blood- oxygen | Eye-movement | Sleeping_hours | Heat_rate |
importance score | 0.130143 | 0.123295 | 0.122216 | 0.123938 | 0.136199 | 0.137116 | 0.104807 | 0.122288 |
Table 2 above is the classification report based on the random forest prediction. The accuracy, precision, recall, and f1-score achieve to 98%. With the accuracy of 0.984 generated by random forest classifier, it has a better performance than training by the decision tree classifier, which has 0.976 accuracy. This can illustrate why the random forest is often considered better than a single decision tree because of its ability of reducing over-fitting and better handling of outliers and noisy data. Overall, incorporating random forest to get every feature’s importance can have a clearer understanding on relationship between features and stress level. The results turn out that eye movement and blood oxygen are the two most important features that are influencing the stress level in sleep patterns. In addition, the model can have a more robust and precise prediction when applies random forest classifier.
Table 2. The performance of the result
Classification report: | precision | recall | f1-score | support |
0 | 0.96 | 1.00 | 0.98 | 23 |
1 | 1.00 | 0.96 | 0.98 | 24 |
2 | 1.00 | 1.00 | 1.00 | 28 |
3 | 1.00 | 0.96 | 0.98 | 26 |
4 | 0.96 | 1.00 | 0.98 | 25 |
accuracy | 0.98 | 126 | ||
macro avg | 0.98 | 0.98 | 0.98 | 126 |
Weighted avg | 0.98 | 0.98 | 0.98 | 126 |
4. Conclusion
All in all, the study aims to create a model that analyses the prediction of stress level in sleep patterns by using random forest classifier. Random forest classifier, which employs multiple decision trees, has obvious advantages like reducing over-fitting, ensuring versatility and generally yield high accuracy. Random forest classifier can yield the feature importance, which can have a better understanding of the relationship between features during sleep and the stress level. Moreover, using random forest classifier to train on the data can yield high accuracy of prediction, which ultimately leads to a better and more precise prediction of stress level in sleep patterns.
References
[1]. Roebuck A Monasterio V Gederi E 2013 A review of signals used in sleep analysis Physiological measurement 35(1): R1
[2]. Christopher D Gary R Timothy R 2004 Vulnerability to stress-related sleep disturbance and hyperarousal Sleep 27(2): pp 285–291
[3]. Arthur J Spielman L Caruso S 1987 A behavioral perspective on insomnia treatment. Psychiatric Clinics of NorthAmerica 10(4): pp 541–553
[4]. Feng H et al. 2019 A survey of machine learning techniques in physiology based mental stress detection systems Biocybernetics and Biomedical Engineering
[5]. Siegel J 2011 REM sleep: a biological and psychological paradox Sleep medicine reviews 15(3): p 139
[6]. Breiman L 1996 Bagging Predictors Machine Learning 24: 123–140
[7]. Roger J Daniel F William G 1992 Automatic sleep/wake identification from wrist activity Sleep 15(5): pp 461–469
[8]. Walter K Claudio M and Dario F 2008 Improving actigraph sleep/wake classification with cardio-respiratory signals In 2008 30th Annual International Conference of the IEEE Engineering in Medicine and Biology Society IEEE pp 5262–5265
[9]. Mina A Tokuhiro K Sunao U 2003 Correlation between electroencephalography and heart rate variability during sleep Psychiatry and clinical neurosciences 57(1): pp 59–65
[10]. Rachakonda L Bapatla A Mohanty S Kougianos E 2021 SaYoPillow: Blockchain-Integrated Privacy-Assured IoMT Framework for Stress Management Considering Sleeping Habits IEEE Transactions on Consumer Electronics (TCE) 67(1): pp 20-29
[11]. Rachakonda L Mohanty S Kougianos E Karunakaran K 2018 Smart-Pillow: An IoT based Device for Stress Detection Considering Sleeping Habit in Proceedings of the 4th IEEE International Symposium on Smart Electronic Systems (iSES) pp 161-166
Cite this article
Liu,J. (2024). Prediction of stress levels in sleep patterns based on random forest. Applied and Computational Engineering,41,69-74.
Data availability
The datasets used and/or analyzed during the current study will be available from the authors upon reasonable request.
Disclaimer/Publisher's Note
The statements, opinions and data contained in all publications are solely those of the individual author(s) and contributor(s) and not of EWA Publishing and/or the editor(s). EWA Publishing and/or the editor(s) disclaim responsibility for any injury to people or property resulting from any ideas, methods, instructions or products referred to in the content.
About volume
Volume title: Proceedings of the 2023 International Conference on Machine Learning and Automation
© 2024 by the author(s). Licensee EWA Publishing, Oxford, UK. This article is an open access article distributed under the terms and
conditions of the Creative Commons Attribution (CC BY) license. Authors who
publish this series agree to the following terms:
1. Authors retain copyright and grant the series right of first publication with the work simultaneously licensed under a Creative Commons
Attribution License that allows others to share the work with an acknowledgment of the work's authorship and initial publication in this
series.
2. Authors are able to enter into separate, additional contractual arrangements for the non-exclusive distribution of the series's published
version of the work (e.g., post it to an institutional repository or publish it in a book), with an acknowledgment of its initial
publication in this series.
3. Authors are permitted and encouraged to post their work online (e.g., in institutional repositories or on their website) prior to and
during the submission process, as it can lead to productive exchanges, as well as earlier and greater citation of published work (See
Open access policy for details).
References
[1]. Roebuck A Monasterio V Gederi E 2013 A review of signals used in sleep analysis Physiological measurement 35(1): R1
[2]. Christopher D Gary R Timothy R 2004 Vulnerability to stress-related sleep disturbance and hyperarousal Sleep 27(2): pp 285–291
[3]. Arthur J Spielman L Caruso S 1987 A behavioral perspective on insomnia treatment. Psychiatric Clinics of NorthAmerica 10(4): pp 541–553
[4]. Feng H et al. 2019 A survey of machine learning techniques in physiology based mental stress detection systems Biocybernetics and Biomedical Engineering
[5]. Siegel J 2011 REM sleep: a biological and psychological paradox Sleep medicine reviews 15(3): p 139
[6]. Breiman L 1996 Bagging Predictors Machine Learning 24: 123–140
[7]. Roger J Daniel F William G 1992 Automatic sleep/wake identification from wrist activity Sleep 15(5): pp 461–469
[8]. Walter K Claudio M and Dario F 2008 Improving actigraph sleep/wake classification with cardio-respiratory signals In 2008 30th Annual International Conference of the IEEE Engineering in Medicine and Biology Society IEEE pp 5262–5265
[9]. Mina A Tokuhiro K Sunao U 2003 Correlation between electroencephalography and heart rate variability during sleep Psychiatry and clinical neurosciences 57(1): pp 59–65
[10]. Rachakonda L Bapatla A Mohanty S Kougianos E 2021 SaYoPillow: Blockchain-Integrated Privacy-Assured IoMT Framework for Stress Management Considering Sleeping Habits IEEE Transactions on Consumer Electronics (TCE) 67(1): pp 20-29
[11]. Rachakonda L Mohanty S Kougianos E Karunakaran K 2018 Smart-Pillow: An IoT based Device for Stress Detection Considering Sleeping Habit in Proceedings of the 4th IEEE International Symposium on Smart Electronic Systems (iSES) pp 161-166