


Introduction
Since 2020, The COVID-19 pandemic has affected nearly every country in the world, with a significant impact on public health, economies, and social structures. Despite the efforts of governments and health organizations to contain the virus, the number of infected individuals continues to rise, particularly in more democratic countries with greater access to medical resources [1]. This has raised questions about the underlying factors contributing to the spread of COVID-19 and the measures that can be taken to reduce its impact. It is crucial to understand the root causes of the rising number of infections in order to inform effective prevention and response strategies. In this context, this paper aims to analyze the factors contributing to the increase in COVID-19 cases, particularly in more developed and democratic countries with greater medical resources, and to identify potential solutions to mitigate the spread of the virus. The paper will review existing literature on COVID-19 transmission and containment strategies and use statistical analysis to identify trends and patterns in the data. The findings of this study will be useful for policymakers, health professionals, and other stakeholders in developing effective strategies to control the spread of COVID-19 and minimize its impact on public health and the economy. The following paragraphs briefly discuss some of the previous studies on this topic.
Many previous studies have used several machine-learning techniques to automate the detection of coronaviruses. For example, Cerda et al, studied data on patients with suspected new coronavirus pneumonia and their admission rates in various hospital facilities. Using a sample of 531 individuals, the authors used a probit regression model with marginal effects and concluded that fear was negatively associated with knowledge about neo-coronavirus, education level and aging. Rashedi, Jalil et al. found that viral, environmental and host factors play a role in viral infection and disease.Covid-19, a virus that is highly transmissible, is transmitted through close contact, droplets from coughing, sneezing and loud talking, and contact with contaminated objects, which can be rapidly transmitted to people [2]. Particular attention has been paid to the analysis of environmental risk factors such as crowding and poor ventilation as important factors contributing to increased infection rates [3]. Liu, Tao, et al. estimated attack rates and identified risk factors for infection with Neocoronary pneumonia. Based on a retrospective cohort study using a sample of 11,580 cases of New Coronary Pneumonia in Guangdong Province, all contacts were tested by RT-PCR to detect their infection rates, attack rates were calculated by characteristics, and logistic regression was used to estimate risk factors for New Coronary Pneumonia infection and found that children, elderly, females and family members were susceptible to New Coronary Pneumonia infection, while the index cases with latent period were less infectious Phoswa, Wendy N., and Olive P. Khaliq showed that COVID-19 is an immune disease characterized by reduced lymphocytes and elevated selected pro-inflammatory cytokines, and the findings suggest that coronaviruses enter host cells through these ACE2 receptors [4]. The immune response during pregnancy increases the risk of contracting neo-coronavirus pneumonia.
Other authors have attempted to analyze risk factors associated with coronavirus detection through the use of differential modeling techniques. Wańkowicz, et al. found a higher risk of neo-coronavirus infection in groups already affected by health disparities in age, race, ethnicity, language, income, and living conditions [5]. Health promotion and disease prevention strategies should prioritize the groups most vulnerable to infection and address the structural inequalities that contribute to risk through social and economic policies.
In this paper, we will use data analyze, including Multiple regression equation, stepwise which is expected to contribute to the effective control of this disease in the future, to analyze which variables among the nine dependent variables are significantly correlated with the number of COVID-19 infections, which will provide effective help in our fight against COVID-19 and provide experience for future fight against the virus.
Data Source
The data source used for our analysis is the Oxford Coronavirus Government Response Tracker, a comprehensive dataset that tracks the policies and measures taken by governments around the world in response to the COVID-19 pandemic [6]. These data were collected and compiled by researchers at the University of Oxford and include a variety of indicators such as school closures, travel restrictions and vaccination policies. Our analysis relies on a stringency index, which measures the stringency of government policies in response to COVID-19, with higher values indicating more stringent measures. The data cover various infection indicators for 168 countries over time from January 2020 to the present, and we selected nine of the more controversial factors, as detailed in Table 1.
x1 |
X2 |
X3 |
X4 |
X5 |
X6 |
X7 |
X8 |
X9 |
|---|---|---|---|---|---|---|---|---|
stringency-index |
hospital beds per thousand |
human development index |
DALY(2017)-Burden ofdiseaseogy&Result |
gdp_per_capita |
Health expenditure per |
Liberal democracy index 2017 |
Physicians (per 1000 people) |
Nurses and midwives (per 1000 people) |
Methodology & Result
Method Introduction
Multiple regression is a statistical method used to analyze the relationship between a dependent variable and multiple independent variables [7]. It is an extension of simple linear regression, which only considers one independent variable. Multiple regression allows for examining the influence of multiple variables on the dependent variable.
The formula for multiple regression is as follows:
Y = β0 + β1X1 + β2X2 + ... + βnXn + ε
where:
Y = dependent variable
X1, X2, ... , Xn = independent variables
β0 = y-intercept
β1, β2, ... , βn = coefficients of independent variables
ε = error term
Variables Screening
Shen Yi, a professor at Fudan University, said, "The higher the medical resources, the more people will die."We first use the "enter" method. That is, all independent variables will be forcibly entered like Table 2.
| Variables Entered/Removeda | |||
|---|---|---|---|
| Model | Variables Entered | Variables Removed | Method |
| 1 | human_development_index, stringency_index, hospital_beds_per_thousand, Liberal_democracy_index_2017, gdp_per_capita, Nurses_and_midwives, Physicians, Burden_of_disease, Health_expenditure_per_capitab | . | Enter |
| a. Dependent Variable: total_cases_per_million | |||
| b. All requested variables entered. | |||
As can be seen from Table 3, we can find that the "model summary" that R square is 0.4, indicating that the model has a certain fitting effect.
| Model Summaryb | ||||
|---|---|---|---|---|
| Model | R | R Square | Adjusted R Square | Std. Error of the Estimate |
| 1 | .659a | .434 | .400 | 9792.446996 |
| a. Predictors: (Constant), human_development_index, stringency_index, hospital_beds_per_thousand, Liberal_democracy_index_2017, gdp_per_capita, Nurses_and_midwives, Physicians, Burden_of_disease, Health_expenditure_per_capita | ||||
| b. Dependent Variable: total_cases_per_million | ||||
| ANOVAa | ||||||
|---|---|---|---|---|---|---|
| Model | Sum of Squares | df | Mean Square | F | Sig. | |
| 1 | Regression | 11025846846.550 | 9 | 1225094094.061 | 12.776 | .000b |
| Residual | 14383802724.021 | 150 | 95892018.160 | |||
| Total | 25409649570.572 | 159 | ||||
| a. Dependent Variable: total_cases_per_million | ||||||
| b. Predictors: (Constant), human_development_index, stringency_index, hospital_beds_per_thousand, Liberal_democracy_index_2017, gdp_per_capita, Nurses_and_midwives, Physicians, Burden_of_disease, Health_expenditure_per_capita | ||||||
F test was performed on the total regression equation. Significance is sig.
The statistical significance of a result is an estimate of how true the result is (as representative of the population). Professionally, the P-value is a decreasing indicator of the degree of confidence of the result. The larger the P-value, the less we can consider the correlation of variables in the sample to be a reliable indicator of the correlation of variables in the population. The P-value is the probability of making a mistake that takes an observation to be valid and representative of the population. A p=0.05 indicates that there is a 5% chance that the variable association in the sample is due to chance. That is, assuming that there is no correlation between any variables in the population, we repeat a similar experiment, and it will be found that there is one experiment in about 20 experiments, and the correlation of the variables we study will be equal to or stronger than our experimental results. This does not mean that we will get the same result 5% or 95% of the time if there is an association between variables. When there is an association between variables in the population, the likelihood of repeating the study and finding an association is related to the statistical power of the design [8]. In many fields of study, a p value of 0.05 is generally considered to be the boundary level of acceptable error.
Table4 shows that the probability value "sig" of "F statistic" is 0.00 less than 0.01. We can consider the overall significance of the model, that is, there is a linear relationship between the dependent variable and the independent variable. As for the strength of the linear relationship, it needs further analysis.
Experiment result
| Coefficientsa | ||||||||
|---|---|---|---|---|---|---|---|---|
| Model | Unstandardized Coefficients | Standardized Coefficients | t | Sig. | Collinearity Statistics | |||
| B | Std. Error | Beta | Tolerance | VIF | ||||
| 1 | (Constant) | 5363.470 | 13300.585 | .403 | .687 | |||
| stringency_index | 99.406 | 55.531 | .127 | 1.790 | .075 | .751 | 1.331 | |
| Liberal_democracy_index_2017 | -941.230 | 4117.043 | -.019 | -.229 | .819 | .552 | 1.812 | |
| gdp_per_capita | .176 | .085 | .273 | 2.069 | .040 | .217 | 4.609 | |
| Nurses_and_midwives | -679.158 | 422.678 | -.221 | -1.607 | .110 | .200 | 5.012 | |
| Physicians | 2595.198 | 1064.940 | .302 | 2.437 | .016 | .246 | 4.059 | |
| Health_expenditure_per_capita | 1.287 | 1.195 | .166 | 1.078 | .283 | .160 | 6.262 | |
| Burden_of_disease | -.157 | .119 | -.179 | -1.316 | .190 | .203 | 4.920 | |
| hospital_beds_per_thousand | -103.654 | 462.750 | -.019 | -.224 | .823 | .534 | 1.874 | |
| human_development_index | -784.276 | 16590.293 | -.010 | -.047 | .962 | .088 | 11.422 | |
| a. Dependent Variable: total_cases_per_million | ||||||||
We can see from Table 5 that the "sig" value of most data is larger than 0.05, indicating that most of the independent variables are not significant. We will use the "stepwise" method to eliminate the independent variables that are not closely related to the dependent variables.
Stepwise regression is a method used to identify the most significant independent variables in multiple regression analysis. It involves selecting variables in a step-by-step manner, starting with the variable that has the highest correlation with the dependent variable and adding variables one by one until the model achieves the desired level of significance [9].
The formula for stepwise regression is similar to multiple regression, but with the addition of a stepwise selection process:
Y = β0 + β1X1 + β2X2 + ... + βnXn + ε
where:
Y = dependent variable
X1, X2, ..., Xn = independent variables
β0 = y-intercept
β1, β2, ..., βn = coefficients of independent variables
ε = error term
The stepwise selection process involves selecting the most significant independent variable, then adding the next most significant variable, and so on until the model achieves the desired level of significance. The significance of each variable is determined using a statistical test, such as the F-test or t-test.
| Variables Entered/Removeda | |||
|---|---|---|---|
| Model | Variables Entered | Variables Removed | Method |
| 1 | human_development_index | . | Stepwise (Criteria: Probability-of-F-to-enter <= .050, Probability-of-F-to-remove >= .100). |
Table 6. (continued) |
|||
| 2 | gdp_per_capita | . | Stepwise (Criteria: Probability-of-F-to-enter <= .050, Probability-of-F-to-remove >= .100). |
| 3 | stringency_index | . | Stepwise (Criteria: Probability-of-F-to-enter <= .050, Probability-of-F-to-remove >= .100). |
| a. Dependent Variable: total_cases_per_million | |||
From Table 6"variables entered/remover", the variable "human" entered the "linear regression model" first, and model 1 (the strongest correlation and the closest relationship) was established, followed by the variable "GDP" and the variable "stringency", and model 2 and model 3 were established respectively. And the other variables were removed.
| Model Summaryd | ||||
|---|---|---|---|---|
| Model | R | R Square | Adjusted R Square | Std. Error of the Estimate |
| 1 | .588a | .346 | .342 | 10257.827084 |
| 2 | .610b | .372 | .364 | 10078.387577 |
| 3 | .631c | .398 | .387 | 9898.706080 |
| a. Predictors: (Constant), human_development_index | ||||
| b. Predictors: (Constant), human_development_index, gdp_per_capita | ||||
| c. Predictors: (Constant), human_development_index, gdp_per_capita, stringency_index | ||||
| d. Dependent Variable: total_cases_per_million | ||||
As shown in Table 7 "model summary", since 0.387 is greater than 0.364 is greater than 0.342, the fitting effect of model 3 is better than that of model 1 and model 2.
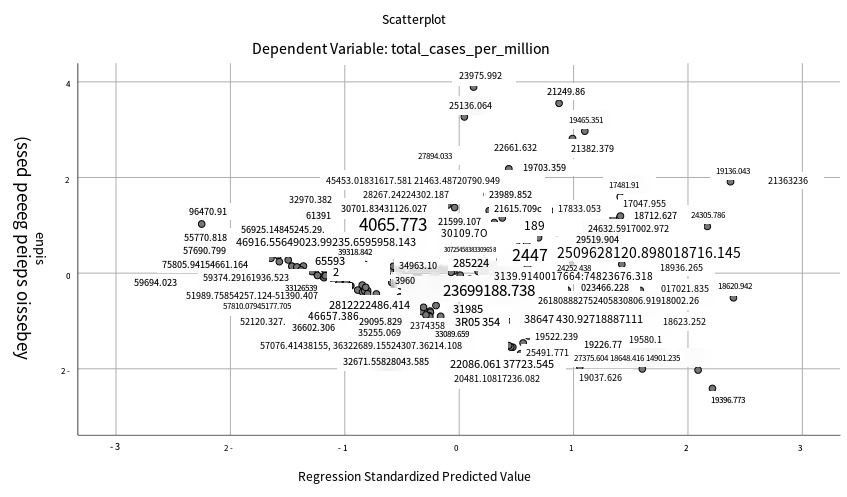
Figure 1. Dependent variable
As figure1 shows, the probability value "sig" of F statistic in Model 3 is 0.00 less than 0.01. With the introduction of independent variables, its significance probability values are all far less than 0.01, which can significantly reject the null hypothesis that the total regression coefficient is 0. It can be seen from the table "anova" that "total_cases_per_million"
There is a linear relationship between "stringency index", "human_development_index" and "gdp_per_capita". As for the strength of the linear relationship, further analysis is needed.
| Excluded Variablesa | ||||||||
|---|---|---|---|---|---|---|---|---|
| Model | Beta In | t | Sig. | Partial Correlation | Collinearity Statistics | |||
| Tolerance | VIF | Minimum Tolerance | ||||||
| 1 | stringency_index | .156b | 2.273 | .024 | .179 | .858 | 1.165 | .858 |
| Liberal_democracy_index_2017 | -.014b | -.175 | .861 | -.014 | .689 | 1.452 | .689 | |
| gdp_per_capita | .253b | 2.584 | .011 | .202 | .416 | 2.406 | .416 | |
| Nurses_and_midwives | -.040b | -.403 | .688 | -.032 | .431 | 2.323 | .431 | |
| Physicians | .181b | 1.626 | .106 | .129 | .330 | 3.030 | .330 | |
| Health_expenditure_per_capita | .181b | 1.872 | .063 | .148 | .437 | 2.289 | .437 | |
| Burden_of_disease | -.152b | -1.134 | .258 | -.090 | .230 | 4.340 | .230 | |
| hospital_beds_per_thousand | -.085b | -1.124 | .263 | -.089 | .731 | 1.369 | .731 | |
| 2 | stringency_index | .175c | 2.598 | .010 | .204 | .850 | 1.177 | .373 |
| Liberal_democracy_index_2017 | -.004c | -.053 | .958 | -.004 | .687 | 1.455 | .340 | |
| Nurses_and_midwives | -.123c | -1.218 | .225 | -.097 | .394 | 2.538 | .321 | |
| Physicians | .205c | 1.867 | .064 | .148 | .328 | 3.049 | .212 | |
| Health_expenditure_per_capita | .046c | .378 | .706 | .030 | .271 | 3.688 | .258 | |
| Burden_of_disease | -.225c | -1.683 | .094 | -.134 | .222 | 4.502 | .148 | |
| hospital_beds_per_thousand | -.052c | -.689 | .492 | -.055 | .707 | 1.414 | .322 | |
| 3 | Liberal_democracy_index_2017 | .001d | .018 | .986 | .001 | .687 | 1.457 | .309 |
| Nurses_and_midwives | -.052d | -.507 | .613 | -.041 | .361 | 2.770 | .266 | |
| Physicians | .207d | 1.926 | .056 | .153 | .328 | 3.049 | .199 | |
| Health_expenditure_per_capita | .070d | .582 | .561 | .047 | .270 | 3.709 | .258 | |
| Burden_of_disease | -.189d | -1.428 | .155 | -.114 | .219 | 4.559 | .146 | |
| hospital_beds_per_thousand | -.023d | -.307 | .759 | -.025 | .690 | 1.448 | .282 | |
| a. Dependent Variable: total_cases_per_million | ||||||||
| b. Predictors in the Model: (Constant), human_development_index | ||||||||
| c. Predictors in the Model: (Constant), human_development_index, gdp_per_capita | ||||||||
| d. Predictors in the Model: (Constant), human_development_index, gdp_per_capita, stringency_index | ||||||||
From Table 8, we can find that the probability values of Model 3's T-test are all greater than "0.05"."Linear regression model" (related concepts of T-test can be inserted) can be introduced, so it should be excluded.
| Coefficientsa | ||||||||
|---|---|---|---|---|---|---|---|---|
| Model | Unstandardized Coefficients | Standardized Coefficients | t | Sig. | Collinearity Statistics | |||
| B | Std. Error | Beta | Tolerance | VIF | ||||
| 1 | (Constant) | -22363.514 | 3727.407 | -6.000 | .000 | |||
| human_development_index | 46984.176 | 5142.220 | .588 | 9.137 | .000 | 1.000 | 1.000 | |
| 2 | (Constant) | -14439.856 | 4776.593 | -3.023 | .003 | |||
| human_development_index | 31504.176 | 7836.979 | .394 | 4.020 | .000 | .416 | 2.406 | |
| gdp_per_capita | .163 | .063 | .253 | 2.584 | .011 | .416 | 2.406 | |
| 3 | (Constant) | -17492.079 | 4836.260 | -3.617 | .000 | |||
| human_development_index | 24714.266 | 8128.737 | .309 | 3.040 | .003 | .373 | 2.683 | |
| gdp_per_capita | .179 | .062 | .278 | 2.875 | .005 | .412 | 2.430 | |
| stringency_index | 137.169 | 52.791 | .175 | 2.598 | .010 | .850 | 1.177 | |
| a. Dependent Variable: total_cases_per_million | ||||||||
As shown in Table 9"coefficients", we can see that all sig values of Model 3 are less than 0.01. Therefore, the multiple linear regression equation should be shown as
\[Y\ = \ - 17492.079 + 24714.266X1 + 0.179X2 + 137.169X3\]
Again, in the last column, "collinearity", the "vif" (pluggable vif and tolerance concept) for all three (expansion) is less than 5. Therefore, there is no collinearity between the three independent variables.
Analyzation
According to the experimental results, the human development index has the strongest correlation with the number of COVID-19 infections. It's important to note that the relationship between HDI and the number of COVID-19 infections is complex, and there may be other factors at play as well [8]. However, these are some possible explanations for the strong relationship observed between HDI and COVID-19 infections:
(1) Healthcare infrastructure: Countries with higher HDI tend to have better healthcare infrastructure, which includes hospitals, medical equipment, and trained healthcare professionals. This allows them to detect and respond to COVID-19 cases more effectively, which may result in a higher number of confirmed cases [10].
(2) Testing capacity: Countries with higher HDI also tend to have greater testing capacity, which means they can test more people for COVID-19. This may lead to a higher number of confirmed cases, as countries with lower HDI may not have the resources to test as many people.
(3) Travel and mobility: Countries with higher HDI tend to have more international travel and mobility, which increases the likelihood of COVID-19 transmission across borders. This may result in a higher number of confirmed cases in these countries.
(4) Population density: Countries with higher HDI also tend to have higher population densities, which can make it easier for COVID-19 to spread. This is because the virus can spread more easily in crowded areas, such as cities.
Similarly, according to the data analysis, we can also see that GDP plays a significant role in the number of COVID-19 infections. Here are some possible explanations:
(1) Economic activity: Countries with higher GDP tend to have more economic activity, which means more people are interacting with each other, both socially and in the workplace. This can increase the likelihood of COVID-19 transmission, as the virus spreads through close contact with infected individuals [11].
(2) Healthcare infrastructure: Countries with higher GDP tend to have better healthcare infrastructure, which includes hospitals, medical equipment, and trained healthcare professionals. This allows them to detect and respond to COVID-19 cases more effectively, which may result in a higher number of confirmed cases.
(3) Testing capacity: Countries with higher GDP also tend to have greater testing capacity, which means they can test more people for COVID-19. This may lead to a higher number of confirmed cases, as countries with lower GDP may not have the resources to test as many people.
(4) Travel and mobility: Countries with higher GDP tend to have more international travel and mobility, which increases the likelihood of COVID-19 transmission across borders. This may result in a higher number of confirmed cases in these countries.
The relationship between medical care and COVID-19 infections is complex and multifaceted. On one hand, medical care plays a crucial role in the prevention, diagnosis, and treatment of COVID-19 infections. Medical professionals are responsible for educating the public about the virus and how to prevent its spread. They are also on the front lines of diagnosing and treating those who have been infected [12].
Medical care has also been critical in the development of vaccines, which are currently the most effective tool we have for preventing COVID-19 infections. Medical professionals have worked tirelessly to develop and distribute vaccines, and their efforts have led to significant reductions in infection rates in many countries.
On the other hand, the COVID-19 pandemic has placed a significant strain on medical care systems worldwide. Hospitals have been overwhelmed with COVID-19 patients, and many healthcare workers have become infected themselves. This has led to shortages of medical supplies and equipment, as well as staff burnout and increased healthcare costs.
In some cases, limited access to medical care has also contributed to higher infection rates. People who lack access to healthcare may be less likely to seek testing Overall, the relationship between medical care and COVID-19 infections is complex and dynamic, with both positive and negative impacts on infection rates [13]. As the pandemic continues to evolve, it will be important for healthcare systems to remain flexible and responsive in order to effectively address the ongoing challenges posed by COVID-19.
Overall, the relationship between medical care and COVID-19 infections is complex and dynamic, with both positive and negative impacts on infection rates. As the pandemic continues to evolve, it will be important for healthcare systems to remain flexible and responsive in order to effectively address the ongoing challenges posed by COVID-19.
Conclusion
Our results showed that of the nine independent variables we screened, only three were significantly associated with outbreaks: the Human Development Index, national GDP and stringengy-index.In the same period, from the outbreak to the present, we used multiple regression and found that among the 9 independent variables selected, only 3 independent variables were related to the outbreak of COVID-19, namely, the human development index, the GDP level of each country, and the stringency-index [14]. Then we use multicollinearity to prove that these three dependent variables are not collinear, where the strongest correlation is the human development index, followed by the GDP of each country and finally, the stringency-index. But because of our limited data and research The Covid-19 pandemic has highlighted the importance of healthcare systems in managing and containing infectious diseases. This article analyzed the relationship between the level of healthcare services and the number of Covid-19 infections, taking into account factors such as detection and contact tracing, case treatment and management, and resource constraints [15]. While countries with stronger healthcare systems may be better able to respond to a pandemic, resource constraints and other factors may also play a role in determining infection rates. The relationship between healthcare and Covid-19 infections is complex and influenced by multiple factors, highlighting the need for sustained investment in healthcare infrastructure and systems.
Recommendation
This article uses the method of data analysis to confirm why the number of people infected with the new crown epidemic in countries with richer democratic medical resources has not decreased. In the article, we reviewed nine COVID-19 data analysis applications and made a classification. Although our conclusions show that the impact of the new crown epidemic is strongly correlated, it does not mean that the impact of the virus is close to being eliminated [16]. Based on this, this paper puts forward the following policy recommendations:
Effective control and management of infectious diseases like Covid-19 require a robust healthcare system. Therefore, governments and policymakers should prioritize sustained investment in healthcare infrastructure and systems, particularly in developing countries, to enhance their capacity to manage future outbreaks. Additionally, there should be more international cooperation and support to aid resource-constrained countries in improving their healthcare systems. Further research and analysis of healthcare-related factors and their impact on Covid-19 infections should be conducted to identify more effective strategies for managing and controlling infectious diseases.
References
[1]. Cerda, Arcadio A., and Leidy Y. García. "Factors explaining the fear of being infected with COVID‐19." Health Expectations 25.2 (2022): 506-512.
[2]. Rashedi, Jalil, et al. "Risk factors for COVID-19." Infez Med 28.4 (2020): 469-474.
[3]. Liu, Tao, et al. "Risk factors associated with COVID-19 infection: a retrospective cohort study based on contacts tracing." Emerging microbes & infections 9.1 (2020): 1546-1553.
[4]. Phoswa, Wendy N., and Olive P. Khaliq. "Is pregnancy a risk factor of COVID-19?." European Journal of Obstetrics & Gynecology and Reproductive Biology 252 (2020): 605-609.
[5]. Wańkowicz, Paweł, Aleksandra Szylińska, and Iwona Rotter. "Assessment of mental health factors among health professionals depending on their contact with COVID-19 patients." International journal of environmental research and public health 17.16 (2020): 5849.
[6]. Stepwise Regression: Definition, Uses, Example, and Limitations. https://www.investopedia.com/terms/s/stepwise-regression.asp
[7]. Allison, Paul D. Multiple regression: A primer. Pine Forge Press, 1999
[8]. Roy, Satyaki, and Preetam Ghosh. "Factors affecting COVID-19 infected and death rates inform lockdown-related policymaking." PloS one 15.10 (2020): e0241165.
[9]. Batory, Don, Jacob Neal Sarvela, and Axel Rauschmayer. "Scaling step-wise refinement." IEEE Transactions on Software Engineering 30.6 (2004): 355-371.
[10]. He, Shan, et al. "Analysis of risk perceptions and related factors concerning COVID-19 epidemic in Chongqing, China." Journal of Community Health 46 (2021): 278-285.
[11]. Khademian, Fatemeh, et al. "An investigation of depression, anxiety, and stress and its relating factors during COVID-19 pandemic in Iran." BMC public health 21.1 (2021): 1-7.
[12]. Sattar, Naveed, Iain B. McInnes, and John JV McMurray. "Obesity is a risk factor for severe COVID-19 infection: multiple potential mechanisms." Circulation 142.1 (2020): 4-6.
[13]. Ustun, Gonca. "Determining depression and related factors in a society affected by COVID-19 pandemic." International Journal of Social Psychiatry 67.1 (2021): 54-63.
[14]. Islam, SM Didar-Ul, et al. "Exploring COVID-19 stress and its factors in Bangladesh: a perception-based study." Heliyon 6.7 (2020): e04399.
[15]. Browning, Matthew HEM, et al. "Psychological impacts from COVID-19 among university students: Risk factors across seven states in the United States." PloS one 16.1 (2021): e0245327.
[16]. Abadía Otero, Jessica, et al. "The nutritional status of the elderly patient infected with COVID-19: the forgotten risk factor?." Current medical research and opinion 37.4 (2021): 549-554.
Cite this article
Li,T.;Pan,Y. (2024). Data analysis based on COVID-19—Important factors in the COVID-19 outbreak. Applied and Computational Engineering,44,8-17.
Data availability
The datasets used and/or analyzed during the current study will be available from the authors upon reasonable request.
Disclaimer/Publisher's Note
The statements, opinions and data contained in all publications are solely those of the individual author(s) and contributor(s) and not of EWA Publishing and/or the editor(s). EWA Publishing and/or the editor(s) disclaim responsibility for any injury to people or property resulting from any ideas, methods, instructions or products referred to in the content.
About volume
Volume title: Proceedings of the 2023 International Conference on Machine Learning and Automation
© 2024 by the author(s). Licensee EWA Publishing, Oxford, UK. This article is an open access article distributed under the terms and
conditions of the Creative Commons Attribution (CC BY) license. Authors who
publish this series agree to the following terms:
1. Authors retain copyright and grant the series right of first publication with the work simultaneously licensed under a Creative Commons
Attribution License that allows others to share the work with an acknowledgment of the work's authorship and initial publication in this
series.
2. Authors are able to enter into separate, additional contractual arrangements for the non-exclusive distribution of the series's published
version of the work (e.g., post it to an institutional repository or publish it in a book), with an acknowledgment of its initial
publication in this series.
3. Authors are permitted and encouraged to post their work online (e.g., in institutional repositories or on their website) prior to and
during the submission process, as it can lead to productive exchanges, as well as earlier and greater citation of published work (See
Open access policy for details).
References
[1]. Cerda, Arcadio A., and Leidy Y. García. "Factors explaining the fear of being infected with COVID‐19." Health Expectations 25.2 (2022): 506-512.
[2]. Rashedi, Jalil, et al. "Risk factors for COVID-19." Infez Med 28.4 (2020): 469-474.
[3]. Liu, Tao, et al. "Risk factors associated with COVID-19 infection: a retrospective cohort study based on contacts tracing." Emerging microbes & infections 9.1 (2020): 1546-1553.
[4]. Phoswa, Wendy N., and Olive P. Khaliq. "Is pregnancy a risk factor of COVID-19?." European Journal of Obstetrics & Gynecology and Reproductive Biology 252 (2020): 605-609.
[5]. Wańkowicz, Paweł, Aleksandra Szylińska, and Iwona Rotter. "Assessment of mental health factors among health professionals depending on their contact with COVID-19 patients." International journal of environmental research and public health 17.16 (2020): 5849.
[6]. Stepwise Regression: Definition, Uses, Example, and Limitations. https://www.investopedia.com/terms/s/stepwise-regression.asp
[7]. Allison, Paul D. Multiple regression: A primer. Pine Forge Press, 1999
[8]. Roy, Satyaki, and Preetam Ghosh. "Factors affecting COVID-19 infected and death rates inform lockdown-related policymaking." PloS one 15.10 (2020): e0241165.
[9]. Batory, Don, Jacob Neal Sarvela, and Axel Rauschmayer. "Scaling step-wise refinement." IEEE Transactions on Software Engineering 30.6 (2004): 355-371.
[10]. He, Shan, et al. "Analysis of risk perceptions and related factors concerning COVID-19 epidemic in Chongqing, China." Journal of Community Health 46 (2021): 278-285.
[11]. Khademian, Fatemeh, et al. "An investigation of depression, anxiety, and stress and its relating factors during COVID-19 pandemic in Iran." BMC public health 21.1 (2021): 1-7.
[12]. Sattar, Naveed, Iain B. McInnes, and John JV McMurray. "Obesity is a risk factor for severe COVID-19 infection: multiple potential mechanisms." Circulation 142.1 (2020): 4-6.
[13]. Ustun, Gonca. "Determining depression and related factors in a society affected by COVID-19 pandemic." International Journal of Social Psychiatry 67.1 (2021): 54-63.
[14]. Islam, SM Didar-Ul, et al. "Exploring COVID-19 stress and its factors in Bangladesh: a perception-based study." Heliyon 6.7 (2020): e04399.
[15]. Browning, Matthew HEM, et al. "Psychological impacts from COVID-19 among university students: Risk factors across seven states in the United States." PloS one 16.1 (2021): e0245327.
[16]. Abadía Otero, Jessica, et al. "The nutritional status of the elderly patient infected with COVID-19: the forgotten risk factor?." Current medical research and opinion 37.4 (2021): 549-554.