


1. Introduction
Since its development, the stock market has brought huge returns to many investments. Therefore, there are a large number of investors who blindly invest all their funds in the stock market in pursuit of short-term interests. However, high-profit gains are consistently accompanied by high risks. Thus, a large number of investors have suffered capital losses due to lack of consideration and prediction of risk factors in the stock market. Numerous factors affect the stock market e.g. national economic conditions, policy control, military politics, natural disasters. These uncontrollable factors will bring about stock price fluctuations, which are inevitable and ubiquitous in the financial market [1].
Currently, the combination of advanced technology and innovative investment strategies has driven a significant shift in the financial landscape. Driven by contemporary technological concepts such as data science, cloud computing, and big data, the financial market has introduced quantitative investment methods based on machine learning. Machine learning (ML) is an area of study focused on comprehending and constructing techniques for “learning.” This involves using data to enhance the execution of specific tasks [2]. It can perform data-based learning algorithms, including Reinforcement learning, K-nearest neighbors algorithm [3], and Random forest algorithm [4]. These algorithms have revolutionized data analysis. Machine learning models need to be trained using historical data, these training datasets can include a wide range of information, such as text, images, numbers, and so on. After training, these models have the capability to identify patterns, make estimations or decisions. With the fast advancement of artificial intelligence, machine learning has gained the capability to swiftly analyze, fitting, and predict extensive datasets [5]. Within the domain of finance, machine learning enhances the ability to extract valuable insights from complex financial data, and accomplish the discovery of hidden patterns and interconnections.
Quantitative investment is a trading approach in which buying and selling orders are issued through quantitative methods and models to achieve consistent returns. A quantitative trading model can be built by mining and analyzing the stock information gathered and accumulated in the present market. Quantitative investment has been developed in the world for over three decades. Its investment performance remains steady, its market dimensions and participation have continued to expand, and it has garnered recognition from an increasing number of global market participants [6]. The size of funding administered by quantitative and programmatic trading is continuously increasing. Quantitative investment strategies elaborately quantify stock parameters such as past performance, instability, and interrelationships with precision, thus providing a well-organized and data-based foundation for investment management. However, the traditional quantitative method frequently struggles to swiftly adjust to rapid market dynamics and handle intricate datasets [7]. Thus in this paper, ML models are utilized to forecast daily stock price change trends. This study helps to enrich the theoretical basis in the field of stock prediction and provides reference value for investors’ stock selection.
2. Methodology
2.1. Data Preparation
In this study, the author chose three US stocks from different fields as sample stocks to construct the model, namely GOOGL, JPM, and TSLA. All datasets are sourced from dependable stock market trading websites, ensuring authenticity. To achieve realistic prediction results, these input datasets were denoised, normalized, and divided into a training dataset and a testing dataset. To achieve a better effect of data smoothing, this paper also employs the Ensemble Empirical Mode Decomposition for denoising the original data.
In this study, the Quote_change column is selected as a label and the rest of the columns in the data frame are treated as features. A two-layer LSTM model is used to extract data features, and two fully connected layers are applied to generate predictions. After the prediction data is obtained, it is visualized and juxtaposed with the test set for comparison. Finally, the model is evaluated and summarized based on the prediction outcomes and the evaluation metrics. The general experimental process is illustrated in Figure 1.
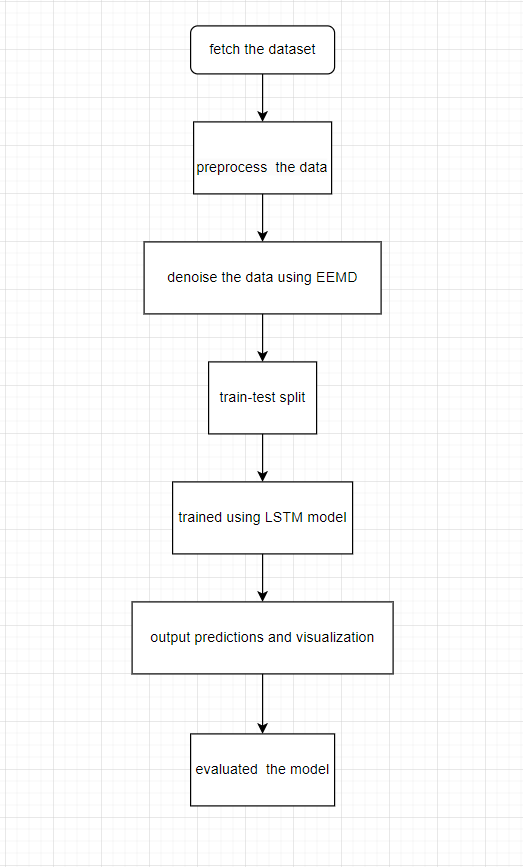
Figure 1. General experimental procedure in this study.
2.2. Ensemble Empirical Mode Decomposition
Empirical Mode Decomposition (EMD) represents a data-responsive multiscale approach Engineered to disassemble an input signal into its components with concrete physical meaning. On the basis of EMD, Ensemble EMD(EEMD) introduces distinct random variations to the input signal on each decomposition of the original signal [8].
The Python library deemed is used to perform the ensemble empirical mode decomposition operation. After multiple iterations of decomposition, multiple different Intrinsic Mode Functions (IMFs) and a residue can be obtained. Selecting valid patterns and summing all the selected patterns with the residue can reconstruct the decomposed signal since the extracted patterns are almost in a mutually orthogonal manner, forming a comprehensive collection. As an example, Figure 2 depicts the IMFs of stock price data after decomposition, the top blue line represents the original stock price function.
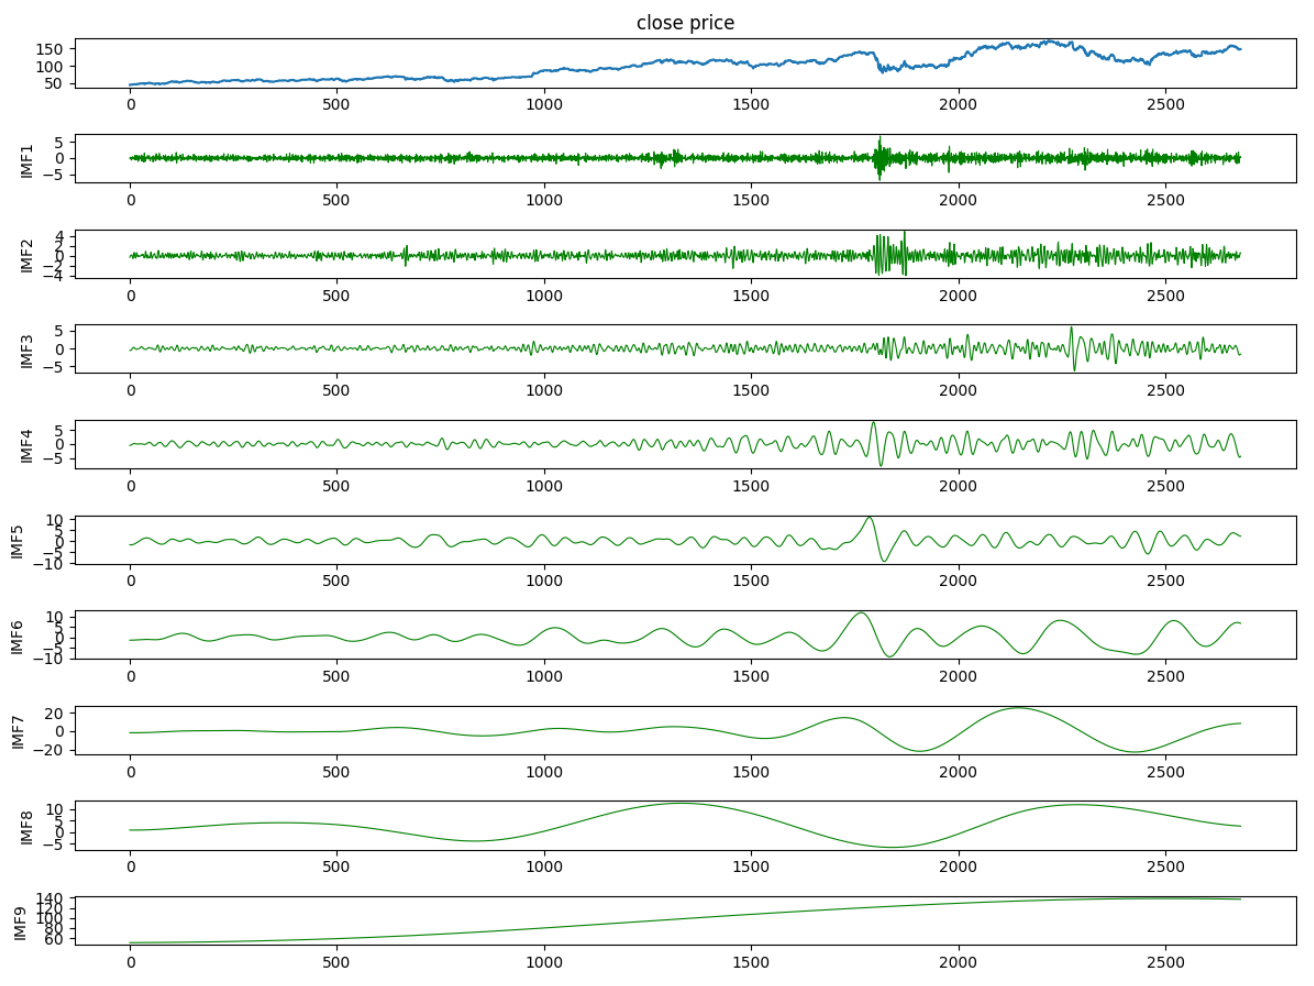
Figure 2. Outcomes of Empirical Mode Decomposition applied to the noisy signal.
2.3. Long Short-Term Memory (LSTM)
Long Short-Term Memory (LSTM) network is a specialized form of RNN. Using LSTM enables the effective convey and expression of information within long-term sequences, preventing the neglect of valuable information from long ago, and it can also solve the challenge of vanishing and exploding gradients that often occur during long-sequence training [9]. The distinguishing factor of LSTM that stands out from RNNs is the hidden state of neurons. The hidden state of a neuron can be understood as the memory of the input data retained from the input data within the recurrent neural network. The long-term memory capability of the LSTM model enables it to handle complex nonlinear relationships, thereby enhancing its ability to forecast market fluctuations [10].
An LTSM cell can be segregated into four primary sections: the forgetting gate, the input gate, and the output gate, along with the information storage cell, as depicted in Figure 3. In the initial stage, the forgetting gate takes input along with a control signal and generates an output value within the range of 0 to 1 for every memory element. 1 stands for ‘retain entirely,’ while 0 indicates ‘discard completely’. Then the input gate controls the proportion of input that is allowed to enter the memory cell. In the final step, the output gate determines the value that gets produced [11].
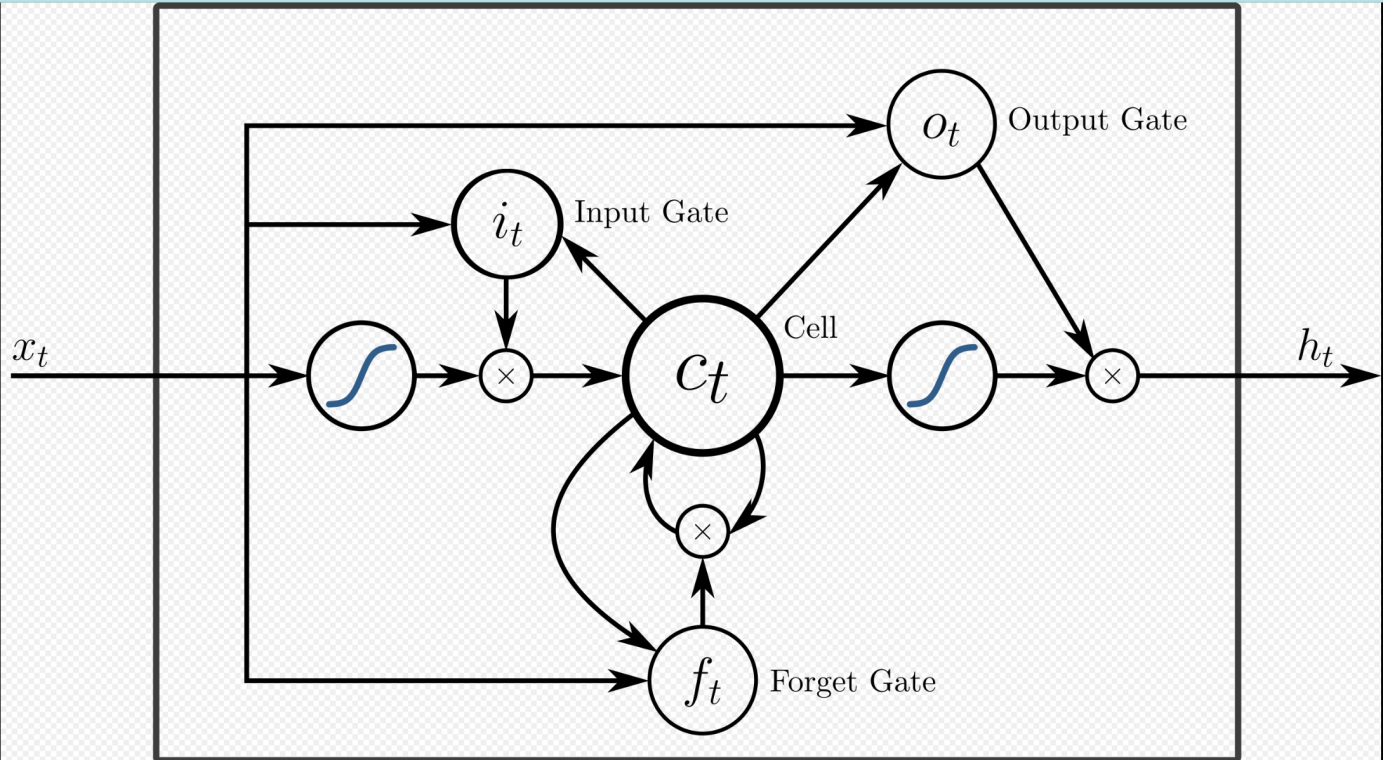
Figure 3. The primary architecture of the LSTM network.
2.4. Implementation details
Adam is used as an optimizer during the training, it is an optimizer with adaptive learning rate. Adam combines momentum gradient descent and RMSProp and it has outstanding performance across various cases. The learning rate was set to be 0.01 and a dropout layer with a dropout ratio of 0.1 was used at each LSTM layer to randomly turn off a subset of neurons during training. In order to further prevent the occurrence of overfitting, L2 norm penalty is also utilized in the training process by using the command weight_decay in the initialization of the Adam optimizer. L2 regularization operates by appending the network’s loss function with a regularization term, this penalty term is associated with the weight parameters of the model.
To assess the effectiveness of the LSTM model, three commonly used evaluation metrics, RMSE, MAE, and MAPE, were employed. Root Mean Square Error (RMSE), Its advantages include being sensitive to outliers, since the square of the error is included in the calculation, thereby amplifying larger errors. Mean Absolute Error (MAE) are less are less susceptible to the influence of outliers in data because they use absolute values, not the square of the error. Consequently, in cases where robustness to outliers is required, MAE and MAPE can be used. MAPE typically expresses errors as a percentage, therefore, it can assist in understanding the average percentage prediction error of the model.
3. Experiment results and discussion
The three original stock data close price as follows:
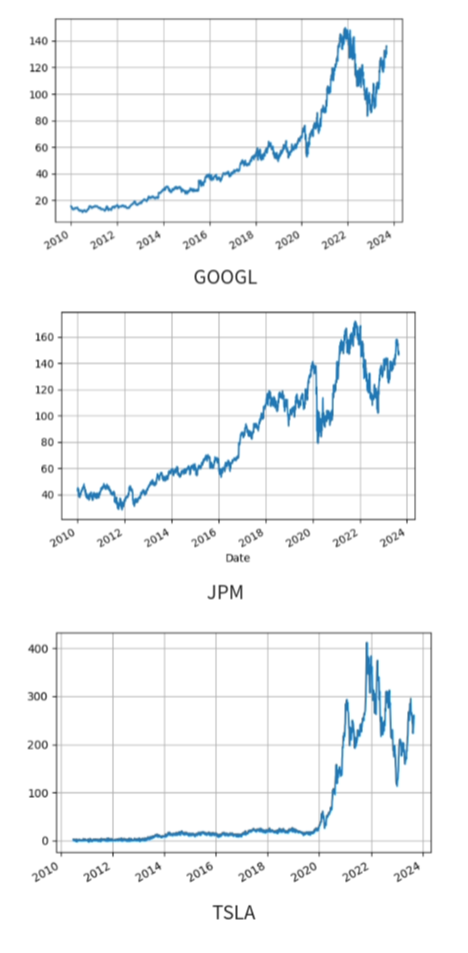
Figure 4. Original stock data close price.
The closing price data shown in Figure 4 was utilized to compute the quote changes, which were then stored as a new column. Subsequently, those quote change data points have undergone a decomposition process using EEMD into 9 IMFs and the IMFs containing high-frequency noise have been discarded. Those remaining IMFs, along with the residue, have been used to reconstruct the denoised signal with 3400 data points as following:
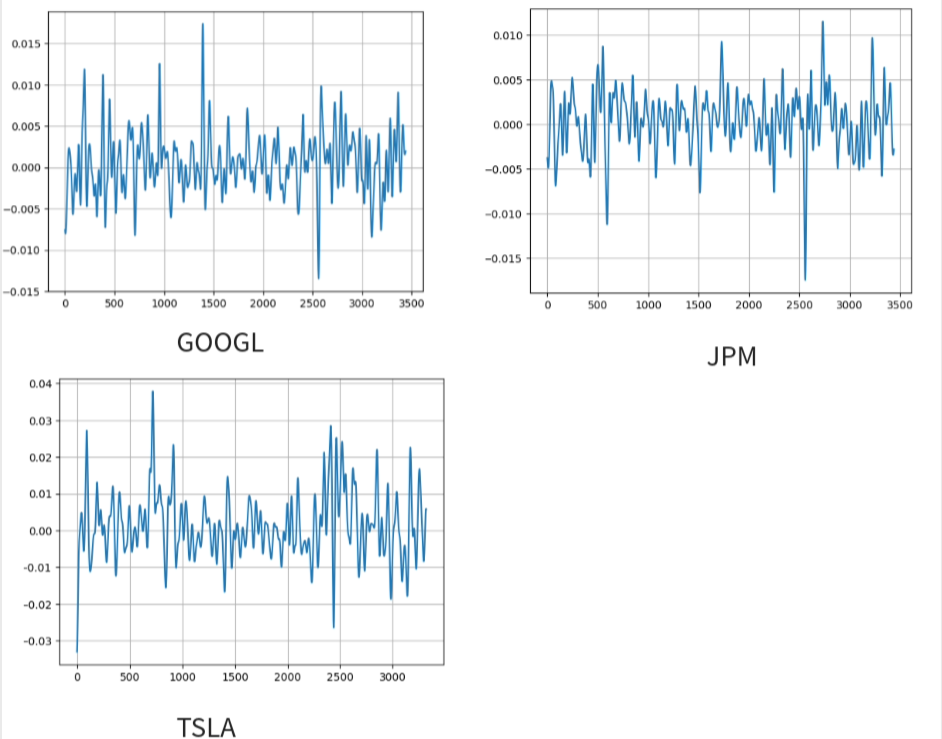
Figure 5. Denoised data of quote changes.
After the dataset has been denoised shown in Figure 5, it undergoes a train-test split with the test proportion being 0.2. The training sets have been thought into the LSTM networks for learning. Once the training is finished, the predicted curve is plotted on a graph alongside the original data for visual comparison.
The output of the Long Short-Term Memory networks with the EEMD denoising model on the test sets is as shown in Figure 6 as follows:
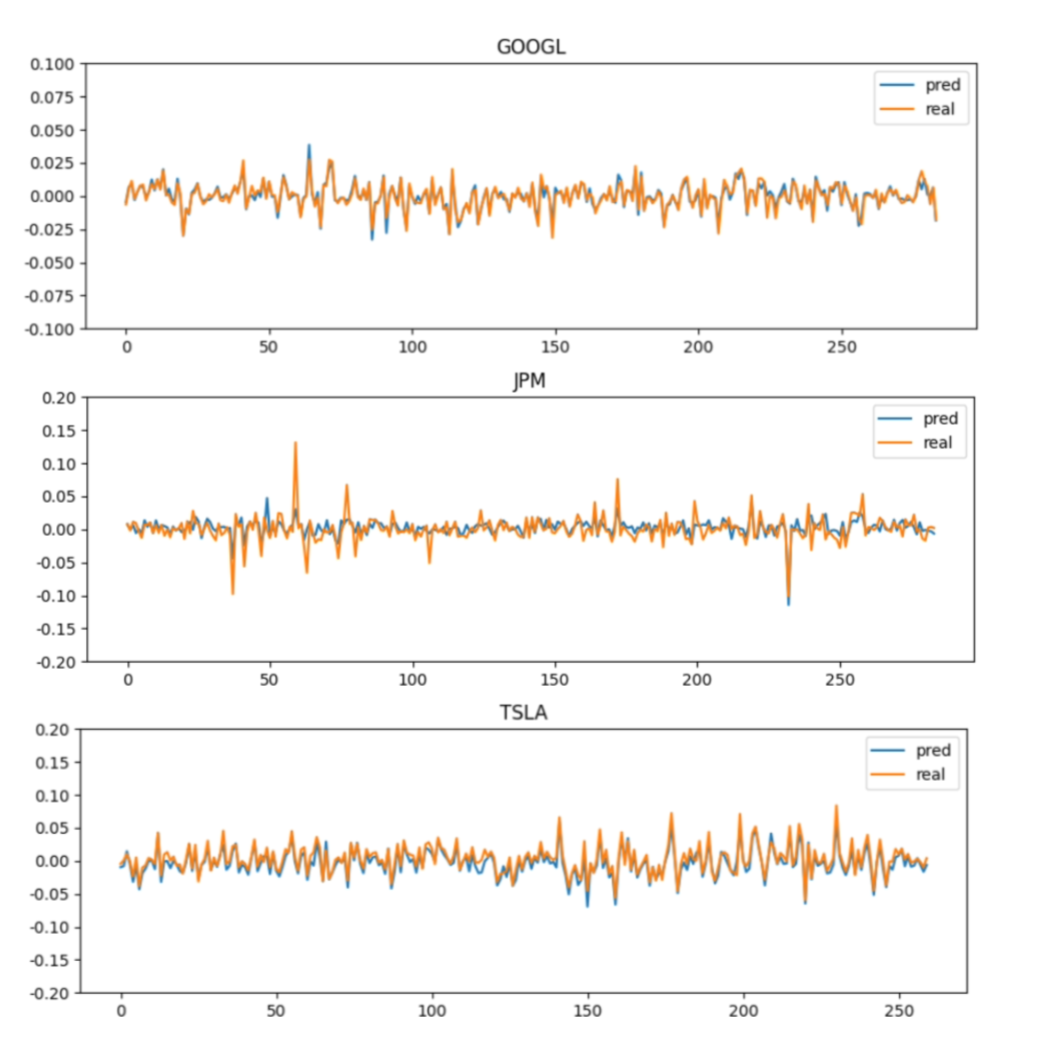
Figure 6. Predictions and real data.
The blue curves represent the quote changes predicted by the LSTM network, while the yellow ones stand for the actual 264 quote-change data points in the test sets of those three stocks. As shown in Figure 6, the goodness of fit for the two stocks of GOOGL and TSLA is better than that of JPM, aligning more closely with the actual stock data. This could be due to the fact that JPM’s raw data contains more fluctuations. JPM’s raw data also contains more outliers, which may be related to the nature of its company. Throughout the training process, the fit of the model to outliers is not as high as the regular curves. This results in the prediction accuracy for JPM being less impressive compared to that of GOOGL and TSLA. These results can be used to help a quantitative investor in stock selection.
To gain a deeper insight into the correspondence between the forecasted values and the actual values, the following analysis indicators, RMSE, MAE, and MAPE of the predicted curves are calculated as follows:
Table 1. RMSE, MAE, and MAPE of the predicted curves.
RMSE | MAE | MAPE | |
GOOGL | 0.0006 | 0.051 | 5.131 |
JPM | 0.0014 | 0.131 | 13.168 |
TSLA | 0.0009 | 0.035 | 3.548 |
As depicted in Table 1, the MAE and MAPE indicators of JPM are considerably higher than those of GOOGL and TSLA, while GOOGL has a bit lower RMSE than JPM and TSLA. According to the above experimental results and images, the prediction effect of TSLA is the best, and the prediction curve of JPM is comparatively less satisfactory.
4. Conclusion
This experiment formulates a stock price change estimation model based on LSTM neural network and EEMD noise reduction method that can predict the daily rise of a stock. The model was tested on three US stocks and got satisfactory results. Through the utilization of the LSTM neural network model and EEMD denoising method,this experiment has successfully predicted stock data and achieved satisfactory prediction performance. The experimental results demonstrate that the LSTM has potential in analyzing stock data. Also, the experimental results show that in a stock market with a high signal-to-noise ratio, the EEMD method can be applied for data denoising and has a beneficial effect. In future work, larger data sets can be used for training, and the outliers of the data can be further processed. Furthermore, the results of model predictions can be used to assist in making quantitative investment strategies and the performance of this strategy can be evaluated through back testing.
References
[1]. Lu Z et al 2022 Machine Learning in Stock Market Movement Intelligent Forecast System 2022 International Conference on Data Analytics Computing and Artificial Intelligence (ICDACAI) Zakopane Poland 2022 pp. 402-406
[2]. Kumar M et al 2023 A Conceptual introduction of Machine Learning Algorithms 2023 1st International Conference on Intelligent Computing and Research Trends (ICRT) Roorkee India pp. 1-7
[3]. Zhang S et al 2017 Learning k for knn classification. ACM Transactions on Intelligent Systems and Technology (TIST) 8(3) pp 1-19
[4]. Rigatti S J 2017 Random forest Journal of Insurance Medicine, 47(1) pp 31-39
[5]. Xiang Z et al 2020 Review of Machine Learning Algorithms for Health-care Management Medical Big Data Systems 2020 International Conference on Inventive Computation Technologies (ICICT) Coimbatore India 2020 pp 651-654
[6]. Fan X et al 2014 A quantitative investment model based on multi-fractal theory and support vector machine 2014 International Conference on Computing Management and Telecommunications (ComManTel) Da Nang Vietnam pp 239-244
[7]. Tang C et al 2018 Design and Research of Intelligent Quantitative investment Model Based on PLR-IRF and DRNN Algorithm 2018 IEEE 4th Information I Technology and Mechatronics Engineering Conference (ITOEC) Chongqing China pp 1187-1191
[8]. Shang-yue Z et al 2015 EMD interval thresholding denoising based on correlation coefficient to select relevant modes” 2015 34th Chinese Control Conference (CCC) Hangzhou China 2015 pp 4801-4806
[9]. Weng X et al 2022 Stock Price Prediction Based on Lstm and Bert 2022 International Conference on Machine Learning and Cybernetics (ICMLC) Japan pp 12-17
[10]. Guo Y 2020 Stock Price Prediction Based on LSTM Neural Network: the Effectiveness of News Sentiment Analysis 2020 2nd International Conference on Economic Management and Model Engineering (ICEMME) Chongqing China pp 1018-1024
[11]. Fu S et al 2023 IBM Stock Forecast Using LSTM GRU Attention and Transformer Models 2023 IEEE International Conference on Control Electronics and Computer Technology (ICCECT) Jilin China pp 167-172
Cite this article
Li,T. (2024). Stock prediction and analysis based on machine learning algorithms. Applied and Computational Engineering,50,15-22.
Data availability
The datasets used and/or analyzed during the current study will be available from the authors upon reasonable request.
Disclaimer/Publisher's Note
The statements, opinions and data contained in all publications are solely those of the individual author(s) and contributor(s) and not of EWA Publishing and/or the editor(s). EWA Publishing and/or the editor(s) disclaim responsibility for any injury to people or property resulting from any ideas, methods, instructions or products referred to in the content.
About volume
Volume title: Proceedings of the 4th International Conference on Signal Processing and Machine Learning
© 2024 by the author(s). Licensee EWA Publishing, Oxford, UK. This article is an open access article distributed under the terms and
conditions of the Creative Commons Attribution (CC BY) license. Authors who
publish this series agree to the following terms:
1. Authors retain copyright and grant the series right of first publication with the work simultaneously licensed under a Creative Commons
Attribution License that allows others to share the work with an acknowledgment of the work's authorship and initial publication in this
series.
2. Authors are able to enter into separate, additional contractual arrangements for the non-exclusive distribution of the series's published
version of the work (e.g., post it to an institutional repository or publish it in a book), with an acknowledgment of its initial
publication in this series.
3. Authors are permitted and encouraged to post their work online (e.g., in institutional repositories or on their website) prior to and
during the submission process, as it can lead to productive exchanges, as well as earlier and greater citation of published work (See
Open access policy for details).
References
[1]. Lu Z et al 2022 Machine Learning in Stock Market Movement Intelligent Forecast System 2022 International Conference on Data Analytics Computing and Artificial Intelligence (ICDACAI) Zakopane Poland 2022 pp. 402-406
[2]. Kumar M et al 2023 A Conceptual introduction of Machine Learning Algorithms 2023 1st International Conference on Intelligent Computing and Research Trends (ICRT) Roorkee India pp. 1-7
[3]. Zhang S et al 2017 Learning k for knn classification. ACM Transactions on Intelligent Systems and Technology (TIST) 8(3) pp 1-19
[4]. Rigatti S J 2017 Random forest Journal of Insurance Medicine, 47(1) pp 31-39
[5]. Xiang Z et al 2020 Review of Machine Learning Algorithms for Health-care Management Medical Big Data Systems 2020 International Conference on Inventive Computation Technologies (ICICT) Coimbatore India 2020 pp 651-654
[6]. Fan X et al 2014 A quantitative investment model based on multi-fractal theory and support vector machine 2014 International Conference on Computing Management and Telecommunications (ComManTel) Da Nang Vietnam pp 239-244
[7]. Tang C et al 2018 Design and Research of Intelligent Quantitative investment Model Based on PLR-IRF and DRNN Algorithm 2018 IEEE 4th Information I Technology and Mechatronics Engineering Conference (ITOEC) Chongqing China pp 1187-1191
[8]. Shang-yue Z et al 2015 EMD interval thresholding denoising based on correlation coefficient to select relevant modes” 2015 34th Chinese Control Conference (CCC) Hangzhou China 2015 pp 4801-4806
[9]. Weng X et al 2022 Stock Price Prediction Based on Lstm and Bert 2022 International Conference on Machine Learning and Cybernetics (ICMLC) Japan pp 12-17
[10]. Guo Y 2020 Stock Price Prediction Based on LSTM Neural Network: the Effectiveness of News Sentiment Analysis 2020 2nd International Conference on Economic Management and Model Engineering (ICEMME) Chongqing China pp 1018-1024
[11]. Fu S et al 2023 IBM Stock Forecast Using LSTM GRU Attention and Transformer Models 2023 IEEE International Conference on Control Electronics and Computer Technology (ICCECT) Jilin China pp 167-172