


1. Introduction
The constant upgrading of technology has had a huge impact on people's lives, which are much more advanced than in the past, when they had to rely on a single, outdated technology. The emergence of new technologies and the continuous innovation of old technologies have led to radical changes in various fields. Since entering the 21st century, the rapid development of data science is the most obvious, more and more fields began to use data analysis technology, and the results obtained after the data analysis as the next step in the planning and strategy of the standard, which makes both enterprises and individuals can work on the analysis of the market situation, to facilitate the formulation of future development programmes. However, there are some specific areas that need to be mentioned, such as the stock market. There are many factors affecting the stock price market, and many imperceptible factors can affect the rise or fall of stock prices, which is why the pattern of change in stock prices is difficult to discover. It is because of this unpredictable change that the risk of investing in stocks is increased to some extent, from small investors who may lose money due to the fluctuation of stock prices, to large corporations who may reduce their market value due to the changes in the stock market. Therefore, collecting information about the stock price market from various aspects and analysing them into data will be of great help to investors in understanding the stock market and predicting the trend of the stock price, in addition to formulating a specific decision plan for the results of the analysis, the risk of investing in the stock market will be greatly reduced, and more economic returns will be obtained [1], so as to achieve a desirable result.
Then, it is necessary to adopt suitable techniques to forecast the stock prices, however, it has been found through earlier studies that the stock market is characterised by two main types of characteristics including noise as well as volatility, which are considered to be the most difficult part of many time forecasting sequences [2]. So much so that how to improve the accuracy of stock price prediction is still a problem waiting to be solved nowadays. After years of analysis by scientific and technological researchers, it has been found that many data analysis models rely on time forecasting series and commonly use the analytical methods of autoregressive models (AR) [3], moving average models (MA) [4], autoregressive moving average models (ARMA) [5] and autoregressive integrated moving average models (ARIMA) [6]. They usually classify data and make assumptions to represent the relationship between those unknown quantities with known quantities. These forecasting methods are very useful in the face of complex and volatile non-linear changes in the stock market. When it is difficult to produce effective predictions. With the introduction of new technological tools, more and more fields have started to use new time series forecasting models, also known as machine learning models. For example, Support Vector Regression (SVR) [7] and Artificial Neural Networks (ANN) [8] have achieved considerable results [9]. Deep learning is popular with researchers due to its excellent ability to analyse data and is well suited to tackle difficult problems such as stock price market prediction. This also shows that deep learning will have an excellent development in the field of economics and finance, but it is not yet perfect in this field [10]. However, the stock price market is not entirely scientific and appreciable as the irrational behaviour of human beings in the process of stock trading may create volatility in the stock market. Many studies have shown that as investors invest in stocks, their emotions more or less affect their investments and this is the reason why emotional changes cannot be ignored. Researchers Antweiler and Frank, after conducting tests on arithmetic average stock price index and analysing the relevant content of emails came to important conclusions [11]. In other words, the content of emails can have a not insignificant impact in predicting changes in the stock market, and after proving this, it was concluded that there is some kind of link between internet comments and stock trading volume. In addition, there are other researches that show that emotions can have a non-negligible influence in the investment process, and this study will also include the analysis of emotions in the prediction of stock prices, in order to get better prediction results [12].
This study will include sentiment analysis of investors in stock price forecasting, which will help to improve the accuracy of the forecasting results. The source of the sentiment analysis index consists of a large number of stock market sentiment analyses to get feedback on investor sentiment with different comments on the rise and fall of stocks. At the same time, the sentiment analysis index will be used along with the historical stock price data as an input to the stock price prediction model. A special type of RNN, or LSTM model, will be used in the implementation of the stock price prediction model, with the help of which it has the capability of analysing the time series in a memorable way to get more accurate results. The aim of this paper is to get a better stock price prediction model which is more accurate and requires less response time. This implementation of this model will be followed by the implementation of the LSTM model as well as the Sentiment Analysis model, and after the completion of the developed scenario the results of the experiments will be analysed and discussed, and finally conclusions will be drawn.
2. Data and method
This section contains the dataset used for the experiment and the techniques used for stock price prediction. In terms of data collection, the previous google stock price data is used as the training data collection of the model, which contains the date of stock trading, divided according to the unit of days, and the daily trading data contains the opening price of the stock, the highest peak price of the stock, the lowest peak price of the stock, and the closing price of the stock, as well as the stock turnover indicators. After completing the data analysis, a collection of test data for stock price prediction is obtained, and the accuracy of the model is judged by intuitive image visualisation. For the sentiment analysis, data from the kaggle site that is derived from investor comments on stock trading price changes is used as input to the google stock price prediction, so that as much investor sentiment as possible can be used in the prediction model.
As a special kind of RNN, LSTM differs from RNN in that LSTM is a Long short-term memory model, which is widely used in analysing complex and difficult time prediction sequences, and can cope well with longer intervals and delays. Representative neural network models such as CNNs usually give good results when performing the task of analysing already completed classifications, but do not give good results when confronted with complex relationships between data. In early research, it was found that RNN models can produce unpredictable problems such as loss of model gradient or sharp increase in model gradient. To avoid these situations, Hochreiter and Schmidhuber proposed a special form of RNN, LSTM, in 1997, which is faster and more efficient in saving and using data information than RNN, and has gradually become a fundamental part of other models [13].
LSTM can be better employed for time series prediction compared to other models and many researchers have proved this, for example, researchers Shi et al. et al. used improved LSTM in the problem of precipitation time prediction sequences and finally concluded that for rainy day precipitation prediction models’ better results are achieved by using the LSTM model [14]. LSTM can be better employed for time series prediction compared to Random Forest (RAF), Deep Neural Networks (DNN) and Logistic Regression Analyser (LOG) which do not have a memory form of classification like LSTM, can do better time series prediction, as confirmed in researcher Fischer's experiments [15]. Thanks to the excellent ability of LSTM to analyse the non-linear structure, this paper uses LSTM to predict the stock price of google, which is analysed through the previous data in terms of days, to get better prediction results. However, in the process of trading in the stock market, the inner changes of human beings cannot be ignored, that is, the sentiment analysis of investors involved in stock trading is indispensable, and for this reason, the sentiment analysis is then added to the stock price prediction model to improve the accuracy of the training dataset obtained in the end.
For many years, people have believed that the influence of stock prices and stock exchange market is due to the continuous updating of data and information, or the difference in competitiveness between different enterprises and different levels of technology. In fact, the influence of emotion is often overlooked, and in behavioural economics some researchers have shown that emotion is an important influence in the process of making decisions and choices [16]. Short-term hesitation when faced with an opportunity leads to loss of earnings, when the investment encountered risk and the feeling of failure, these will have an impact on the trend of stock prices. Although stock price trends have been shown to have a strong link with investor evaluations, sentiment analysis has rarely been used as an input to stock price prediction models. For example, researcher Zhou used a model with SVM-ES as the main component in the stock price prediction process and included investor evaluations from certain Internet stock trading websites, which included joy due to investment success and bitterness due to investment failure, etc., and the results of the experiment were significantly improved compared with those before the improvement [17]. In building the stock price prediction model, sentiment analysis will be added as a parameter to be considered in the model. For the sentiment analysis process, the investor comments will be classified into the joy of the stock price increase and the sadness of the stock price decrease, and to better match the use of google stock price data, the daily sentiment index will be obtained by calculating the investor comments that have completed the classification. A large amount of data information will be used in the sentiment analysis process to improve the accuracy of the results predicted by the model.
3. Results and discussion
In this section, it will involve obtaining a sentiment index after analysing the investor sentiment comments after completing the construction of the sentiment analysis model. Stock prices will be predicted using LSTM model and finally on completion of the experiment, the results will be explained. Many studies of time series forecasting use a single piece of data as an input to the forecasting model and usually do not take other factors into account. In the stock trading market, complex changes as well as changes in investors' psychological sentiment can have an unpredictable impact on the stock price market. Therefore, in stock price forecasting experiments, the primary consideration is the change in investor sentiment, which is set into two categories of positive and negative sentiment through the different reactions of investors to the rise and fall of stocks, and then the sentiment index is calculated. At the same time, compared with the stock price prediction of such a complex time series prediction, a single data and easy to understand the simple sequence in the prediction process is easier to operate, so the google stock price data is simply decomposed, so that the complex sequence into a simple sequence that is easy to analyse, and then use the LSTM model on the decomposed simple sequence data prediction, and finally derive the results of the experiments and analysed.
In order to construct the sentiment analysis model, google's past data on stock prices and trading volume are combined with data on sentiment changes generated by investors commenting on the trading prices of stocks originating from the kaggle website, and the two are combined as an important part of implementing the stock price prediction model. Many of the comments are in the form of textual information, which cannot be used directly and needs to be formatted, and for this reason, the investor comment data used can be divided into two categories: Chinese and English. For the English comment information, according to the punctuation mark or space for division, that is, the decomposition of an independent word. For Chinese comments, according to the Chinese language logic will be divided into a longer sentence into some independent words, it is easy to use python specially prepared for the Chinese language Chinese lexical library jieba, decomposition of text information will be much easier, and then use python unique cut function to decompose the information as input data. In order to calculate the required sentiment analysis index, a modified CNN model is used to analyse the sentiment change information provided by a large number of investors, and this index can intuitively reflect the psychological sentiment change of investors, and is also an important indicator for the final results of the sentiment analysis. The method proposed by Antweiler and Frank is used to calculate the daily sentiment index of the stock in the calculation of the sentiment index [18]:
\( B{I_{t}}=ln{(\frac{1+M_{t}^{bullish}}{1+M_{t}^{berish}})} \) (1)
Here, the sentiment index on day t is expressed through BIt , on day t, Mbullish shown in the above formula means the weight of the investors who feel that the price of the stock has risen on that day, while Mbearish is expressed as the weight of the investors who feel that the price of the stock has fallen on that day, and the two variables are derived through the information about the comments made by the investors. The index calculated through this formula indicates the change in sentiment that occurs after an investor sees a relevant comment about a stock price going up or down during a certain period. This index also varies with the change in the ratio between the two quantities of change. After analysing the information from the comments and setting the BIt to behave positively when the results appear to show more of a rising stock price sentiment, then the overall change in sentiment is identified as a feeling that the stock price will rise with this result. On the other hand, the overall sentiment change is recognised as a decrease in the stock price, and the BIt index is negative. After this setup and actual experimentation, the resulting sentiment index is combined with historical stock price data from google and used as input data for the next prediction of stock price changes.
For constructing the LSTM model, at the beginning stage of the design, different parts were planned and the whole was divided into three categories, including the input layer, the LSTM layer and the output layer. Firstly, the input layer, this phase will use as input the mixed data information which combines the sentiment index obtained through sentiment analysis and the daily stock price change data from google. This data information is set as the basic unit of data and is provided to the LSTM layer in a pre-planned order of model design. As the most important part of the model, the LSTM layer is not composed of a single LSTM unit; it consists of many identical neural units, which depend on the time unit selected for the stock price prediction model. At the stage of selecting the basic time unit, it was chosen to use the historical stock price data of the previous 15 days to predict the stock price of the next day, therefore, there are 15 basic constituent units in the LSTM layer. The output values produced by each unit are used by the next unit as new input values. After the analysis of the LSTM layer the data obtained will enter the output layer, after the output layer output the results of the prediction of the stock price collation layer test dataset, the test dataset will be obtained compared with the training dataset that enters the input layer, and the intuitive comparison of the two will be reflected in the implementation of the results of the output of the visual graphical interface, in order to further analyse the prediction of the results of the size of the difference in the actual results of the data as well as prediction accuracy of the results. Fig. 1 shows the general flow of the experimental model.
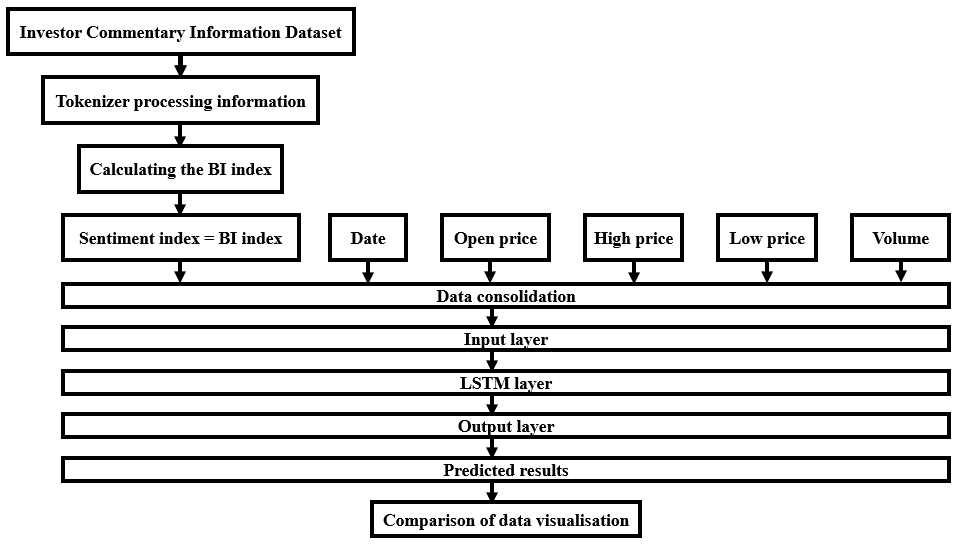
Figure 1. The structure of LSTM with Sentiment analysis (Photo/Picture credit: Original).
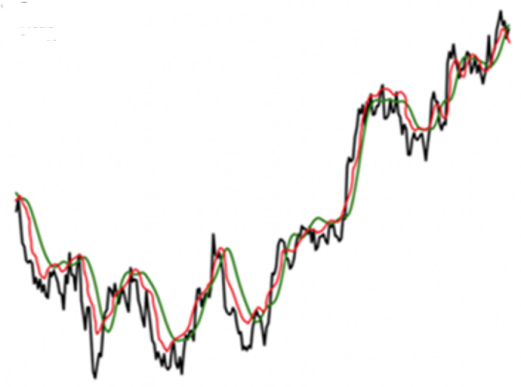
Figure 2. Stock Price Prediction By three models, where the black, red and green line represents for raw data, LSTM with and without sentiment analysis (Photo/Picture credit: Original).
In order to construct LSTM prediction models and sentiment analysis models, it is important to use appropriate technical tools. For this reason, the models in this paper are designed to be coded entirely in python, relying on the wide variety of powerful third-party libraries of functions and methods in python, which require only some simple coding to be performed to obtain the predictive models. The third party libraries used in designing the model include numpy, pandas, scipy, sklearn, keras, etc. numpy can provide computational help for higher dimensional arrays and matrices, while pandas is very effective in analysing the data, and scipy provides a variety of mathematical algorithms and function models that can be used to carry out input dataset mathematical calculations, sklearn, a widely used third party library in the field of machine learning, greatly reduces the amount of coding and coding time, it is also an indispensable part of the experimental prediction model, and the high responsiveness of keras reduces the time needed to analyse the data in the experiments, and for this reason predictions can be made more quickly. Finally, the use of matplotlib, a third-party library that allows the plotting of images, will allow the output of the results of the experiments in the most direct form, which will help to analyse the predictive accuracy of the constructed model by showing the different variations of the curves.
After the sentiment analysis experiment, the obtained sentiment index is combined with google historical stock prices as the input to the overall prediction model, and the stock price prediction experiment is started. To verify whether changes in investors' psychological mood really affect the trend of stock price market, a special comparison experiment was set up. In the first experiment, the possible effects of mood changes were not considered, so there was only the basic LSTM model in this experiment. The google historical stock price data is used as the input data, while it is set as the training dataset, and the results of the experiment will be visualised after the predictive analysis. As shown in Fig. 2, the experimental results are reflected in the form of data visualisation, and the two curves in the figure represent the real data situation and the change of stock price after the prediction of the LSTM model respectively. On the whole, although most of the curves generated by the LSTM model predictions are in line with the trend of the real data, there are still some differences in some time intervals, and the prices of the stocks are over-predicted in some time intervals, while the predicted values are lower than the real data values in some time intervals. As a comparison experiment of the first experiment, in the second experiment, the sentiment index obtained after sentiment analysis is added, combined with the historical data of google stock price as the input of the prediction model. In order to better compare the prediction results between the models with and without sentiment analysis, the basic LSTM model will still be included in the experiment to facilitate the observation of the experimental results. The results obtained after prediction by the sentiment analysis LSTM model are compared with the prediction results obtained by the basic LSTM model and the real data situation, and the three performances are shown through data visualisation. It can be concluded from the analysis that the LSTM prediction model after sentiment analysis is obviously closer to the real data changes, which also shows that in the stock trading market, the impact of investors' psychological and emotional changes on stock prices cannot be ignored.
However, it seems insufficient to show that the addition of a sentiment index can better improve the accuracy of the model in predicting stock prices through a comparative experiment alone, and for this reason evaluation metrics are computed for continuous values such as stock price data. In this paper, three evaluation metrics including Mean Absolute Error (MAE), Mean Square Error (MSE) and R2 score metrics are used to further determine whether the LSTM model with the addition of the sentiment analysis index possesses a higher level of accuracy in its prediction values.
Calculating the MAE involves subtracting each of the predicted data values obtained from the analysis from the corresponding true observed values in the training dataset to obtain the difference value, turning the resulting difference value into its absolute value, and summing all the absolute values to obtain the average value. The better the fit of a model, the smaller its MAE value will be. Calculating the MSE involves subtracting each of the predicted data values obtained from the analysis from the corresponding real observations in the training dataset to obtain the difference value, squaring the resulting difference value, and dividing it by the total number of real observations in the training dataset after summing up all the changed difference values. The better the fit of a model, the smaller its MSE value will be. To calculate R2, also known as the Coefficient of Determination, R2 uses the variables TSS, RSS, and ESS, and its value is the ratio of RSS to TSS. R2 can be used as an assessment of how well the predicted data of a regression model fits the real data, and its value usually ranges from 0 to 1. The closer the value of R2 to 1, the better the model fits the data. The closer the value of R is to 1, the better the fit of the model is. Next, the MAE, MSE and R2 of the basic LSTM prediction model and the MAE, MSE and R2 of the LSTM prediction model with the sentiment index added are calculated separately to verify if the addition of the sentiment index after sentiment analysis improves the prediction accuracy of the LSTM model. As shown in Table 1, the difference between the MAE, MSE and R2 of the two models. After comparison, it is found that the fit between the predicted values and the real data of the LSTM prediction model with the addition of sentiment analysis is better, indicating that the predicted data obtained from the LSTM prediction model with the addition of the sentiment index is more accurate, and indicating that the change of the investors' psychological sentiment in the stock trading market does influence the change of the stock price.
Table 1. The Differences between MAE, MSE and R2.
MAE | MSE | R2 | |
LSTM | 7.496 | 16.146 | 0.910 |
LSTM for sentiment analysis | 3.185 | 13.498 | 0.943 |
4. Limitations and prospects
Although the LSTM prediction model after considering the changes in investor's sentiment achieves more accurate results, the improved LSTM prediction model still has a considerable discrepancy with the real stock price data. The overall prediction of stock price trends is more accurate, but the prediction of stock prices in certain time periods is not very satisfactory, and these limitations, usually, are caused by external uncertainties, i.e., not purely by changes in investor sentiment. Compared to data that can be collected and analysed like changes in investor sentiment, for example, things like changes in national policies, global economic fluctuations and changes in demand markets are difficult to collect usable data and information. This highly confidential information has an immediate impact on this area of the stock market when it is released, at which point predictive analyses can be conducted without reliable and accurate results. These constraints cannot be overcome for the time being, so only the effects that changes in investor sentiment can have on the stock price market are considered in the stock price prediction experiments in this paper.
5. Conclusion
To sum up, the LSTM prediction model is used to predict the change of Google stock price, and the sentiment index obtained from sentiment analysis is added in the process of constructing the experimental model, thus improving the original LSTM prediction model. In the first stage of the experiment, the basic LSTM prediction model is used to predict the stock price changes, and then the visualised output results are obtained. In the second phase the original LSTM prediction model is improved and a sentiment index obtained by sentiment analysis of the information on investors' psychological sentiment changes is added to predict the stock price changes again and the visualised output is obtained. A visual comparison of the two is made and the results are displayed on the same output image, which shows that the LSTM prediction model after adding the sentiment analysis model and using the sentiment index obtained from the sentiment analysis is more accurate in predicting the change in the stock price of google. Then by calculating the MSE, MAE, R2 which are the three evaluation indexes to assess the accuracy of the prediction, it is again confirmed that the change in investor's sentiment will have a non-negligible impact on the stock price change. However, when analysing the experimental results, it is found that the predictions obtained from the improved LSTM prediction model still have intuitive differences from the original stock price data. These are limited by policy changes between countries, fluctuations in the global economic market, and the impact of certain unexpected events, and the impact of these factors will be minimised in subsequent research. The experimental conclusions obtained in this paper can remind investors as well as relevant researchers to consider information other than the basic stock data information when predicting stock price changes, especially the psychological changes of investors, which will directly affect the stock price changes. In addition, the prediction experimental scheme in this paper will also help investors to predict stock price changes more accurately, reduce risky losses, and obtain higher returns.
References
[1]. Fama E F 1998 Long-term returns, and Behavioral finance. J Financ Econ vol 49(3) pp 283-306
[2]. De Gooijer J G, Hyndman R J 2005 Selective Scrutiny. Soc Sci Electron Publ vol 22(3) pp 443-473.
[3]. Neild S 2003 Methods of time-frequency for structural quiver analysis. Eng Struct vol 25(6) pp 713-728.
[4]. Krunz M M and Makowski A M 2002 A compromise between Markovian and LRD models in modeling video traffic. IEEE J Sel Areas Commun vol 16(5) pp 733-748.
[5]. Farina L and Rinaldi S 2000 Theory and application of positive linear systems. J Vet Med Sci vol 63(9) pp 945-948 .
[6]. Contreras J, Espinola R, Nogales F J, et al. 2002 Predict electricity prices in the following day with ARIMA model. IEEE Power Eng Rev vol 22(9) pp 57-57.
[7]. Smola A J and SchÖlkopf B 2004 A supporting properties tutorial on vector regression. Stat Comput vol 14(3)pp 199-222.
[8]. Judith E and Deleo J M 2001 Artificial neural networks. Cancer vol 91(S8) pp 1615-1635.
[9]. Prasaddas S and Padhy S 2012 Future prices trends of Indian stock market based on support vector machine. Int J Comput Appl vol 41(3) pp 22-26.
[10]. Cavalcante R C, Brasileiro R C, Souza V L F, Nobrega J P and Oliveira A L I 2016 Future directions in the fields of computational intelligence and financial markets. Expert Syst Appl vol 55 pp 194-211.
[11]. Antweiler W and Frank M Z 2004 Is the information on the internet stock information review board just noise? J Finance vol 59(3) p 1259.
[12]. Baker M and Wurgler J 2006 The connection between investors sentiment towards investing in stocks and the returns they generate from investing in stocks. J Finance vol 61 pp 1645-1680.
[13]. Hochreiter S and Schmidhuber J 1997 Long short-term memory. Neural Comput vol 9(8) pp 1735-1780.
[14]. Xing S H, Chen Z, Wang H, Yeung D Y, Wong W K and Woo W C 2015 Machine learning method for predicting precipitation based on LSTM model. Advances in neural information processing systems pp 802-810.
[15]. Fischer T and Krauss C 2017 Predicting the trend of financial markets using deep learning method with LSTM model. Eur J Oper Res. vol S037 p 7221717310652.
[16]. Mao Y, Wang B, Wei W and Liu B 2012 The interaction between twitter data and S&P 500 stocks. Proceedings of the first ACM international workshop on hot topics on interdisciplinary social networks research vol 12(16) pp 69-72.
[17]. Zhou Z, Zhao J and Xu K 2016 Can the Chinese stock trading market be influenced by the investment sentiment of online investors? WISE lecture notes in computer Science vol 10041.
[18]. Antweiler W and Frank M Z 2004 Is the information on the internet stock information review board just noise? J Finance vol 59 pp 1259-1294.
Cite this article
Liu,Y. (2024). Stock price prediction for Google based on LSTM model with sentiment analysis. Applied and Computational Engineering,54,90-97.
Data availability
The datasets used and/or analyzed during the current study will be available from the authors upon reasonable request.
Disclaimer/Publisher's Note
The statements, opinions and data contained in all publications are solely those of the individual author(s) and contributor(s) and not of EWA Publishing and/or the editor(s). EWA Publishing and/or the editor(s) disclaim responsibility for any injury to people or property resulting from any ideas, methods, instructions or products referred to in the content.
About volume
Volume title: Proceedings of the 4th International Conference on Signal Processing and Machine Learning
© 2024 by the author(s). Licensee EWA Publishing, Oxford, UK. This article is an open access article distributed under the terms and
conditions of the Creative Commons Attribution (CC BY) license. Authors who
publish this series agree to the following terms:
1. Authors retain copyright and grant the series right of first publication with the work simultaneously licensed under a Creative Commons
Attribution License that allows others to share the work with an acknowledgment of the work's authorship and initial publication in this
series.
2. Authors are able to enter into separate, additional contractual arrangements for the non-exclusive distribution of the series's published
version of the work (e.g., post it to an institutional repository or publish it in a book), with an acknowledgment of its initial
publication in this series.
3. Authors are permitted and encouraged to post their work online (e.g., in institutional repositories or on their website) prior to and
during the submission process, as it can lead to productive exchanges, as well as earlier and greater citation of published work (See
Open access policy for details).
References
[1]. Fama E F 1998 Long-term returns, and Behavioral finance. J Financ Econ vol 49(3) pp 283-306
[2]. De Gooijer J G, Hyndman R J 2005 Selective Scrutiny. Soc Sci Electron Publ vol 22(3) pp 443-473.
[3]. Neild S 2003 Methods of time-frequency for structural quiver analysis. Eng Struct vol 25(6) pp 713-728.
[4]. Krunz M M and Makowski A M 2002 A compromise between Markovian and LRD models in modeling video traffic. IEEE J Sel Areas Commun vol 16(5) pp 733-748.
[5]. Farina L and Rinaldi S 2000 Theory and application of positive linear systems. J Vet Med Sci vol 63(9) pp 945-948 .
[6]. Contreras J, Espinola R, Nogales F J, et al. 2002 Predict electricity prices in the following day with ARIMA model. IEEE Power Eng Rev vol 22(9) pp 57-57.
[7]. Smola A J and SchÖlkopf B 2004 A supporting properties tutorial on vector regression. Stat Comput vol 14(3)pp 199-222.
[8]. Judith E and Deleo J M 2001 Artificial neural networks. Cancer vol 91(S8) pp 1615-1635.
[9]. Prasaddas S and Padhy S 2012 Future prices trends of Indian stock market based on support vector machine. Int J Comput Appl vol 41(3) pp 22-26.
[10]. Cavalcante R C, Brasileiro R C, Souza V L F, Nobrega J P and Oliveira A L I 2016 Future directions in the fields of computational intelligence and financial markets. Expert Syst Appl vol 55 pp 194-211.
[11]. Antweiler W and Frank M Z 2004 Is the information on the internet stock information review board just noise? J Finance vol 59(3) p 1259.
[12]. Baker M and Wurgler J 2006 The connection between investors sentiment towards investing in stocks and the returns they generate from investing in stocks. J Finance vol 61 pp 1645-1680.
[13]. Hochreiter S and Schmidhuber J 1997 Long short-term memory. Neural Comput vol 9(8) pp 1735-1780.
[14]. Xing S H, Chen Z, Wang H, Yeung D Y, Wong W K and Woo W C 2015 Machine learning method for predicting precipitation based on LSTM model. Advances in neural information processing systems pp 802-810.
[15]. Fischer T and Krauss C 2017 Predicting the trend of financial markets using deep learning method with LSTM model. Eur J Oper Res. vol S037 p 7221717310652.
[16]. Mao Y, Wang B, Wei W and Liu B 2012 The interaction between twitter data and S&P 500 stocks. Proceedings of the first ACM international workshop on hot topics on interdisciplinary social networks research vol 12(16) pp 69-72.
[17]. Zhou Z, Zhao J and Xu K 2016 Can the Chinese stock trading market be influenced by the investment sentiment of online investors? WISE lecture notes in computer Science vol 10041.
[18]. Antweiler W and Frank M Z 2004 Is the information on the internet stock information review board just noise? J Finance vol 59 pp 1259-1294.