


1. Introduction
Over the years, more and more financial traders have started to focus their investments on stock trading due to the increase in market capitalization, stock prices predictions are carried out using fundamental and technical assessments to help investors with decision-making. However, there are limitations to them, and they do not always return desired correctness. Machine learning algorithms have been explored in academia to help with estimating changes in stock prices with the increase in usage of advanced tools and technologies [1].
This paper compares the accuracy of three time-series models when forecasting stock prices of Apple. These models are Long Short-Term Memory (LSTM), Linear regression and Fully connected Neural Networks (FNN). The dataset used contains 504 rows and 8 columns, including information of stock prices of Apple (from 15/09/2021 to 15/09/2023). Time series analysis models trained by supervised learning are applied to predict future stock close price of Apple based on collected dataset. Comparing the three models, FNN was found to give the best prediction.
2. Literature Review
Stock market can be influence by numerous factors, making the stock prices unstable and hard to predict. Although it is hard to make accurate predictions, it is an important process as investors need instant and effective information to make decisions and strategies. As a result, in academic and financial fields, analysing the trends of financial activities and predicting their changes are now considered one of the research hotspots [2].
A DNN (deep neural network)-based model developed on the phase-space reconstruction (PSR) method and LSTMs for deep learning is designed by Yu and Yan, which is then used for forecasting stock prices. Several stock indices for various time periods are predicted using the designed prediction model as well as a few alternative models. Comparing the outcomes shows that the DNN-based model predicts the most accurately [2].
Adebiyi and Adediran showed that autoregressive integrated moving average (ARIMA) models are able to perform reasonably well with newly developed short-term forecasting techniques based on past daily stock prices acquired from exchanging two countries’ stock [3].
By using different methods to forecast the stock prices by their time series characteristics, the method CNN-BiLSTM-AM, comprising convolutional neural networks (CNN), bi-directional long short-term memory (BiLSTM), and attention mechanism (AM) was found to perform the best among other seven models including CNN, RNN, LSTM etc [4].
The study of evaluating the close price for five companies in different sectors of operation by Vijh, Chandola, Tikkiwal and Kumar found artificial neural networks (ANN) to be more efficient in stock closing price prediction compared to random forest (RF) as it obtains the lowest values of the two indicators RMSE and MAPE [5].
Furthermore, LSTM model has been shown to be effective in long term share price prediction by experiment based on four different sectors in Indian share market [6].
A study of predicting the next closing stock price by echo state network (ESN) was presented by Lin, Yang and Song. To flexibly identify initial transient and pick subseries with biggest predictability when training, the Hurst exponent is introduced into the model. Experimenting on almost all S&P 500 stocks demonstrates that most of the times, ESN shows leading performance [7].
Nevertheless, studies have not found a method performs the best in all scenarios due to complexity of the stock market and other reasons.
3. Methodology
3.1. Linear regression
Regression analyzes are frequently used in area of forecasting and prediction, where their use significantly overlaps with the field of machine learning [8]. Although linear regression was developed a long time ago, comparing to modern learning method, it is still widely used and can often be a good starting point. It is a linear approach describes the relationship between an independent variable and dependent variable(s). By fitting a linear regression model, the training data is used to estimate the model coefficients, which will be used to predict the future price on a particular day afterwards.
Simple linear regression is a linear regression model which contains only one explanatory variable. It uses two-dimensional sample points with the independent and dependent variables, to identify a linear function that as closely as possible predicts the values of the response variable by using the corresponding values of the explanatory variable.
3.2. LSTM
The objective of a Recurrent Neural Network (RNN) is to predict the future steps by using previously observed steps. Where LSTM, as a special type of RNNs, can additionally memorize the data sequentially. An LSTM is a collection of cells, capturing and storing the data streams. They act like a path connecting one module to another, transferring data from the past and to the current one [9]. Within each cell, there are three kinds of gates, namely forget, memory and output gate, enabling the cells to determine whether to pass through data or dispose of it. During this process, old data can be deleted, and new data can be added, and at the end is the output gate deciding the output from each cell.
3.3. FNN
Neural networks are machine learning methods for training algorithms based on inspiration of the human brain.
For neural networks, a learning process can be seen as the issue of optimising network architecture and connection weights to maximise the efficiency of a network on performing a specific task. In most cases, the network has to recognise the connection weights from given training patterns. And to improve its performance, the weights in the network are updated iteratively. ANN seem to learn underlying rules (like relationships between inputs and outputs) from the provided collection of representative cases rather than adhering to a set of rules established by human experts, which is a big part of the reason for its superiority to conventional expert systems [9].
As one of the neural networks, in the Fully connected Neural Networks (FNN), every neuron gets linked to every other neuron in the previous and follow-up layers, enabling it to learn complicated characteristics of the inputs, which all result in powerful nonlinear fitting capabilities and the fact that it can run tasks like classification or regression and fit most patterns [10].
4. Results
The process was split into several steps, including data collection, data processing, model training and model testing. At first, historical stock price data of Apple from 15/09/2021 to 15/09/2023 was got from Yahoo Finance. After cleaning the data set and converting into a suitable time-series structure for prediction, the whole dataset was then divided into two subsets, an 80% train set, and a 20% test set, which means, data of the last 100 days were used for testing. The models were trained based on the 7-day closing price of Apple in the past to predict the closing price in the future. In this study, date and stock closing price is the independent and dependent variable respectively. These settings were then fed into the algorithms.
4.1. Results for linear regression model
The linear regression model applied in this paper is a simple linear regression, with the only explanatory variable being dates and the response variable being the stock price. Fig. 1 shows the price predicted using linear regression model and the real price of the day. The general shape of the prediction line is close to the line of the actual price, but it tends to underestimate when the price is rising and overestimate in the other cases. Also, some inconsistency appeared during the first half of the period.
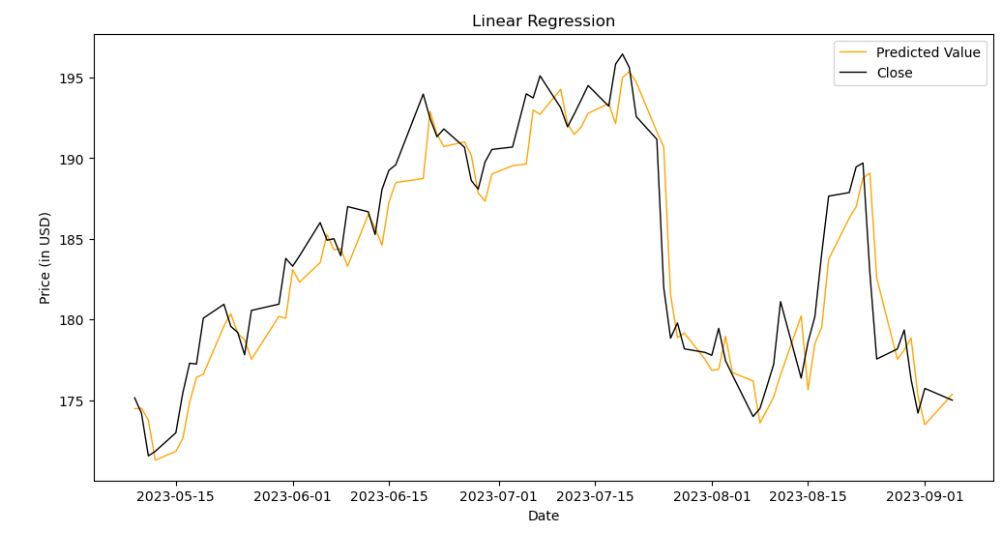
Figure 1. Results for Linear Regression
4.2. Results for LSTM models
The actual and predicted values from the LSTM model trained using data from the previous 7 days (N=7) is compared in Fig. 2. The graphic shows that there is significant variation in the projected values. The prediction is also contradictory at the beginning and at the end.
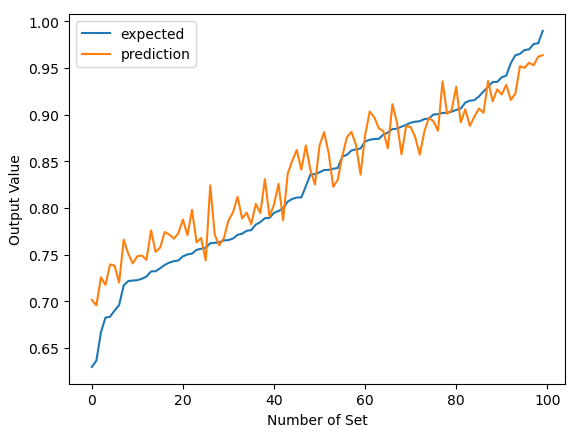
Figure 2. Results for LSTM (N=7)
The algorithm was retrained using data from the previous 5 days (N=5) and 10 days (N=10) to determine the ideal number of days to use for training. The outcomes are displayed in Figs. 3 and Fig.4 correspondingly. In Fig. 3, overestimation occurred initially, but over time, the predictions began to come closer to the actual values. It is apparent that accuracy decreases as iterations increase further. In contrast, the model provides an overall approximation that is significantly closer when data from the recent 10 days are applied.
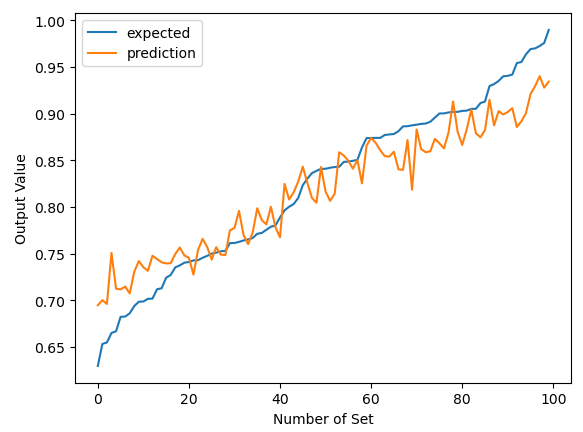
Figure 3. Results for LSTM (N=5)
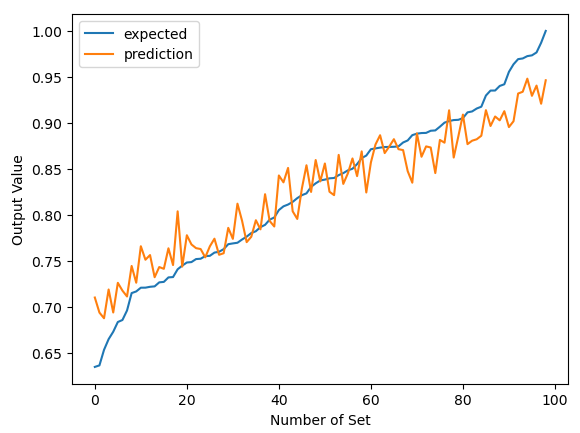
Figure 4. Results for LSTM (N=10)
4.3. Results for FNN model
The last model involved was the Fully connected Neural Networks (FNN) model, its testing output is presented by Fig. 5. It is observed that FNN returns the most robust forecasting at the start of the iterations and towards the end, where the curve is comparably smoother than the other models in the same area. It is comparable to LSTM (N=7) elsewhere.
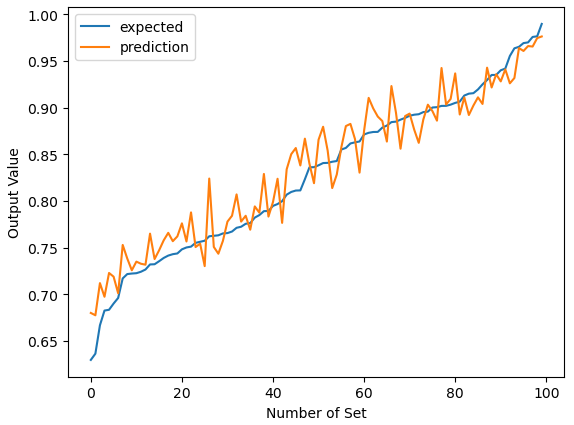
Figure 5. Results for FNN
4.4. Indicators of comparison
In this paper, R-squared was used to indicate the effectiveness of each model. Furthermore, the dataset was normalized when training LSTM and FNN models. As a result, mean square error (MSE) was introduced as an extra judgement among these models.
R-squared represents the quantity that estimates the percentage of variation of the response variable explained relating to the explanatory variables. It is calculated using the explained (ESS), total (TSS) and residual sum of squares (RSS) [11]. R-squared indicates the fitness of the regression line to the data. It lies in the closed interval 0 to 1, and larger R-squared corresponds to better fitness.
MSE is frequently used in stock prices forecasting to show the accuracy of the models. It quantifies the average squares of the errors, which is the mean square differences between the calculated and real values. As indicated by its name, MSE is never negative and non-zero most of the cases. Lower MSE means better fitness of the model and when it’s zero, the model is fitted perfectly.
4.5. Results for comparison
Calculated R-squared and MSE for each model are shown in Table 1. Observing that FNN returns the highest R-squared value (0.9295) among all models and the lowest MSE (0.00052) in comparison with the LSTM models. A conclusion that the FNN model performed the best, with the LSTM model trained using data from the last 7 days with R-squared value 0.8985 and MSE 0.00075 being the second can then be drawn. This benefits from the ability of FNN methods on learning non-linear input-output, and on generalizing from the examples they are being trained on and applying to new data afterwards. Which all make it possible for them to predict more accurately.
Table 1. Comparison
Linear regression | LSTM (N=5) (Data normalized) | LSTM (N=7) (Data normalized) | LSTM (N=10) (Data normalized) | FNN (Data normalized) | |
R-squared | 0.876975 | 0.882891 | 0.898471 | 0.892251 | 0.929504 |
MSE | 5.7786893 | 0.0009585 | 0.0007542 | 0.0008450 | 0.0005237 |
5. Conclusion
Throughout time, machine learning algorithms have been explored and developed, resulting in their use in predicting changes in stock value growing steadily. The objective of this paper is to forecast future stock prices by using historical return. In three stages: model construction, time series data processing, and outcome assessment and analysis, three distinct supervised learning techniques—linear regression, LSTM, and FNN—are applied. In the end, FNN performed the best among all the models in terms of R-squared and MSE, producing the lowest MSE and the largest R-squared value. Therefore, in future forecasts, FNN might be given primacy over the other methods.
The modern stock market nowadays, however, is getting more and more complicated, and a lot of other elements can influence the trend of the stock price, all of these indicate that entirely replying on time-series analysis no longer gives the best knowledge of the stock markets. Indeed, a direction for further researching from this paper is to combine other features such as company investments, investor sentiments and so on during the process.
References
[1]. Chaudhary, A., Gupta, A., Pahariya, D., & Singh, S. K. (2023). Stock Price Prediction of Tesla & Apple using LSTM. In ITM Web of Conferences (Vol. 56, p. 02006). EDP Sciences.
[2]. Yu, P., & Yan, X. (2019). Stock price prediction based on deep neural networks. Neural Computing and Applications, 32(6), 1609–1628.
[3]. Ariyo, A. A., Adewumi, A. O., & Ayo, C. K. (2014, March). Stock price prediction using the ARIMA model. In 2014 UKSim-AMSS 16th international conference on computer modelling and simulation (pp. 106-112). IEEE.
[4]. Lu, W., Li, J., Wang, J., & Qin, L. (2020). A CNN-BiLSTM-AM method for stock price prediction. Neural Computing and Applications, 33(10), 4741–4753.
[5]. Vijh, M., Chandola, D., Tikkiwal, V. A., & Kumar, A. (2020). Stock Closing Price Prediction using Machine Learning Techniques. Procedia Computer Science, 167, 599–606.
[6]. Ghosh, A., Bose, S., Maji, G., Debnath, N. C., & Sen, S. (2019). Stock price prediction using LSTM on Indian share market. EPiC Series in Computing.
[7]. Lin, X., Yang, Z., & Song, Y. (2009). Short-term stock price prediction based on echo state networks. Expert Systems With Applications, 36(3), 7313–7317.
[8]. Maulud, D., & Abdulazeez, A. M. (2020). A Review on Linear Regression Comprehensive in Machine Learning. Journal of Applied Science and Technology Trends, 1(4), 140–147.
[9]. Jain, A., Mao, J., & Mohiuddin, K. (1996b). Artificial neural networks: a tutorial. IEEE Computer, 29(3), 31–44.
[10]. Li, Q., Zhai, Z., Li, Q., Wu, L., Bao, L., & Sun, H. (2023b). Improved Bathymetry in the South China Sea from Multisource Gravity Field Elements Using Fully Connected Neural Network. Journal of Marine Science and Engineering, 11(7), 1345.
[11]. Renaud, O., & Victoria-Feser, M.-P. (2010, October 29). A Robust Coefficient of Determination for Regression. Social Science Research Network.
Cite this article
Lu,J. (2024). Stock price forecasting by supervised learning methods. Applied and Computational Engineering,50,206-212.
Data availability
The datasets used and/or analyzed during the current study will be available from the authors upon reasonable request.
Disclaimer/Publisher's Note
The statements, opinions and data contained in all publications are solely those of the individual author(s) and contributor(s) and not of EWA Publishing and/or the editor(s). EWA Publishing and/or the editor(s) disclaim responsibility for any injury to people or property resulting from any ideas, methods, instructions or products referred to in the content.
About volume
Volume title: Proceedings of the 4th International Conference on Signal Processing and Machine Learning
© 2024 by the author(s). Licensee EWA Publishing, Oxford, UK. This article is an open access article distributed under the terms and
conditions of the Creative Commons Attribution (CC BY) license. Authors who
publish this series agree to the following terms:
1. Authors retain copyright and grant the series right of first publication with the work simultaneously licensed under a Creative Commons
Attribution License that allows others to share the work with an acknowledgment of the work's authorship and initial publication in this
series.
2. Authors are able to enter into separate, additional contractual arrangements for the non-exclusive distribution of the series's published
version of the work (e.g., post it to an institutional repository or publish it in a book), with an acknowledgment of its initial
publication in this series.
3. Authors are permitted and encouraged to post their work online (e.g., in institutional repositories or on their website) prior to and
during the submission process, as it can lead to productive exchanges, as well as earlier and greater citation of published work (See
Open access policy for details).
References
[1]. Chaudhary, A., Gupta, A., Pahariya, D., & Singh, S. K. (2023). Stock Price Prediction of Tesla & Apple using LSTM. In ITM Web of Conferences (Vol. 56, p. 02006). EDP Sciences.
[2]. Yu, P., & Yan, X. (2019). Stock price prediction based on deep neural networks. Neural Computing and Applications, 32(6), 1609–1628.
[3]. Ariyo, A. A., Adewumi, A. O., & Ayo, C. K. (2014, March). Stock price prediction using the ARIMA model. In 2014 UKSim-AMSS 16th international conference on computer modelling and simulation (pp. 106-112). IEEE.
[4]. Lu, W., Li, J., Wang, J., & Qin, L. (2020). A CNN-BiLSTM-AM method for stock price prediction. Neural Computing and Applications, 33(10), 4741–4753.
[5]. Vijh, M., Chandola, D., Tikkiwal, V. A., & Kumar, A. (2020). Stock Closing Price Prediction using Machine Learning Techniques. Procedia Computer Science, 167, 599–606.
[6]. Ghosh, A., Bose, S., Maji, G., Debnath, N. C., & Sen, S. (2019). Stock price prediction using LSTM on Indian share market. EPiC Series in Computing.
[7]. Lin, X., Yang, Z., & Song, Y. (2009). Short-term stock price prediction based on echo state networks. Expert Systems With Applications, 36(3), 7313–7317.
[8]. Maulud, D., & Abdulazeez, A. M. (2020). A Review on Linear Regression Comprehensive in Machine Learning. Journal of Applied Science and Technology Trends, 1(4), 140–147.
[9]. Jain, A., Mao, J., & Mohiuddin, K. (1996b). Artificial neural networks: a tutorial. IEEE Computer, 29(3), 31–44.
[10]. Li, Q., Zhai, Z., Li, Q., Wu, L., Bao, L., & Sun, H. (2023b). Improved Bathymetry in the South China Sea from Multisource Gravity Field Elements Using Fully Connected Neural Network. Journal of Marine Science and Engineering, 11(7), 1345.
[11]. Renaud, O., & Victoria-Feser, M.-P. (2010, October 29). A Robust Coefficient of Determination for Regression. Social Science Research Network.