


1. Introduction
Being one of the fruits that is farmed worldwide, apples contain great nutritional and are among the most productive fruits [1]. However, the apple leaf diseases have always plagued apple growers and related practitioners, resulting in a serious impact on apple production and quality. Apple leaf disease detection and identification in a timely manner will assist minimize losses in quality and productivity. Recent years have seen a significant increase in research interest in this. Previous plant disease diagnosis was accomplished by specialists in the field through visual inspection of the leaves, which needs not only requires training of professionals, but is also clearly subjective [1]. In addition, periodic testing and monitoring covering large areas of orchards is time- and labor-intensive, which inhibits its application in large-scale production. The deep learning technology, particularly the convolutional neural network, has demonstrated a strong ability to capture the features of different leaf diseases, due to artificial intelligence's quick progress [2]. It is demonstrated to be a good substitute for accurately and quickly identifying apple illnesses [2]. FN et al. suggested using orientation to improve the data and a Gaussian filter to eliminate noise. Next, CapsNet and the Bi-directional Long Short-Term Memory (BiLSTM) model are used to detect disease and extract features [3]. Zhu et al. enhanced the output of multi-scale information from the conventional YOLOv5 network by adding a feature enhancement module and coordinating attention to it [4]. Huang et al. combined high-resolution spatiotemporal meteorological data with data from a mobile Internet disease survey [5].
Previous studies have used a variety of algorithms and apple leaf disease classification using deep learning models. Nevertheless, these methods ignore complicated background disturbances and concentrate on disease recognition situations with a single background condition. Agricultural practitioners need an efficient tool that can help them monitor apple leaf diseases in real or near real time. Therefore, the problem of identification and detection under complex conditions must be addressed. This covers issues like fluctuations in light and background noise. In this paper, the Convolutional Block Attention Module is presented to enhance the accuracy and resilience of the model based on these difficulties, using ResNet-101 as the underlying network structure. With this improvement, the model is able to better understand and focus on disease-related features in the image. It attempts to solve the issue of detecting apple leaf disease in intricate field settings. Giving the agricultural industry a trustworthy instrument to tackle the difficulties of monitoring apple leaf disease is the aim of this research.
2. Method
2.1. Overview
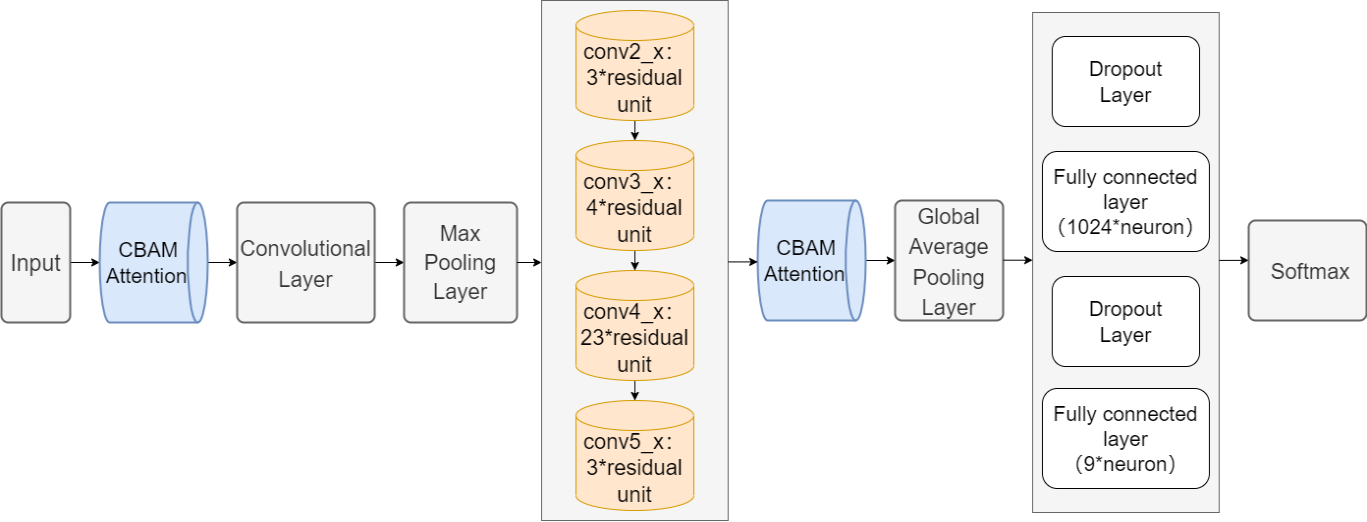
Figure 1 depicts the suggested method's entire framework. Firstly, this model accepts an RGB color image with a height and width of 224 pixels and a channel number of 3 as input. Subsequently, the image input is handled by a Convolutional Block Attention Module that includes channel attention and spatial attention. A 7x7 Convolutional Layer and a Maximum Pooling Layer are added after this to shrink the image's size. Next are four main residual blocks, 'conv2_x' containing 3 residual units, 'conv3_x' containing 4 residual units, 'conv4 _x' and 'conv5_x' containing 3 residual cells. Each residual unit consists of a 1x1 convolutional layer for reducing the dimensionality, a 3x3 convolutional layer for the extraction of features, and a 1x1 convolutional layer for upscaling. The upscaled features are residually concatenated with the input features to get the output of the residual unit. To further improve the focus on significant features, the output from the multi-layer residual block structure is again run through the Convolutional Block Attention Module. Afterwards, the feature map is spatially downscaled through a Global Average Pooling layer to convert it into a global feature vector. Next, a Dropout layer is applied to reduce overfitting, followed by a fully connected layer containing 1024 neurons for integrating feature information. There are nine classification categories produced by applying a final fully connected layer after another Dropout layer. Finally, the classification probability distribution is obtained by using the SoftMax activation function.
|
Figure 1. The whole framework of proposed method. |
2.2. CBAM Attention
The Channel Attention Module (CAM) and the Spatial Attention Module (SAM) make up the two sub-modules that make up the Convolutional Block Attention Module (CBAM) internal structure. At the channel level and the spatial level, respectively, these two sub-modules control how attention is distributed. This improves the model's capacity to identify and isolate significant features.
2.2.1. CAM. The Channel Attention Module's (CAM) comprehensive workflow can be broken down to the subsequent steps: (1) Global Average Pooling: all of the input feature maps are subjected to a global average pooling operation, which entails averaging the values in each channel's feature map to determine the average response for that channel. (2) Dimensionality reduction of the channels: the average response of the channels is dimensionalised by a fully connected layer that includes a weight matrix multiplication and a ReLU activation function. This helps to reduce computational complexity and extract key channel features. (3) Channel Response Transformation: another fully connected layer is used which includes the weight matrix multiplication and Sigmoid activation function. The output of this layer will be used as the attentional weights of the channel dimensions. The Sigmoid function ensures that the output has a weight between 0 and 1, indicating the importance of the corresponding channel. (4) Channel Feature Reinforcement: lastly, the input features are multiplied by the obtained channel attentional weights. The outcome of this step is to suppress the feature response of unimportant channels by strengthening the feature response of important channels while suppressing the feature response of unimportant channels. This guarantees and improves the feature representation's quality that the model better focuses on task-relevant information [6].
2.2.2. SAM. The following procedures make up the majority of the Spatial Attention Module (SAM): (1) The channel attention output result is used as input, and a convolution operation with a 7×7 kernel size is applied to it in order to produce the appropriate attention weights for each spatial location. (2) The generated convolution results are then processed through the Sigmoid function. This function ensures that the output weights are in the range of 0 to 1, indicating the attentional weights for each spatial location. (3) Spatial Attentional Weights: the attentional weights for every spatial location are obtained after processing by Sigmoid function. These weights provide information about which areas of the image the model should concentrate on as well as the relative importance of various locations within the image. (4) Spatial feature enhancement: lastly, to highlight the crucial spatial location data, the input information is multiplied by the acquired spatial attention weights. This step results in the generation of feature responses enhanced with important spatial location information [6].
2.3. Residual block in ResNet
In the model architecture, the "Residual blocks" play a key role in feature extraction. These structures perform feature extraction on the input image layer by layer, gradually transforming the image into a high-level feature representation for subsequent classification tasks. Each residual block corresponds to a different layer of features in the captured image.
1. Conv2_x: The main goal of this step is to extract the image's fine features, like colors, textures, and edges. The model starts to comprehend some of the image's fundamental details in this step.
2. Conv3_x: Conv3_x enhances the image's abstract feature representation even more. This covers an object's textures, forms, and features found in various parts of the object. At this point, the model has a better understanding of the object's overall appearance and structure.
3. conv4_x: Conv4_x's job is to extract higher order abstract qualities from the object, like its general shape, its structure, and the combinatorial characteristics of its many pieces. For the purpose of classifying and recognizing objects, this feature level is crucial.
4. Conv5_x: Lastly, Conv5_x aims to extract higher-level semantic details about the object, such as its category, location, and relationships with other objects. This stage is crucial for advanced understanding of the image and can help the model to determine the identity and interactions of the objects [7].
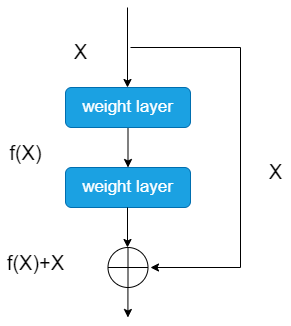
Each residual block contains a certain number of "Bottleneck" type residual units, which helps learn and represent different levels of features efficiently. As shown in Figure 2, the key here is the application of Skip Connection, which provides an effective way to solve the gradient problem in network training. With Skip Connection, information is passed more directly between layers. By adding the original inputs to the outputs of subsequent layers, this helps the information flow more smoothly through the deeper structure of the network. Gradients can also be backpropagated to earlier layers more easily. This leads to better weight updates and improves the overall performance and generalization of the network [8].
|
Figure 2. The structure of Residual Unit. |
3. Original Data
3.1. AppleLeaf9
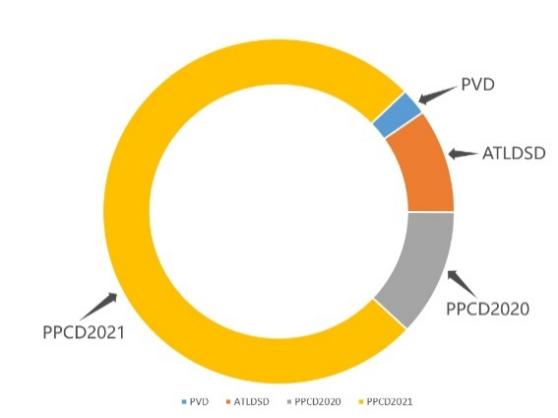
The AppleLeaf9 dataset [9] is used in this study, which is constructed by integrating the Plant Village dataset (PVD), the Apple Leaf Disease Segmentation dataset (ATLDSD) [10], the PPCD2020 dataset, and the PPCD2021 dataset [11]. There are 14,582 images of apple leaves in the dataset. About 94% of these images originated from different geographic areas in the field. This greatly enhances the model's ability to perform in real agricultural environments.
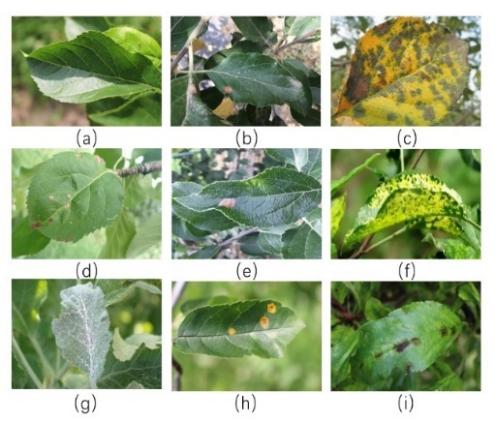
The distribution of image sources in AppleLeaf9 can be observed from Figure 3, and the nine apple leaf categories represent different apple leaf diseases or states. Each category shows distinct leaf disease characteristics. These features include color changes, spots, wilting, lesions, etc. They provide the model with specific image features for 9 diseases identification, as: (a) Health; (b) Alternaria leaf spot; (c) Brown spot; (d) Frogeye leaf spot; (e) Grey Spot; (f) Mosaic; (g) Powdery Mildew; (h) Rust; (i) Scab.
The AppleLeaf9 apple leaf disease dataset fuses four different ALD datasets together, with up to 94% of the images taken in a field environment. This feature makes the AppleLeaf9 dataset a highly representative dataset that effectively reflects the state of apple leaves in a realistic and complex field environment. This makes the dataset ideal for the study's use of the ResNet-101+CBAM model to address the issue of detecting apple leaf disease in challenging field settings. This dataset provides rich and realistic image data. It offers a strong basis on which this investigation can assess the model's performance [9].
|
|
Figure 3. Distribution of image sources and visualization of each category. | |
3.2. Data enhancement and partitioning
In order to cope with the problem of relatively little image data for certain disease categories in the AppleLeaf9 dataset. This study used a series of data enhancement methods. This is to guarantee that the deep learning model's training procedure is more reliable and has superior generalization capabilities [12]. The data enhancement methods include rotating the image by 180 degrees, flipping the image horizontally, adding Gaussian noise, and performing Gaussian blurring on the image.
As shown in Table 1, the data-enhanced AppleLeaf9 dataset is split into training, validation, and test sets in this study. This division process was randomized to avoid sampling bias. It ensures balanced and representative data. It makes the training and evaluation of the model on each data subset objective and fair, thus improving the reliability of this study.
Table 1. Number of images for training, validation, and testing.
Types | Total Images | Training Images | Validation Images | Testing Images |
Alternaria leaf spot | 2085 | 1251 | 417 | 417 |
Brown spot | 2055 | 1233 | 411 | 411 |
Frogeye leaf spot | 3181 | 1908 | 637 | 636 |
Grey spot | 1695 | 1017 | 339 | 339 |
Health | 2580 | 1548 | 516 | 516 |
Mosaic | 1855 | 1113 | 371 | 371 |
Powdery mildew | 1184 | 710 | 238 | 236 |
Rust | 2753 | 1651 | 552 | 550 |
Scab | 5410 | 3246 | 1082 | 1082 |
4. Experiment
4.1. Hardware and environment framework
The hardware setup that was employed in this research is CPU: Intel i5-10200H, GPU: NVIDIA GeForce GTX 1650. The experiment is conducted using Windows 10 as the operating system, Python 3.7 for the compilation environment, and TensorFlow 2.1.0 as the deep learning framework. CUDA10.1 and CUDANN7.6 that use GPU to accelerate the training efficiency.
4.2. Evaluation index
The study employed Accuracy, Precision, Recall, and F1 Score as evaluation metrics. In the corresponding dataset, the Accuracy metric quantifies the percentage of correctly classified samples that the model was able to classify. Precision measures how many cases where the model predicts a positive category are truly positive. The percentage of all real samples in the positive category that the model correctly detects is called Recall. Its concern is how well the model covers the positive categories. An extensive evaluation of the performance of classification models is done using the F1 Score metric. It combines Precision and Recall to get a more comprehensive picture of how well the model performs in the prediction of positive categories.
4.3. Training Accuracy and Loss
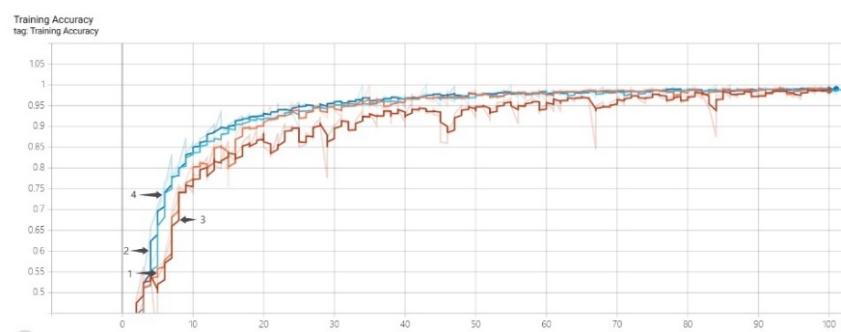
Figure 4 shows the variation in accuracy and loss of the four models ResNet-101 (data enhancement), ResNet-101+CBAN (data enhancement), ResNet-101 and ResNet-101+CBAN on the training dataset. In the initial stage of model training, the two models with the addition of Channel-wise Attention Module (CBAM) outperform the two models without the addition of the attention mechanism in terms of accuracy. Within the first 30 training cycles, the ResNet-101 model with the added Attention Module performs even better. As training continues, all three curves, except for the ResNet-101 counterpart, increase at a relatively fast rate, eventually reaching an accuracy level of over 95%. As approach 100 training cycles, all four accuracy curves stabilize and reach a high level.
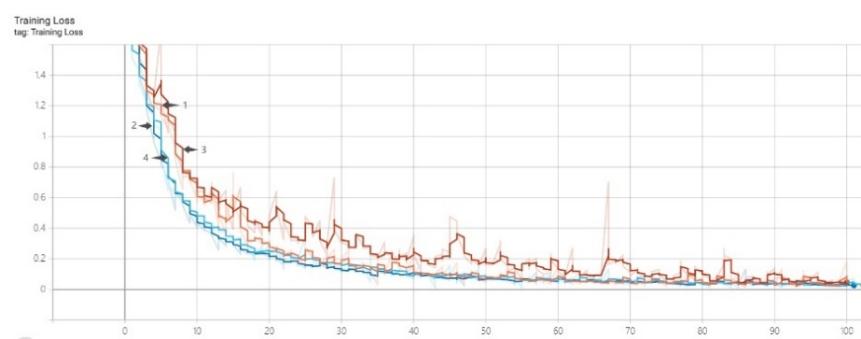
Every training model has comparatively high loss values in the beginning of training. Except for the ResNet-101 model, the other three models' loss values drop quickly and level out as the quantity of training cycles rises. As the ResNet-101 model gets closer to 100 training cycles, its loss value also stabilizes.
|
|
Figure 4. Training accuracy and loss of different methods. |

4.4. Performance on the test set
With the introduction of Convolutional Block Attention Module in the ResNet-101 model, the image feature learning capability of the model is enhanced. It is clearly observed from Table 2 that the ResNet-101+CBAM model shows excellent performance in recognizing and classifying apple leaf diseases. By looking at the first and second rows of Table 2. In comparison to the original ResNet-101 model, it can be seen that the ResNet-101 model with CBAM added without data improvement performs better in terms of accuracy, precision, recall, and F1 score. Nevertheless, concentrating on the third and fourth rows of Table 2. On the data-enhanced AppleLeaf9 dataset, it is found that the ResNet-101 model and the ResNet-101+CBAM model perform similarly in terms of Accuracy and Recall, with just slight differences in Precision and F1 Score. After data augmentation, it can be said that the ResNet-101 and ResNet-101+CBAM models perform essentially similarly on this test collection.
Table 2. Performance of different methods on test data set.
Model | Accuracy | Precision | Recall | F1 Score |
ResNet-101 | 93.65% | 93.67% | 93.65% | 93.64% |
ResNet-101+CBAM | 94.16% | 94.32% | 94.16% | 94.17% |
ResNet-101 (data enhancement) | 96.69% | 96.69% | 96.69% | 96.68% |
ResNet-101+CBAM (data enhancement) | 96.69% | 96.70% | 96.69% | 96.69% |
Table 3 presents the performance of the traditional ResNet-101 model and the ResNet-101+CBAM model on the data-enhanced dataset for each apple leaf disease category. By carefully comparing the tabular data, it can be observed that the ResNet-101+CBAM model performs well on the "Brown Spot", "Gray Spot", "Healthy" and "Rust" disease categories. This shows a certain performance improvement compared to the traditional ResNet-101 model, highlighting the positive role of the Convolutional Block Attention Module. However, on the remaining five disease categories, the difference in performance between the two models is relatively small. Notably, in the 'Powdery mildew' category, the model with the addition of CBAM did not perform as well as the traditional ResNet-101 model.
Table 3. Performance for each disease category.
Model | Classes | Accuracy | Precision | Recall | F1 Score |
ResNet-101 +CBAM+data enhancement | Alternaria leaf spot | 96.16% | 92.47% | 96.16% | 94.28% |
Brown spot | 100.00% | 100.00% | 100.00% | 100.00% | |
Frogeye leaf spot | 97.33% | 94.73% | 97.33% | 96.01% | |
Grey spot | 97.35% | 94.76% | 97.35% | 96.04% | |
Health | 98.26% | 96.54% | 98.26% | 97.39% | |
Mosaic | 98.92% | 97.86% | 98.92% | 98.39% | |
Powdery mildew | 87.71% | 76.93% | 87.71% | 81.97% | |
Rust | 96.36% | 92.86% | 96.36% | 94.58% | |
Scab | 95.66% | 91.50% | 95.66% | 93.53% |
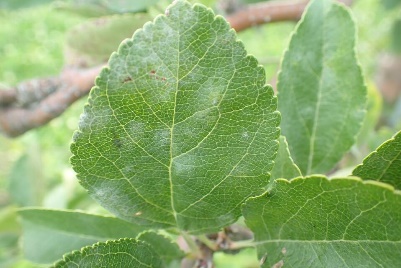
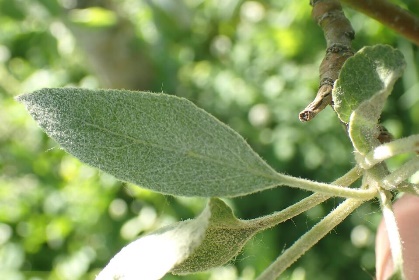
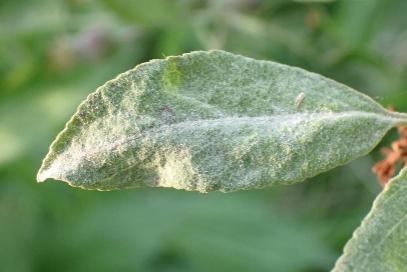
As shown in Figure 5, it was found that the ResNet-101+CBAM model was more inclined to incorrectly predict it as 'Scab' during the recognition and classification of the wrong category. By scrutinizing and comparing these images, a number of key features and similarities are apparent. Firstly, the leaf state and leaf shape in the misidentified images are very close to those of the 'Scab' category, which may have led to the misclassification. In addition, the 'Powdery mildew' disease feature in Figure 5 (a) is relatively not obvious enough. Although the disease feature is more obvious in Figure 5 (b), the information of the black twig elements in the image interferes with the recognition of the disease feature. Together, these factors interfere with the correct recognition and classification of 'Powdery mildew' leaf disease images by the ResNet-101+CBAM model.
|
|
|
(a) Powdery mildew | (b) Powdery mildew | (c) Scab |
Figure 5. Visualization of recognition error between Powdery mildew and Scab | ||
Combining the ResNet-101 model and the ResNet-101+CBAM model performance metrics comparisons in the third and fourth rows of Table 2 for accuracy, precision, recall, and F1 Score. The network complexity of the ResNet-101 model has achieved the upper limit of the recognition classification performance for the data-enhanced AppleLeaf9 dataset, it may be concluded. This means that with the current complexity of the task and data characteristics, introducing CBAM to improve the ResNet-101 model cannot bring further performance improvement for this application task.
4.5. Ablation study on CBAM and Data enhancement
Comparing Table 2's first and third rows as well as its second and fourth rows, respectively, It is evident that the performance of the ResNet-101 and ResNet-101+CBAM models is significantly improved by the data-enhanced AppleLeaf9 dataset. A discernible upward trend can be seen in the models' four performance metrics: F1 Score, Accuracy, Precision, and Recall.
Table 4. Performance comparison of methods with/without data enhancement and CBAM module.
Model | Classes | Accuracy | Precision | Recall | F1 Score |
ResNet-101 | Alternaria leaf spot | 79.52% | 63.23% | 79.52% | 70.45% |
Brown spot | 95.12% | 90.48% | 95.12% | 92.74% | |
Frogeye leaf spot | 97.01% | 94.11% | 97.01% | 95.54% | |
Grey spot | 74.63% | 55.69% | 74.63% | 63.78% | |
Health | 90.29% | 81.53% | 90.29% | 85.68% | |
Mosaic | 85.14% | 72.48% | 85.14% | 78.30% | |
Powdery mildew | 91.95% | 84.55% | 91.95% | 88.09% | |
Rust | 95.82% | 91.81% | 95.82% | 93.77% | |
Scab | 93.99% | 88.35% | 93.99% | 91.08% | |
ResNet-101 +data enhancement | Alternaria leaf spot | 96.88% | 93.86% | 96.88% | 95.35% |
Brown spot | 99.51% | 99.03% | 99.51% | 99.27% | |
Frogeye leaf spot | 97.33% | 94.73% | 97.33% | 96.01% | |
Grey spot | 94.69% | 89.66% | 94.69% | 92.11% | |
Health | 97.48% | 95.02% | 97.48% | 96.24% | |
Mosaic | 99.73% | 99.46% | 99.73% | 99.60% | |
Powdery mildew | 89.41% | 79.94% | 89.41% | 84.41% | |
Rust | 96.00% | 92.16% | 96.00% | 94.04% | |
Scab | 96.30% | 92.74% | 96.30% | 94.49% | |
ResNet-101 +CBAM | Alternaria leaf spot | 74.70% | 55.80% | 74.70% | 63.88% |
Brown spot | 92.68% | 85.90% | 92.68% | 89.16% | |
Frogeye leaf spot | 98.43% | 96.88% | 98.43% | 97.65% | |
Grey spot | 89.55% | 80.20% | 89.55% | 84.62% | |
Health | 85.44% | 72.99% | 85.44% | 78.73% | |
Mosaic | 83.78% | 70.20% | 83.78% | 76.39% | |
Powdery mildew | 91.10% | 83.00% | 91.10% | 86.86% | |
Rust | 93.82% | 88.02% | 93.82% | 90.83% | |
Scab | 95.93% | 92.03% | 95.93% | 93.94% |
Table 4 shows the results of the ResNet-101 and ResNet-101+CBAM models both before and after data augmentation, broken down to each subset of apple leaf disease categories. It is clearly visible that in the data-enhanced AppleLeaf9 dataset, on seven leaf disease categories except 'Frogeye leaf spot' and 'Powdery mildew'. The image recognition classification performance of the model shows very significant and superior improvement in all of them. Taking the ResNet-101+CBAM model as an example, for the 'Alternaria leaf spot' disease category, the improvement of F1 Score before and after data enhancement is about thirty per cent. For the 'Brown spot' disease category, the performance indexes even reach one hundred percent performance level.
When focusing on the leaf disease categories 'Frogeye leaf spot' and 'Powdery mildew' it can be noticed. There is a slight decrease in the performance of 'Frogeye leaf spot' before and after data enhancement. And the performance index of 'Powdery mildew' decreased especially significantly. Especially on the ResNet-101+CBAM model, the F1 Score performance index before and after decreased by about five percentage points.
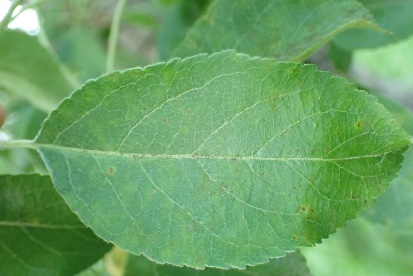
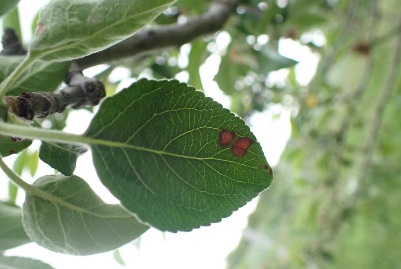
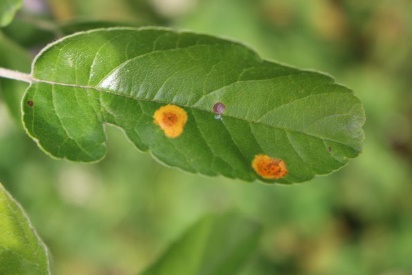
Further research was conducted when analyzing the recognition classification task for the 'Frogeye leaf spot' disease category. It was found that the model was misidentifying and classifying 'Frogeye leaf spot' images. The images that were incorrectly recognized as 'Rust' labelled had a higher percentage of incorrectly recognized images. The image illustrated in Figure 6 (a) is an image of the 'Frogeye leaf spot' disease incorrectly identified as 'Rust' by the model. The image illustrated in Figure 6 (b) is an image of an apple leaf disease actually labelled as 'Rust'. It can be noticed that the brightness of the area characterized by the disease in the image is lower as compared to the surrounding area, and the image appears to be overexposed. And there are normal leaf elements above and below the diseased leaves. These are the kinds of things that make it difficult for the model to accurately recognize categorized leaf diseases and learn disease image attributes. When the two photographs are compared once more, it becomes clear that the characteristics of "Frogeye leaf spot" and "Rust" for both varieties are extremely similar [13]. As a result, the model may become confused when acquiring the characteristics of the two categories of disease photos, which could hinder the model's ability to classify photographs. In the classification job of 'Frogeye leaf spot' disease category recognition, the model is susceptible to misidentify the 'Frogeye leaf spot' disease category as 'Rust' category due to the aforementioned confounding factors.
|
|
|
(a) Frogeye leaf spot | (b) Rust | (c) Powdery mildew |
Figure 6. Visualization of recognition error among Frogeye leaf spot, Rust and Powdery mildew. | ||
Overall, with the exception of the 'Frogeye leaf spot' and 'Powdery mildew' categories. The model on all apple leaf disease categories improved significantly both before and after data enhancement. This suggests that the operation of data enhancement expanded the diversity and complexity of the training data. It enabled the model to better learn features under different angles and mirror views, and improved the generalization ability of the model. It is evident from examining Table 4's results that these data augmentation procedures have a major impact. The rotate image and horizontal flip operations increase the multi-view information of the image. It enables the model to better adapt to object rotation and inversion, which improves the classification accuracy. The Add Gaussian Noise and Gaussian Blur operations introduce noise and blur in the image. Helps the model to better handle noisy environments and local detail changes, improving robustness and generalization performance. This explains the significant improvement in model performance before and after the operations.
5. Discussion
By means of a thorough examination of the experimental findings. The apple leaf disease classification task was shown to be exceptionally well-performed by the ResNet-101 model with Convolutional Block Attention Module. Nonetheless, the task of detecting plant leaf diseases in this study has numerous possible applications and directions. One of the potentially powerful tools is the use of a "multimodal data fusion" approach. Multimodal data fusion techniques aim to enhance disease performance features and develop prediction model accuracy by combining data from many technology platform levels [14].
A combination of infrared data and plant reflectance spectral image data in different wavelength bands can be considered for solving the task of apple leaf disease detection. Infrared images are obtained by recording the reflection or radiation of infrared light from an object and can be used to capture the temperature distribution and thermal characteristics of an object. Since diseases or transpiration can cause temperature variations in leaves, infrared data can be utilized to identify physiological changes in plants. On the other hand, multispectral data can be utilized to identify other important plant indicators, such as water level and chlorophyll content. This is crucial for determining the state of the plants' health. Infrared and multispectral data combined can yield more detailed information on the physiological condition of apple leaves. It significantly improves the model's performance by allowing it to learn and interpret illness characteristics in a more thorough manner. This kind of research integrating modern agricultural technology and ecology is expected to be widely used in actual agricultural production in the future. The automated apple orchard monitoring system based on multiple types of sensors is expected to be an excellent solution for monitoring large-scale apple cultivation in a wide range of applications. It provides excellent tools for practitioners in the field of apple cultivation to improve production efficiency and agricultural management. The information fusion approach of multiple data types to improve the detection and monitoring capabilities of plant diseases is important for agricultural production management and decision support systems.
6. Conclusion
This study's objective is to look at how deep learning models are applied to the problem. By adding the Convolutional Block Attention Module, the ResNet-101 model is enhanced, and its performance in the leaf disease identification task is investigated. Through in-depth experiments and analysis, conclusions can be clearly drawn.
On the data-enhanced AppleLeaf9 dataset, the ResNet-101 model with the introduction of CBAM shows excellent performance. The inclusion of the CBAM module greatly enhances the model's F1 Score, Accuracy, Precision, and Recall performance measures when compared to the original ResNet-101 model. Significant performance enhancements were attained for the model's performance on the "Brown spot," "Grey spot," "Health," and "Rust" illness categories.
Secondly, this study conducted experiments on data enhancement by comparing the performance metrics before and after data enhancement. The significant positive effects of data enhancement on the ResNet-101 model and ResNet-101+CBAM model in apple leaf disease detection task were clarified. In particular, after data enhancement, the model showed very significant and superior improvement in seven leaf disease categories except 'Frogeye leaf spot' and 'Powdery mildew'. In summary, the attention mechanism and data augmentation strategies introduced in this study resulted in a considerable improvement in performance on the apple leaf disease detection task. This finding is important for improving the efficiency of apple leaf disease monitoring and prevention.
Additionally, this work suggests using multimodal data fusion methods to enhance the apple leaf illness identification task's performance. By combining infrared and multispectral data, we can provide richer information about the physiological state of the plant, thus further improving the performance of the model. Future research directions could include a more in-depth study of multimodal data fusion methods and exploring their applications in other crop and plant health monitoring areas. This research direction is expected to provide strong support for the intelligentization of modern agriculture and the improvement of production efficiency.
References
[1]. Asif Iqbal Khan, S.M.K. Quadri, Saba Banday, Junaid Latief Shah, Deep diagnosis: A real-time apple leaf disease detection system based on deep learning, Computers and Electronics in Agriculture, Volume 198.
[2]. Wang Y, Zhou T, Lu H, et al.Computer aided diagnosis model for lung tumor based on ensemble convolutional neural network[J]. Journal of biomedical engineering, 2017, 34(4):543-551.
[3]. F. N. Al-Wesabi, A. Abdulrahman Albraikan, A. Mustafa Hilal, M. M. Eltahir, M. Ahmed Hamza et al., "Artificial intelligence enabled apple leaf disease classification for precision agriculture," Computers, Materials & Continua, vol. 70, no.3, pp. 6223–6238, 2022.
[4]. Hu, R.; Zou, H.; Li, Z.; Ni, R. Apple-Net: A Model Based on Improved YOLOv5 to Detect the Apple Leaf Diseases. Plants 2023, 12, 169.
[5]. Huang, Y.; Zhang, J.; Zhang, J.; Yuan, L.; Zhou, X.; Xu, X.; Yang, G. Forecasting Alternaria Leaf Spot in Apple with Spatial-Temporal Meteorological and Mobile Internet-Based Disease Survey Data. Agronomy 2022, 12, 679.
[6]. W. Wang, X. Tan, P. Zhang and X. Wang, "A CBAM Based Multiscale Transformer Fusion Approach for Remote Sensing Image Change Detection," in IEEE Journal of Selected Topics in Applied Earth Observations and Remote Sensing, vol. 15, pp. 6817-6825, 2022.
[7]. He, K.; Zhang, X.; Ren, S.; Sun, J. Deep residual learning for image recognition. In Proceedings of the 2016 IEEE Conference on Computer Vision and Pattern Recognition (CVPR), Las Vegas, NV, USA, 27–30 June 2016; pp. 770–778.
[8]. Shafiq, M.; Gu, Z. Deep Residual Learning for Image Recognition: A Survey. Appl. Sci. 2022, 12, 8972.
[9]. Yang, Q.; Duan, S.; Wang, L. Efficient Identification of Apple Leaf Diseases in the Wild Using Convolutional Neural Networks. Agronomy 2022, 12, 2784.
[10]. Feng, J.F.J.; Chao, X.C.X. Apple Tree Leaf Disease Segmentation Dataset; Science Data Bank: Beijing, China, 2022.
[11]. Thapa, R.; Zhang, K.; Snavely, N.; Belongie, S.; Khan, A. The Plant Pathology Challenge 2020 data set to classify foliar disease of apples. Appl. Plant Sci. 2020, 8, e11390.
[12]. Yan, H.; Cai, S.; Li, Q.; Tian, F.; Kan, S.; Wang, M. Study on the Detection Method for Daylily Based on YOLOv5 under Complex Field Environments. Plants 2023, 12, 1769.
[13]. Chao, X.; Sun, G.; Zhao, H.; Li, M.; He, D. Identification of Apple Tree Leaf Diseases Based on Deep Learning Models. Symmetry 2020, 12, 1065.
[14]. Xie, W.; Fang, Y.; Yang, G.; Yu, K.; Li, W. Transformer-Based Multi-Modal Data Fusion Method for COPD Classification and Physiological and Biochemical Indicators Identification. Biomolecules 2023, 13, 1391.
Cite this article
Lin,R. (2024). Apple leaf diseases recognition based on ResNet-101 and CBAM. Applied and Computational Engineering,51,257-267.
Data availability
The datasets used and/or analyzed during the current study will be available from the authors upon reasonable request.
Disclaimer/Publisher's Note
The statements, opinions and data contained in all publications are solely those of the individual author(s) and contributor(s) and not of EWA Publishing and/or the editor(s). EWA Publishing and/or the editor(s) disclaim responsibility for any injury to people or property resulting from any ideas, methods, instructions or products referred to in the content.
About volume
Volume title: Proceedings of the 4th International Conference on Signal Processing and Machine Learning
© 2024 by the author(s). Licensee EWA Publishing, Oxford, UK. This article is an open access article distributed under the terms and
conditions of the Creative Commons Attribution (CC BY) license. Authors who
publish this series agree to the following terms:
1. Authors retain copyright and grant the series right of first publication with the work simultaneously licensed under a Creative Commons
Attribution License that allows others to share the work with an acknowledgment of the work's authorship and initial publication in this
series.
2. Authors are able to enter into separate, additional contractual arrangements for the non-exclusive distribution of the series's published
version of the work (e.g., post it to an institutional repository or publish it in a book), with an acknowledgment of its initial
publication in this series.
3. Authors are permitted and encouraged to post their work online (e.g., in institutional repositories or on their website) prior to and
during the submission process, as it can lead to productive exchanges, as well as earlier and greater citation of published work (See
Open access policy for details).
References
[1]. Asif Iqbal Khan, S.M.K. Quadri, Saba Banday, Junaid Latief Shah, Deep diagnosis: A real-time apple leaf disease detection system based on deep learning, Computers and Electronics in Agriculture, Volume 198.
[2]. Wang Y, Zhou T, Lu H, et al.Computer aided diagnosis model for lung tumor based on ensemble convolutional neural network[J]. Journal of biomedical engineering, 2017, 34(4):543-551.
[3]. F. N. Al-Wesabi, A. Abdulrahman Albraikan, A. Mustafa Hilal, M. M. Eltahir, M. Ahmed Hamza et al., "Artificial intelligence enabled apple leaf disease classification for precision agriculture," Computers, Materials & Continua, vol. 70, no.3, pp. 6223–6238, 2022.
[4]. Hu, R.; Zou, H.; Li, Z.; Ni, R. Apple-Net: A Model Based on Improved YOLOv5 to Detect the Apple Leaf Diseases. Plants 2023, 12, 169.
[5]. Huang, Y.; Zhang, J.; Zhang, J.; Yuan, L.; Zhou, X.; Xu, X.; Yang, G. Forecasting Alternaria Leaf Spot in Apple with Spatial-Temporal Meteorological and Mobile Internet-Based Disease Survey Data. Agronomy 2022, 12, 679.
[6]. W. Wang, X. Tan, P. Zhang and X. Wang, "A CBAM Based Multiscale Transformer Fusion Approach for Remote Sensing Image Change Detection," in IEEE Journal of Selected Topics in Applied Earth Observations and Remote Sensing, vol. 15, pp. 6817-6825, 2022.
[7]. He, K.; Zhang, X.; Ren, S.; Sun, J. Deep residual learning for image recognition. In Proceedings of the 2016 IEEE Conference on Computer Vision and Pattern Recognition (CVPR), Las Vegas, NV, USA, 27–30 June 2016; pp. 770–778.
[8]. Shafiq, M.; Gu, Z. Deep Residual Learning for Image Recognition: A Survey. Appl. Sci. 2022, 12, 8972.
[9]. Yang, Q.; Duan, S.; Wang, L. Efficient Identification of Apple Leaf Diseases in the Wild Using Convolutional Neural Networks. Agronomy 2022, 12, 2784.
[10]. Feng, J.F.J.; Chao, X.C.X. Apple Tree Leaf Disease Segmentation Dataset; Science Data Bank: Beijing, China, 2022.
[11]. Thapa, R.; Zhang, K.; Snavely, N.; Belongie, S.; Khan, A. The Plant Pathology Challenge 2020 data set to classify foliar disease of apples. Appl. Plant Sci. 2020, 8, e11390.
[12]. Yan, H.; Cai, S.; Li, Q.; Tian, F.; Kan, S.; Wang, M. Study on the Detection Method for Daylily Based on YOLOv5 under Complex Field Environments. Plants 2023, 12, 1769.
[13]. Chao, X.; Sun, G.; Zhao, H.; Li, M.; He, D. Identification of Apple Tree Leaf Diseases Based on Deep Learning Models. Symmetry 2020, 12, 1065.
[14]. Xie, W.; Fang, Y.; Yang, G.; Yu, K.; Li, W. Transformer-Based Multi-Modal Data Fusion Method for COPD Classification and Physiological and Biochemical Indicators Identification. Biomolecules 2023, 13, 1391.