


1. Introduction
The market for stocks is the main source of corporate financing, while the quantity of individuals making stock market investments is also growing. It has a significant impact on the economy and society. For one thing, constructing an effective stock prediction model is conducive for governments to grasp the trend of market changes, formulate relevant policies, and safeguard the development of different industries, which is of great significance to facilitate the social capital flow and promote economic development. For another, an effective stock prediction model is also of great significance to individuals. Stock price prediction can provide references for investors, enabling them to minimize risks while maximizing returns. Therefore, it is of great significance to use professional methods to forecast stock price trends.
There are a large number of methods for stock price forecasting in the existing literature, which can be roughly classified into three categories, namely, fundamental analysis methods, time series methods, and machine-learning algorithms. Cheng assesses the financial worth of a listed pharmaceutical company and gives people stock investment advice based on the three links of fundamental analysis [1]. Ma et al. used the autoregressive moving average model, or ARMA model, to analyze and predict the price of gold futures in China [2]. To project the Weighted Stock Index by Capitalization on the Taiwan Stock Exchange, Zhao suggested a model of fuzzy-fluctuation time series (FFTS) [3]. However, stock prices are subject to various factors such as politics, economy, financial environment, human psychology, etc., which show the characteristics of high volatility and non-linearity. Traditional methods such as fundamental analysis and time series models cannot learn and process a large amount of data. Their data-fitting ability is insufficient, which reduces the accuracy of the prediction. And machine learning including deep learning methods has become a very popular technology for stock data prediction in the last few years [4].
Machine learning methods include shallow machine learning methods, such as Bayes classifier, K-Means, etc; and deep learning methods, such as Deep Deterministic Policy Gradient, Gate Recurrent Unit, and Transfer Learning, etc. Kim used the support vector machines (SVM) model to predict the stock index to show that its accuracy was significantly greater than traditional neural network models [5]; Yi built the EEMD-XGBoost combination model to predict the daily closing price of the Shenzhen Composite Index by fusing the Ensemble Empirical Mode Decomposition (EEMD) method with the XGBoost algorithm [6]; Hyun Sik Sim et al. suggested a convolutional neural network (CNN) model-based stock price prediction model [7]; in order to improve the stock index price prediction accuracy, Yao et al. proposed an LSTM neural network model based on HP filter decomposition to predict the stock index price movement [8]; Yuan et al. combined principal component analysis (PCA) and BP neural network model to construct a prediction model which improves the accuracy of stock price prediction [9]. However, most of the above studies involve analysis of the accuracy of individual or combined machine-learning methods for stock price prediction, and they are lacking in comparative studies between different methods.
The main research of this article is to download the Airbnb historical stocks ranging from 10 December 2020 to 19 August 2022 as the dataset and divide 65 percent of it into training sets and 35 percent into test sets. Normalization and handling of outliers are applied to data processing. Then predictions are made using four commonly used machine learning models, which are the KNN, the RF, the SVR, and the LSTM models. For stock price-based model prediction, MSE, MAE, and \( {R^{2}} \) score is selected as the metrics for model prediction evaluation. To evaluate the accuracy of various stock price prediction models, visual image fitting and concretized evaluation metrics are used. The results illustrate that the GRU model performs best.
2. Methods
2.1. K-Nearest Neighbor (KNN)
The KNN model is widely used in image classification, financial forecasting, and medical diagnosis. Nayak et al. said that the KNN model formulates forecasts by determining which k-nearest neighbours are closest to the testing sample [10]. The following are the specific steps of KNN:
(1) Determine the distance between each sample point in the test and training samples.
(2) Choose k points with the shortest distance.
(3) Examine the groups that the points fall into, then give the test point to the group with the largest percentage.
2.2. Random Forest (RF)
A popular machine learning algorithm called Random Forest constructs multiple decision trees, counts the predictions of each tree in the forest, and then selects the final result from these predictions by voting method. The following are the specific steps:
1. N and M are the quantity of training samples and features of the model.
2. Input the feature count (m) to find a node's decision outcome in the decision tree (m<<M).
3. Create a training set by sampling the N training samples N times using put-back sampling; use the unsampled samples to generate predictions and assess their errors.
4. Choose m features at random for each node in the decision tree, based on which each node's decision is made. Determine the best way to split it based on these m features.
5. Each tree is grown to achieve its full potential without any pruning.
2.3. Long Short-Term Memory (LSTM)
This model also has important applications in the financial field. The key to the LSTM memory cell structure is a state space and three gating units. And \( {f_{t}}、{i_{t}} \) 、 \( {O_{t}} \) represent gates for forgetting, input, and output respectively. The primary formula is as follows:
\( {f_{t}}=σ({w_{f}}∙{x_{t}}+{b_{f}}) \) | (1) |
\( {i_{t}}=σ({w_{i}}∙[{h_{t-1}},{x_{t}}]+{b_{i}}) \) | (2) |
\( {\widetilde{C}_{t}}=tanh({W_{c}}∙[{h_{t-1}},{x_{t}}]+{b_{c}}) \) | (3) |
\( {C_{t}}={f_{t}}∙{C_{t-1}}+{i_{t}}∙{\widetilde{C}_{t}} \) | (4) |
\( {h_{t}}=σ({W_{o}}∙[{h_{t-1}},{x_{t}}]+{b_{o}})∙tanh({C_{t}}) \) | (5) |
In the formula, \( {C_{t}} \) stands for the content of the memory cell; and \( {\widetilde{C}_{t}} \) stands for the content of the new memory cell; W is the corresponding function's weight matrix.; \( x \) is the input vector of the model; h is the hidden layer vector, b is the bias vector; the function applied is the hyperbolic tangent function (tanh) and the SIGMOID function( \( σ) \) .
2.4. Gate Recurrent Unit (GRU)
Cho et al introduced Neural Networks of Gated Recurrent Unit (GRU) in 2014 [11]. GRU is similar to the idea of LSTM in design and is a very effective variant of LSTM neural networks. Therefore, is also widely used in the financial field.
There are only two gating units in the GRU: the reset and the memory gate, which are represented by \( {r_{t}}、{z_{t}} \) , respectively. The following is the formula of this model:
\( {z_{t}}=σ({W_{z}}∙[{h_{t-1}},{x_{t}}]+{b_{z}}) \) | (6) |
\( {r_{t}}=σ({W_{r}}∙[{h_{t-1}},{x_{t}}]+{b_{r}}) \) | (7) |
\( {\widetilde{h}_{t}}=tanh(W∙[{{r_{t}}∙h_{t-1}},{x_{t}}]+b) \) | (8) |
In the formula, the variables have the same meaning as in the LSTM neural network.
2.5. Main Parameters
Table 1 displays the primary parameters of the four models mentioned above.
Table 1. Main parameters of the four models
Methodology | Main tuning parameters | Values |
K-Nearest Neighbors | n_neighbours | 15 |
metric | Minkowski | |
Random Forest | N_estimators | 100 |
Random_state | O | |
Long Short-Term Memory | Epchs | 200 |
Batch | 5 | |
Gate Recurrent Unit | Epchs | 200 |
Batch | 5 |
3. Data
3.1. Information Description
The dataset of this article is from the website of Kaggle. The historical stock prices of Airbnb from 10th December 2020 to 19th August 2022 are downloaded, with a total of 426 trading days. The dataset covers the date, close price, and the volume of the stocks. In this paper, close price is applied to train the models. Table 2 illustrates the characteristics of the close price of the Airbnb stocks.
Table 2. Main characteristics of the close price
Characteristics | Values |
Min | 89.08 |
Max | 216.84 |
Mean | 155.34 |
Variance | 737.92 |
Standard Deviation | 27.16 |
3.2. Data Processing
To guarantee the data's quality and correctness before data analysis, this article first uses the mean-filling method to deal with missing values. In other words, for the missing values in each column, the mean of the current column is filled.
Then, in order to facilitate data analysis, the mean-variance method is used to standardize the data with the following formula, where \( x \) and \( {x^{*}} \) denote the original and standardized data, respectively:
\( {x^{*}}=\frac{x-mean(x)}{std(x)} \) | (9) |
3.3. Splitting
After data normalization, the data in this paper is separated into test and training sets. Of the original data, there were 277 data in the training set (which makes up 65% of the total) and 149 data in the test set (35% of the total). Next, a predictive training model is constructed using the training set.
4. Results
4.1. Predicted Results
With Python, the stock price prediction models of the KNN, the RF, the SVR, the LSTM, and the GRU are implemented. The predictions made by the four models for the training and test sets are shown in Figure 1.
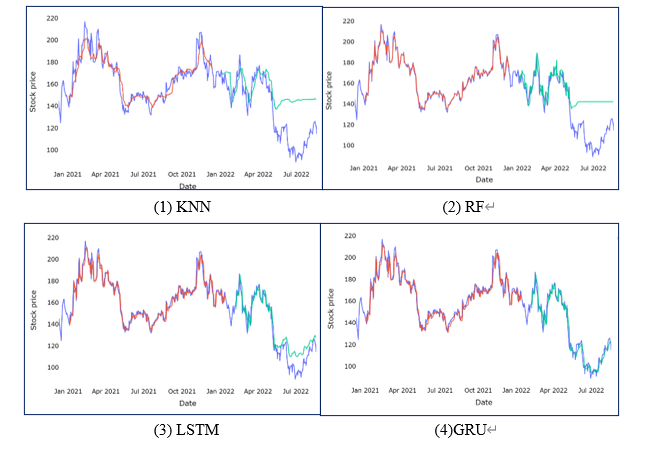
Figure 1. Comparison between original close vs predicted close price
In these figures, the purple line represents the original stock data, the stock data predicted by the test set is shown as green, and the stock data predicted by the training set is shown as red. The figure illustrates how the KNN model predicts stock data that deviates significantly from the original data; the RF model works better in the normal fluctuation part of the stock price, but does not predict well when the stock price falls below the minimum point; the predicted stock data of the LSTM and GRU models have a good overall fit with the original stock data.
The KNN and RF models perform poorly when the stock prices drop sharply, which may be due to the high dependence of these two models on the training data. The stock prices in the test set drop below the training data's minimal value.so the training models predict the data in the training set with good accuracy but cannot accurately predict the data in the test set.
4.2. Metrics for Model Evaluation
The three commonly used evaluation indicators are Mean Squared Error, Mean Absolute Error, and Resolvable coefficient. In this article, the accuracy of the four models is evaluated using these three measures.
(1) The ratio of the square sum of the differences between the real and projected values to the number of observations is termed the mean square error, or MSE. It can be calculated using the following formula:
\( MSE=\frac{1}{m}\sum _{i=1}^{m}{({Y_{i}}-f({x_{i}}))^{2}} \) | (10) |
(2) The average of the variation between the real and projected values is termed the Mean Absolute Error, or MAE, with the following formula:
\( MAE=\frac{1}{m}\sum _{i=1}^{m}|{Y_{i}}-f({x_{i}})| \) | (11) |
(3) Resolvable coefficient ( \( {R^{2}} \) ), or the goodness of fit, measures how much he independent variable \( x \) can account for variations in the dependent variable \( y \) . The more closely the resolvable coefficient's value approaches 1, the better the model fits. The formula is as follows:
\( {R^{2}}(y, \hat{y})=1-\frac{\sum _{i=1}^{n}{({y_{i}}-{\hat{y}_{i}})^{2}}}{\sum _{i=1}^{n}{({y_{i}}-\bar{y})^{2}}} \) | (12) |
With Python, the models of the KNN, the RF, the SVR, the LSTM, and the GRU are implemented. Table 3 shows the evaluation metrics data of different models.
Table 3. Data of evaluation metrics of four models
Methodology | MSE | MAE | R2 score |
K-nearest Neighbor | 777.85 | 22.66 | 0.03 |
Random Forest | 642.18 | 20.04 | 0.18 |
Long Short-Term Memory | 95.52 | 8.09 | 0.88 |
Gate Recurrent Unit | 33.95 | 4.63 | 0.96 |
In this table, it can be seen that the MSE, and MAE metrics of KNN and RF methods have slight differences, but they are all significantly higher than those of the models of LSTM and GRU. However, compared to the LSTM and GRU models, the \( {R^{2}} \) scores of the KNN and RF models are significantly lower. Therefore, compared to KNN and RF methods, LSTM and GRU methods have better predictive effectiveness.
Then the models of LSTM and GRU are compared, and it is concluded that the MSE, and MAE metrics of the GRU method are lower by 3.94, 61.57, and 3.46, respectively, and the \( {R^{2}} \) scores are higher than that of the LSTM by 0.08. The GRU model has the best prediction accuracy, according to the data.
5. Conclusion and limitations
Based on Airbnb’s historical stock data, forecasting models are constructed using four machine-learning methods. The accuracy of various methods is compared through visual image fitting and specific evaluation metrics. Finally, it is found that GRU and LSTM models predict significantly better than the KNN and RF models, with the GRU model predicting the best.
There are numerous machine-learning methods used for stock prediction, and the comparative analysis of these four common machine-learning algorithms in this article is useful for investors or governments to choose accurate and effective stock prediction methods. Choosing effective stock prediction methods so as to make reasonable predictions on stock price changes is of great significance and practical application value for stockholders, stock market stability, and national economic development.
However, owing to the limitations of time and equipment, there are still certain issues with this article that could be fixed in the future in the following areas:
(1) In the comparative study, this article is mainly based on the dataset of Airbnb, which lacks reliability. In the future, experiments can be improved by introducing multiple datasets from different countries and different industries, so as to compare the effects of the machine learning models in a more detailed way.
(2) This article focuses on the comparison of the prediction accuracy of different machine-learning models, so it lacks in-depth excavation of the model parameters and algorithm integration of a certain model. The accuracy of prediction would be improved from the aspects of model parameter selection in the future.
(3) Prediction accuracy may be insufficient. This article chooses the basic volume-price characteristics, lacking in the analysis of macro policy, unexpected events, and investors' psychological expectations. More relevant factors, such as economic policy and stockholders' comments should be added to the models.
References
[1]. Cheng, W. R. Investment Value Analysis Report of Pharmaceutical Companies - Based on Fundamental Perspective. Quality and Market, 2021 (22): 103-105.
[2]. Ma, B. Z., Zhen, B. Q. Empirical analysis of gold futures price forecasting model based on time series analysis. Business, 2015, (07): 152.
[3]. Zhao, A., Gao, J., & Guan, H. A Two-Factor Fuzzy-Fluctuation Time Series Forecasting Model for Stock Markets Based on a Probabilistic Linguistic Preference Relationship and Similarity Measure. IEEE Access, 2021, 9: 144740-144755
[4]. Noella, N., Yeruva, V. R. R. Financial applications of machine learning: A literature review. Expert Systems with Applications, 2023, 219: 119640.
[5]. Kyoung-jae Kim. Financial time series forecasting using support-vector machines. Neurocomputing, 2003, 55(1): 307-319.
[6]. Yi, J. Research on stock market analysis and prediction based on EEMD and XGBoost algorithm. Shandong University, thesis for master’s degree, 2020.
[7]. Hyun, S. S., Hae, I. K., Jae, J. A., Is Deep Learning for Image Recognition Applicable to Stock Market Prediction?. Complexity, 2019: 4324878.
[8]. Yao, Y., Zhang, C. Y. A stock index price prediction method based on HP-LSTM model. Computer Engineering and Application, 2021, 57(24): 296-304.
[9]. Yuan, W. K., Zhou, Z. T. Research on the influencing factors of stock price volatility based on PCA-BP neural network[J]. Commercial Exhibition Economics, 2023(10): 99-101.
[10]. Zhang, S. C., et al. Learning k for knn classification. ACM Transactions on Intelligent Systems and Technology (TIST), 2017, 8(3): 1-19.
[11]. Chung, J., Gülçehre, Ç., Cho, K., et al. Empirical Evaluation of Gated Recurrent Neural Networks on Sequence Modeling. CoRR, 2014: 1412.3555.
Cite this article
Chen,Q. (2024). Stock price forecasting using machine-learning methods. Applied and Computational Engineering,52,208-214.
Data availability
The datasets used and/or analyzed during the current study will be available from the authors upon reasonable request.
Disclaimer/Publisher's Note
The statements, opinions and data contained in all publications are solely those of the individual author(s) and contributor(s) and not of EWA Publishing and/or the editor(s). EWA Publishing and/or the editor(s) disclaim responsibility for any injury to people or property resulting from any ideas, methods, instructions or products referred to in the content.
About volume
Volume title: Proceedings of the 4th International Conference on Signal Processing and Machine Learning
© 2024 by the author(s). Licensee EWA Publishing, Oxford, UK. This article is an open access article distributed under the terms and
conditions of the Creative Commons Attribution (CC BY) license. Authors who
publish this series agree to the following terms:
1. Authors retain copyright and grant the series right of first publication with the work simultaneously licensed under a Creative Commons
Attribution License that allows others to share the work with an acknowledgment of the work's authorship and initial publication in this
series.
2. Authors are able to enter into separate, additional contractual arrangements for the non-exclusive distribution of the series's published
version of the work (e.g., post it to an institutional repository or publish it in a book), with an acknowledgment of its initial
publication in this series.
3. Authors are permitted and encouraged to post their work online (e.g., in institutional repositories or on their website) prior to and
during the submission process, as it can lead to productive exchanges, as well as earlier and greater citation of published work (See
Open access policy for details).
References
[1]. Cheng, W. R. Investment Value Analysis Report of Pharmaceutical Companies - Based on Fundamental Perspective. Quality and Market, 2021 (22): 103-105.
[2]. Ma, B. Z., Zhen, B. Q. Empirical analysis of gold futures price forecasting model based on time series analysis. Business, 2015, (07): 152.
[3]. Zhao, A., Gao, J., & Guan, H. A Two-Factor Fuzzy-Fluctuation Time Series Forecasting Model for Stock Markets Based on a Probabilistic Linguistic Preference Relationship and Similarity Measure. IEEE Access, 2021, 9: 144740-144755
[4]. Noella, N., Yeruva, V. R. R. Financial applications of machine learning: A literature review. Expert Systems with Applications, 2023, 219: 119640.
[5]. Kyoung-jae Kim. Financial time series forecasting using support-vector machines. Neurocomputing, 2003, 55(1): 307-319.
[6]. Yi, J. Research on stock market analysis and prediction based on EEMD and XGBoost algorithm. Shandong University, thesis for master’s degree, 2020.
[7]. Hyun, S. S., Hae, I. K., Jae, J. A., Is Deep Learning for Image Recognition Applicable to Stock Market Prediction?. Complexity, 2019: 4324878.
[8]. Yao, Y., Zhang, C. Y. A stock index price prediction method based on HP-LSTM model. Computer Engineering and Application, 2021, 57(24): 296-304.
[9]. Yuan, W. K., Zhou, Z. T. Research on the influencing factors of stock price volatility based on PCA-BP neural network[J]. Commercial Exhibition Economics, 2023(10): 99-101.
[10]. Zhang, S. C., et al. Learning k for knn classification. ACM Transactions on Intelligent Systems and Technology (TIST), 2017, 8(3): 1-19.
[11]. Chung, J., Gülçehre, Ç., Cho, K., et al. Empirical Evaluation of Gated Recurrent Neural Networks on Sequence Modeling. CoRR, 2014: 1412.3555.