


1. Introduction
The term "customer churn" describes the circumstance in which a bank's clients stop using its initial services, refraining from making repeat purchases, or terminating their existing products or services. Due to the growth of online finance and heightened competition in the traditional banking sector, banks now need to focus especially on maximizing their own potential, drawing in quality clients, and minimizing customer attrition [1]. According to the Harvard Business Review, a 5% customer attrition rate can result in a 25%–85% boost in profitability for businesses. Moreover, acquiring new customers might incur expenses up to six times greater than maintaining current ones [2]. Therefore, after losing a customer, the cost of acquiring and developing new customers is substantial, and most new consumers do not yield revenues that are as great as those from devoted ones. Consequently, customer churn management is increasingly emphasized in every industry. Predicting potential churn customers, effectively retaining them, and providing proper care are among the crucial concerns for businesses [3]. Therefore, this article also focuses on the issue of customer churn.
2. Literature review
This is such a common topic that many coders or scholars have worked on this topic. AL Najjar, AL Rousan, and AL Najjar employed a feature selection strategy for prediction together with five popular machine learning models to address this issue. The independent variables were chosen using three different models: feature selection, two-step clustering with k-nearest neighbors, and selection of all independent variables. The other five machine learning prediction models chosen were cardinality automated interaction detection trees, c5-trees, neural networks, Bayesian networks, and categorical regression trees. According to the investigation, every machine learning model was able to forecast correctly. In addition, the results show that the C5 tree model has the highest prediction accuracy and therefore performs the best compared to the other constructed models. The entire quantity of transactions, the total number of modified transactions, and the overall revolving credit card balance were found to be the three most crucial parameters required to construct the C5 Tree customer churn prediction model. In the end, the findings demonstrate that combining several categorical factors into a single variable improves the predictive model's performance [4].
Improved balanced random forests (IBRF) is a unique learning technique that Xie, Li, Ngai, and Ying propose and show for churn prediction. In order to outperform most current algorithms, researchers have improved the classic random forests technique in a few ways. These enhancements include cost-sensitive learning, which accounts for the various costs or repercussions of classification errors across different categories, and sampling techniques, which are intended to increase model performance and resilience. These little improvements can assist increase the capacity to forecast client attrition. Because of the way IBRF operates—changing the distribution of classes and applying heavier penalties for a small number of incorrect classification errors—its best attributes are continuously taught. They utilized a real-world data set on customer churn from a specific bank to evaluate the effectiveness of this method. When compared to other algorithms, including decision trees, CWC - SVM (the abbreviation of class-weighted core support vector machines), and artificial neural networks, it is discovered to considerably increase prediction accuracy. Additionally, the method they used in this research outperforms other random forests algorithms in terms of prediction results [5].
TRACT Churn prediction is the name of the churn prediction model that Shaaban, Helmy, Khedr, and Nasr suggest. It seeks to identify clients who plan to discontinue using a service provider. Retaining current clients is five to ten times more expensive for a business than acquiring new ones. Predictive modeling can precisely detect possible agitators in the near future and offer retention remedies.They introduce a brand-new prediction model built using data mining (DM) methods. There are 5000 instances and 23 attributes in the data set. A testing set of 1000 instances and 4000 instances were used to train the model. In the event that a retention strategy is used, the predicted churners are grouped into three categories. The open-source program WEKA uses decision trees, support vector machines, and neural networks as data mining approaches [6].
Lu, Lin, Lu, and Zhang are four scholars who collaborated on an empirical study on customer churn prediction. Boosting is an ensemble learning method that combines the predictions of multiple weak learners to form a more powerful ensemble model. Generally, it is used as a technique to improve the accuracy of the base learners. However, they had a different idea of using Boosting to enhance the model. They attempted to divide clients into two groups based on the weights assigned by the Boosting algorithm. In their research, the model is constructed on each cluster, and logistic regression is used as a basis learner. There is only one logistic regression model used to compare the outcome. According to experimental evaluation, boosting is recommended for churn prediction analysis since it effectively separates churn data [7].
In their research, XIA and JIN used the Support Vector Machine method based on structural risk reduction to increase the prediction accuracy. This method incorporates the principles of structural risk minimization, considering not only the accuracy of sample classification but also the complexity of the model. To enhance the model's capacity for generalization and achieve robust classification outcomes on unseen data, they explore the feature space for a maximum margin hyperplane and optimize the separation between it and the closest sample point. To validate the superior capabilities of the model, they compared it with other methods such as artificial neural networks in customer churn prediction cases within domestic and international carriers. The results of the study show that the Support Vector Machine method produces the best results in terms of enhancement factor, coverage, accuracy and hit rate. Thus, it provides a useful metric for predicting customer churn [8].
3. Methods
3.1. Data Processing
Some basic data processing are performed on the raw data set. Firstly, the shape of the data set was examined, along with the data information. The "CLIENTNUM" column was removed as it served as a unique identifier and was irrelevant for prediction. The columns were split into lists of categorical and numerical features. The presence of duplicate values was checked. The count of unique values in each column was calculated. Descriptive analysis was performed separately for numerical and categorical data [9]. Secondly, data visualization methods were used to represent a specific attribute of the data set using charts and graphs in order to obtain intuitive conclusions. The figures and conclusion are as follows:
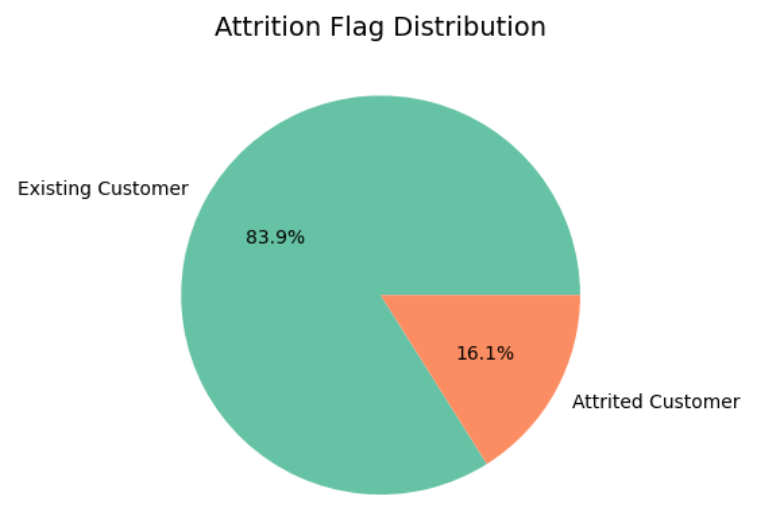
Figure 1. The pie chart of Attrition_Flag Distribution
Only 16.1% of the customers in the data set are churned, making it challenging to predict customer churn accurately. Therefore, the choice of model and its predictive accuracy are crucial (see figure 1).
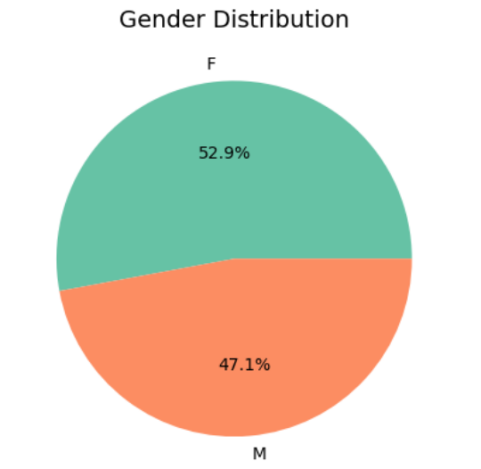
Figure 2. The pie chart of Gender Distribution
It can be observed that in the data set, there are slightly more samples of females compared to males. However, the difference in percentages is not significant, so gender is evenly distributed (see figure 2).
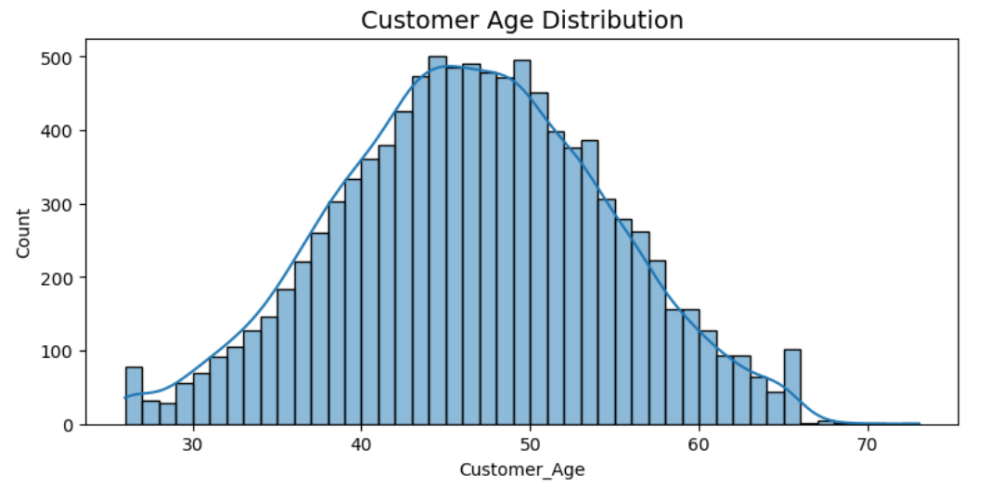
Figure 3. The bar chart of Customer_Age Distribution
It can be seen that the age distribution of customers roughly follows a normal distribution (see figure 3).
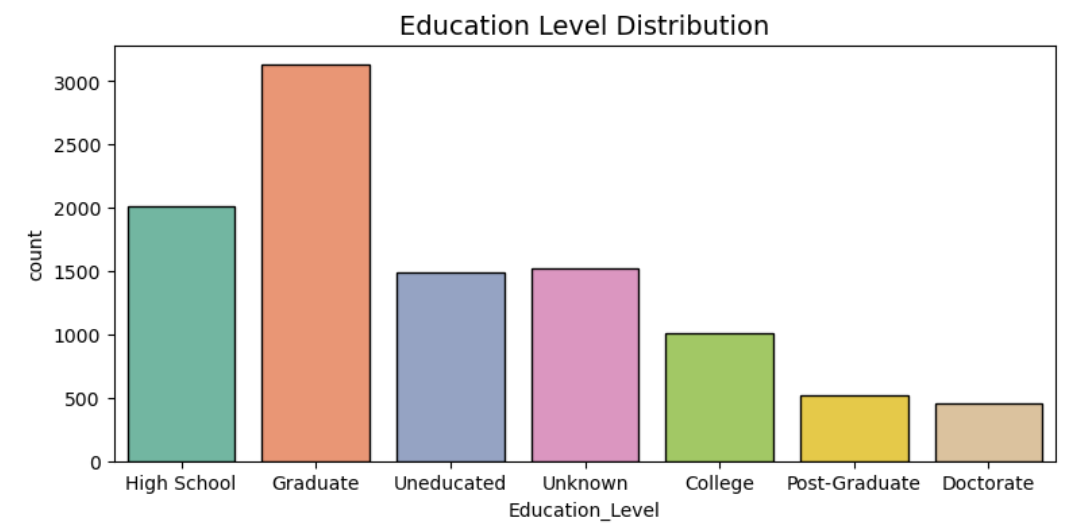
Figure 4. The bar chart of Education_Level Distribution
It can be said that more than 70% of the customers have formal education, assuming that the majority of those with an education level of "Unknown" have never attended school. Of them, about thirty-five percent possess a degree that is higher than a Master's, and forty-five percent have at least a Bachelor's degree (see figure 4).
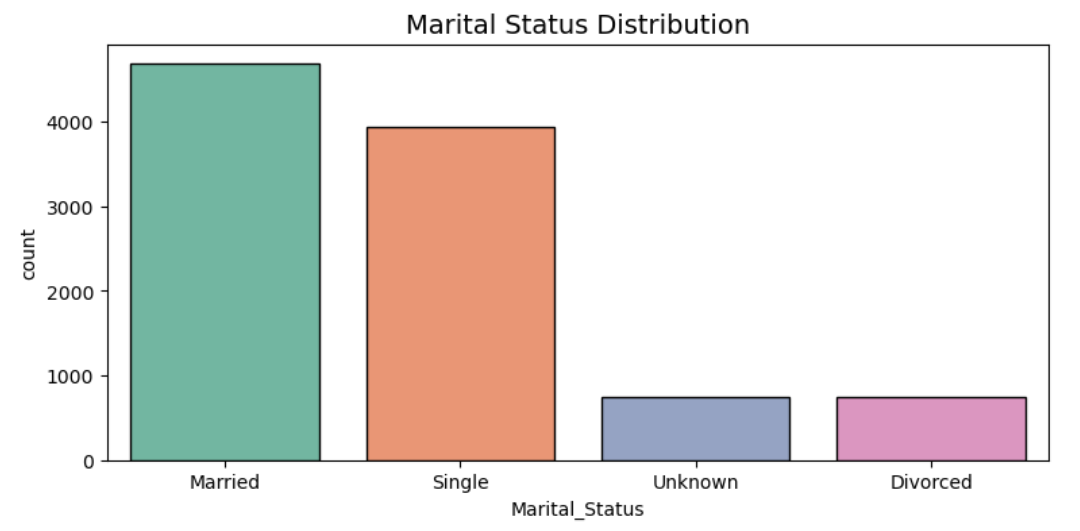
Figure 5. The bar chart of Marital_Status Distribution
It appears that nearly half of the bank's customers are married individuals. Interestingly, the other half of the customers are predominantly single individuals. Additionally, only 7% of the customers are divorced (see figure 5).

Figure 6. The bar chart of Income_Category Distribution
It is evident that the majority of individuals have an annual income below $60,000 (see figure 6).
Thirdly, the missing data is handled and used one-hot coding to handle the categorical data. Also, the IQR method is used to handle the outliers. The size of the data set was (10127,24) before minimizing outliers and after processing, the size became (8493,24). Then, the data is divided into a test set and a training set (20% testing, 80% training), and x features and y labels are extracted.Fourthly, data set was imbalanced so SMOTEis used to balance the data because under-sampling could cause data loss and affect prediction quality when the initial data was imbalanced [10].
Fifthly, the numerical features are standardized with standard scaling. Finally, the heat map correlation and the correlation metrics are visualized.
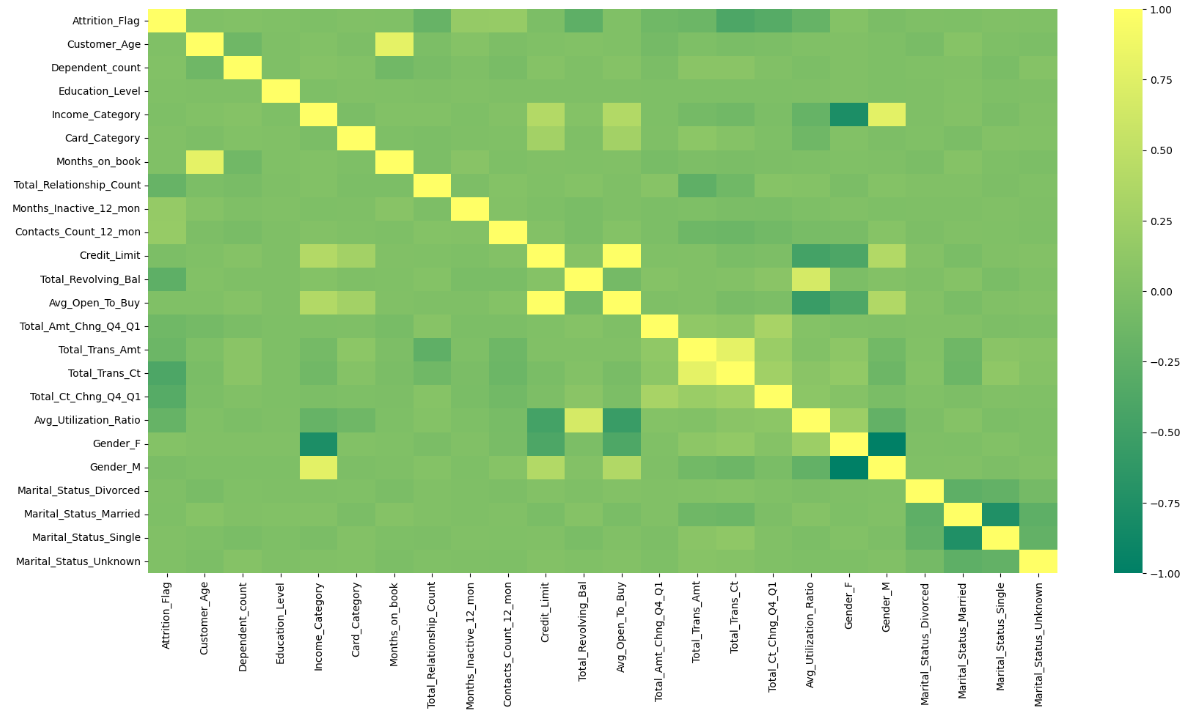
Figure 7. The heat map correlation
As is shown in the heat map correlation, the conclusion is that the ‘Avg_Open_To_Buy’ mostly positively correlated with ‘Credit Limit’, while ‘Gender M’ mostly negatively correlated with ‘Gender F’ which is obvious. ‘Total_Trans_Ct’ with ‘Total_Trans_Amt’ ranked second in the positive correlation, while ‘Income_Category’ with ‘Gender F’ ranked second in the negative correlation (see figure 7).
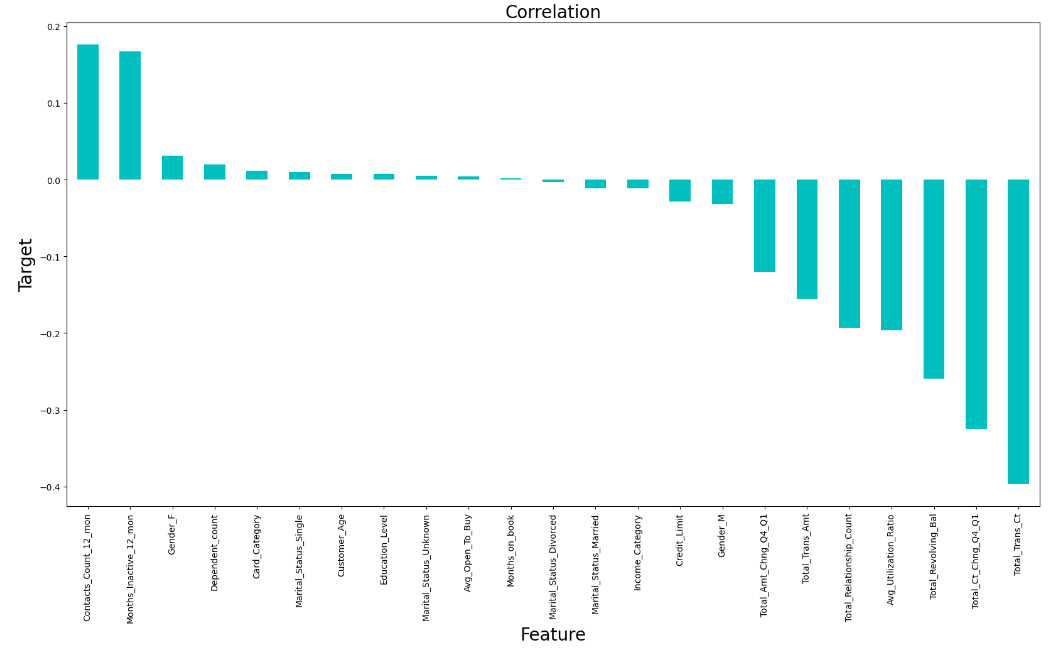
Figure 8. The correlation metrics
As is shown in the correlation metrics, ‘Contacts_Count_12_mon’ is the most positively related attribute, the followings are ‘Months_Inactive_12_mon’, ‘Gender F’, ‘Dependent_count’, ‘Card_Category’, ‘Marital_Status_Single’, ‘Customer_Age’, ‘Education_Level’, ‘Marital_Status_Unknown’, ‘Avg_Open_To_Buy’ and ‘Months_on_book’. In contrast, ‘Total_Trans_Ct’ is the most negatively related attribute, the followings are ‘Total_Ct_Chng_Q4_Q1’, ‘Total_Revolving_Bal’, ‘Avg_Utilization_Ratio’, ‘Total_Relationship_Count’, ‘Total_Trans_Amt’, ‘Total_Amt_Chng_Q4_Q1’, ‘Gender M’, ‘Credit_Limit’, ‘Income_Category’, ‘Marital_Status_Married’ and ‘Marital_Status_Divorced’ (see figure 8).
3.2. Models Training and Evaluation
Nine classifiers were included in the list: 'Logistic Regression', 'K-Nearest Neighbors', 'Support Vector Classifier', 'Plain Bayes', 'Decision Tree', 'Random Forest', 'AdaBoost', 'Gradient Boost', and 'XGBoost'. The list also included tests' accuracy scores and corresponding F1 values. A loop was implemented to iterate through the classifiers, fitting the models and calculating both training and test accuracy. The F1 scores were computed and stored, as well as the test accuracy scores.Finally, the details of each model were printed.
3.3. Hyperparameter Tuning
3.3.1. K-fold Cross-Validation Evaluation of XGBoost Classifier. XGBoost model is doing very well, with an average accuracy of about 98.2%. It's also consistent in its performance across different tests, which is a good sign.
3.3.2. Hyperparameter Tuning for XGBoost Classifier. The fact that there wasn't a significant improvement in test accuracy after fine-tuning XGBoost suggests that the initial settings were already pretty good. Making small changes didn't make a big difference in performance.
4. Results
4.1. Training Accuracy and Testing Accuracy by 9 Classifiers
The table 1 presents the prediction accuracy of the nine methods employed in this study. XGBoost has both the highest score of training accuracy and testing accuracy. 1.0000 was the training accuracy and 0.9747 was the testing accuracy. The accuracy of all classifiers are all above 0.8. So all the classifiers are very excellent.
Table 1. training and testing accuracy of 9 models
Training Accuracy | Testing Accuracy | |
Logistic Regression | 0.9189 | 0.9046 |
K-Nearest Neighbors | 0.9568 | 0.8746 |
Support Vector Classifier | 0.9630 | 0.9264 |
Naive Bayes | 0.8624 | 0.8046 |
Decision Tree | 1.0000 | 0.9270 |
Random Forest | 1.0000 | 0.9576 |
AdaBoost | 0.9609 | 0.9470 |
Gradient Boosting | 0.9782 | 0.9665 |
XGBoost | 1.0000 | 0.9747 |
4.2. Test Accuracy Scores by Classifiers
The algorithms with the greatest tested accuracy, XGBoost, Random Forest, AdaBoost, Decision Tree, Support Vector Classifier, Logistic Regression, K-Nearest Neighbor, and Plain Bayes are in order of decreasing order, with XGBoost coming in closest to 1. All the test accuracy are above 0.8, which is a good result (see figure 9).
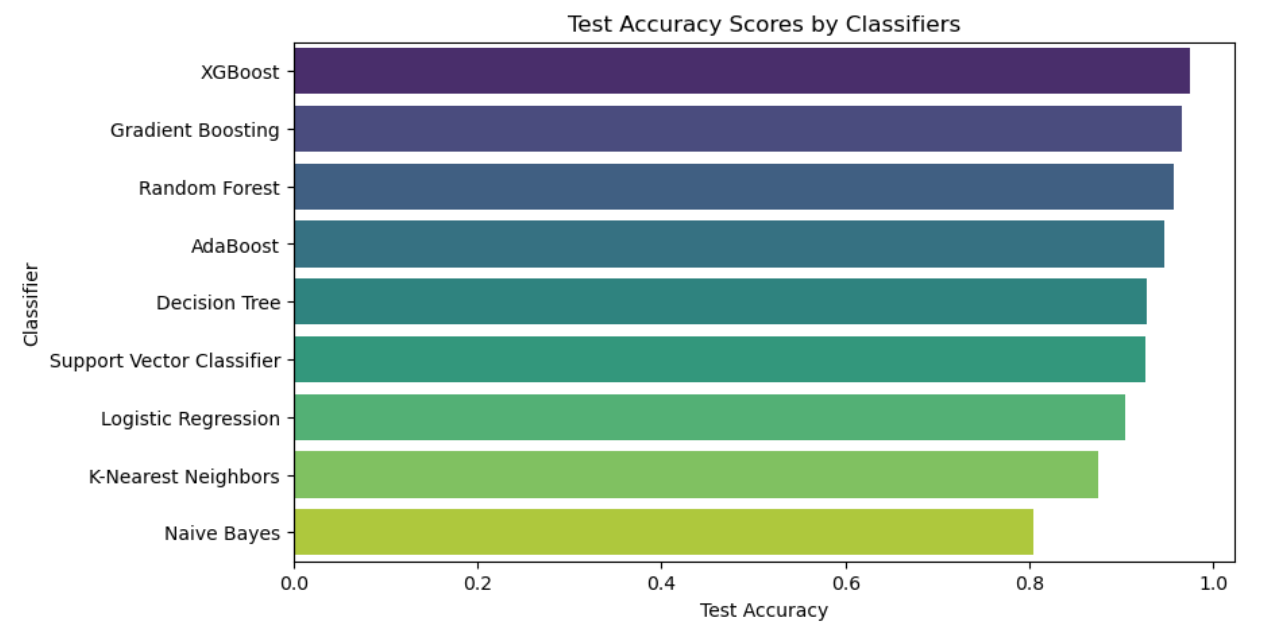
Figure 9. The test accuracy scores by classifiers
4.3. F1-Score by Classifiers
With an F1 score of 0.92, XGBoost gets the greatest rating for testing accuracy, followed by Gradient Boosting, Random Forest, AdaBoost, Decision Tree, Support Vector Classifier, Logistic Regression, K-Nearest Neighbors, and Naive Bayes, in that order. Naive Bayes has the lowest rating [11]. XGBoost stands out as the strongest model with perfect training accuracy score of 100%, excellent testing accuracy score of 97% and has the highest F1-score of 92% among all models. Next, this paper will work on improving the XGBoost model to see if it can be more accurate (see figure 10).
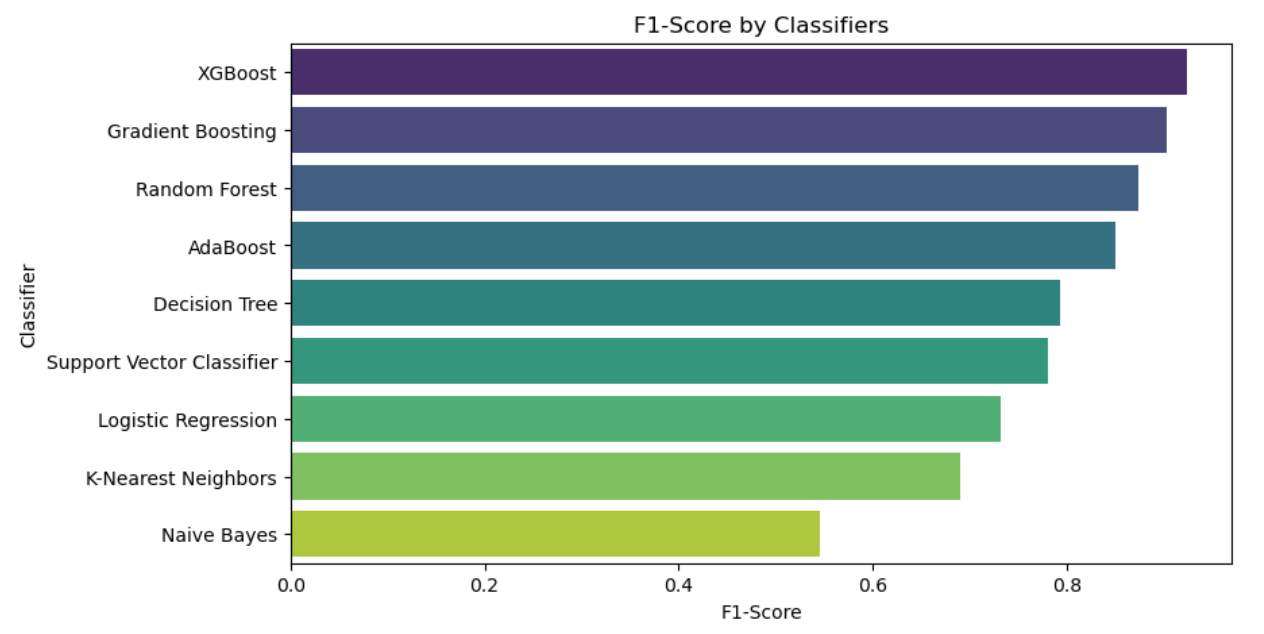
Figure 10. F1-score by classifiers
4.4. ROC Curve for XGBoost Classifier
The ROC curve with an AUC score of 0.99, indicates that the XGBoost model is very good at making accurate predictions and can confidently distinguish between different categories (see figure 11).
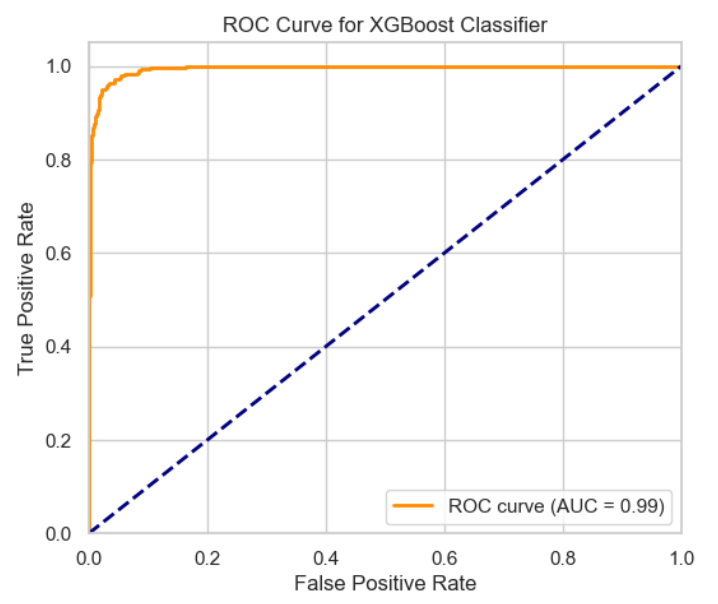
Figure 11. ROC curve for XGBoost classifier
5. Discussions
5.1. For the bank
5.1.1. Cost-effective marketing strategy. Preventing client attrition is a marketing approach that encompasses all facets of a bank's administration and operations in an increasingly competitive market. Preventing customer churn, exploring new markets, and developing new customers are all of significant importance. Reducing customer attrition is more economical from the standpoint of marketing plan effectiveness than bringing on new clients [12]. A long-term approach in the bank's customer relationship management, proactive churn prevention focuses on client retention and care to enhance customer engagement and stop them from becoming churn status. This project aims to provide recommendations for the bank to retain and care for its customers by analyzing the key factors influencing the customer churn model and combining them with previous descriptive analysis.
5.1.2. Recommendations for customer retention and care. In terms of target audience segmentation, targeting specific customer segments helps the bank develop tailored strategies and provide customized products and services, enhancing its competitiveness. For example, ICBC focuses on the middle-income class, Agricultural Bank of China targets rural and agricultural sectors, and Bank of China leans towards high-end customers and large enterprises. Therefore, it is necessary for the bank to define its target customer groups [13]. In terms of user care strategies, implementing care and incentive strategies for retaining existing customers is crucial. For customers who have been using the bank's products for a long time, the bank can introduce activities such as membership reward programs, priority services, and gratitude initiatives to make customers feel valued. For new customers, various promotional activities can be launched to attract their usage, such as discount collaborations with government and business partners. Simultaneously, motivating new customers to transition into loyal customers can be achieved through membership reward programs. In terms of high credit rating incentive system, another significant component in predicting customer attrition is credit scores. The bank may implement a number of credit card incentive plans in order to keep customers with excellent credit ratings. This strategy encourages other high-credit-rating clients who haven't applied for a credit card to do so in order to retain more of the current pool of highly qualified applicants.
5.2. For the future work
One kind of boosting algorithm is called XGBoost. In order to create a strong classifier, boosting algorithms combine several weak classifiers. Because XGBoost is a boosting tree model, it builds a potent classifier by combining several tree models. XGBoost specifically uses CART regression tree models as its tree models [14]. The algorithmic idea behind XGBoost is to create a tree by separating features and continually adding trees. With each addition, a tree learns a new function to suit the residual from the prior forecast. After training and getting k trees, the first step in predicting the score for a sample is to find the associated leaf node in each tree based on the attributes of the sample. Every leaf node is given a score, and the final prediction for the sample is determined by adding the scores from every tree. Therefore, XGBoost is a boosting algorithm that integrates multiple tree models, particularly CART regression trees, to create a strong classifier. The algorithm continuously adds trees, performs feature splits, and learns new functions to fit residual errors, ultimately providing predictions by combining the scores from each tree. XGBoost has several advantages: high accuracy, fast execution, high scalability and over-fitting prevention. Applying this model to deal with similar data set can predict for the bank.
Future research is required to create a more reliable, accurate, quick, straightforward, and effective churn prediction model by better understanding the interactions between factors and how they affect the outcomes. Larger datasets and more variables will be used in these investigations in order to identify the most crucial ones. To find the best models, further machine learning models will be used. It is important to remember that applying conventional machine learning models does not necessarily provide the best outcomes for a particular dataset. Consequently, future initiatives have to concentrate on raising the prediction models' level of precision and effectiveness.
6. Conclusion
Banks are experiencing a loss of credit card customers. Consequently, the goal is to help the bank manager by using a dataset that was downloaded from the Kaggle website to proactively identify clients who are prone to churn and then make the necessary modifications. Nine different classifiers were used in this work to construct a churn prediction model for credit card customers: AdaBoost, Gradient Boosting, XGBoost, Naive Bayes, Decision Tree, Random Forest, K-Nearest Neighbors, Support Vector Classifier, and Logistic Regression. The findings show that every model used could forecast credit card client attrition. With the greatest F1 score of 92%, test accuracy of 97%, and training accuracy of 100%, the XGBoost model outperformed the others. Therefore, it can be concluded that this model can be applied to relevant datasets to predict customer churn and assist banks in improving customer retention.
References
[1]. Amuda, K.A.; Adeyemo, A.B. Customers churn prediction in financial institution using artificial neural network. 2019.
[2]. Lin Xiangyang. Mobile large customer churn analysis based on data mining. Beijing, Tsinghua University, 2008.
[3]. Xia, G.; He, Q. The research of online shopping customer churn prediction based on integrated learning. In Proceedings of the 2018 International Conference on Mechanical, Electronic, Control and Automation Engineering (MECAE 2018), Qingdao, China, 2018: 30-31.
[4]. AL-Najjar, D.; Al-Rousan, N.; AL-Najjar, H. Machine Learning to Develop Credit Card Customer Churn Prediction. J. Theor. Appl. Electron. Commer. Res. 2022, 17: 1529-1542.
[5]. Yaya Xie, Xiu Li, E.W.T. Ngai, Weiyun Ying, Customer churn prediction using improved balanced random forests, Expert Systems with Applications, 2009, 36, (1):5445-5449.
[6]. Essam Shaaban, Yehia Helmy, Ayman Khedr, Mona Nasr / International Journal of Engineering Research and Applications (IJERA), 2012, 2(4):693-697.
[7]. N. Lu, H. Lin, J. Lu and G. Zhang, "A Customer Churn Prediction Model in Telecom Industry Using Boosting," in IEEE Transactions on Industrial Informatics, 2014, 10(2):1659-1665.
[8]. Guo-en XIA, Wei-dong JIN, Model of Customer Churn Prediction on Support Vector Machine, Systems Engineering - Theory & Practice, 2008, 28(1): 71-77.
[9]. Zhang Lin. Big data statistical analysis methods in Analysis of application in the field of economic management. Marketing World,2019, (38):291-292.
[10]. Han H, Wang W Y, Mao B H. Borderline-SMOTE: A New Over-Sampling Method in Imbalanced Data Sets Learning// International Conference on Advances in Intelligent Computing. Springer - Verlag, 2005:878-887
[11]. Zhang Run, Wang Yongbin. Machine learning and its algorithm and development research. Journal of Communication University of China (Natural Science Edition), 2016, 23(2).
[12]. Cao Yukun, Zhu Meng, WANG Xiaofei. Fan blade icing prediction based on feature selection and XGBoost . Electrical Automation, 2019, 41 (3): 31-33
[13]. Han Gang, Li Wenrui. Research on project management innovation under the background of Big Data. Economic Issues,2021(01):81-86.
[14]. Li Yushuang, Wang Chunfeng. Application of recursive classification tree in credit risk analysis. Systems Engineering Theory and Practice, 2000(3): 50-55.
Cite this article
Chen,Y. (2024). Credit card customers churn prediction by nine classifiers. Applied and Computational Engineering,48,237-247.
Data availability
The datasets used and/or analyzed during the current study will be available from the authors upon reasonable request.
Disclaimer/Publisher's Note
The statements, opinions and data contained in all publications are solely those of the individual author(s) and contributor(s) and not of EWA Publishing and/or the editor(s). EWA Publishing and/or the editor(s) disclaim responsibility for any injury to people or property resulting from any ideas, methods, instructions or products referred to in the content.
About volume
Volume title: Proceedings of the 4th International Conference on Signal Processing and Machine Learning
© 2024 by the author(s). Licensee EWA Publishing, Oxford, UK. This article is an open access article distributed under the terms and
conditions of the Creative Commons Attribution (CC BY) license. Authors who
publish this series agree to the following terms:
1. Authors retain copyright and grant the series right of first publication with the work simultaneously licensed under a Creative Commons
Attribution License that allows others to share the work with an acknowledgment of the work's authorship and initial publication in this
series.
2. Authors are able to enter into separate, additional contractual arrangements for the non-exclusive distribution of the series's published
version of the work (e.g., post it to an institutional repository or publish it in a book), with an acknowledgment of its initial
publication in this series.
3. Authors are permitted and encouraged to post their work online (e.g., in institutional repositories or on their website) prior to and
during the submission process, as it can lead to productive exchanges, as well as earlier and greater citation of published work (See
Open access policy for details).
References
[1]. Amuda, K.A.; Adeyemo, A.B. Customers churn prediction in financial institution using artificial neural network. 2019.
[2]. Lin Xiangyang. Mobile large customer churn analysis based on data mining. Beijing, Tsinghua University, 2008.
[3]. Xia, G.; He, Q. The research of online shopping customer churn prediction based on integrated learning. In Proceedings of the 2018 International Conference on Mechanical, Electronic, Control and Automation Engineering (MECAE 2018), Qingdao, China, 2018: 30-31.
[4]. AL-Najjar, D.; Al-Rousan, N.; AL-Najjar, H. Machine Learning to Develop Credit Card Customer Churn Prediction. J. Theor. Appl. Electron. Commer. Res. 2022, 17: 1529-1542.
[5]. Yaya Xie, Xiu Li, E.W.T. Ngai, Weiyun Ying, Customer churn prediction using improved balanced random forests, Expert Systems with Applications, 2009, 36, (1):5445-5449.
[6]. Essam Shaaban, Yehia Helmy, Ayman Khedr, Mona Nasr / International Journal of Engineering Research and Applications (IJERA), 2012, 2(4):693-697.
[7]. N. Lu, H. Lin, J. Lu and G. Zhang, "A Customer Churn Prediction Model in Telecom Industry Using Boosting," in IEEE Transactions on Industrial Informatics, 2014, 10(2):1659-1665.
[8]. Guo-en XIA, Wei-dong JIN, Model of Customer Churn Prediction on Support Vector Machine, Systems Engineering - Theory & Practice, 2008, 28(1): 71-77.
[9]. Zhang Lin. Big data statistical analysis methods in Analysis of application in the field of economic management. Marketing World,2019, (38):291-292.
[10]. Han H, Wang W Y, Mao B H. Borderline-SMOTE: A New Over-Sampling Method in Imbalanced Data Sets Learning// International Conference on Advances in Intelligent Computing. Springer - Verlag, 2005:878-887
[11]. Zhang Run, Wang Yongbin. Machine learning and its algorithm and development research. Journal of Communication University of China (Natural Science Edition), 2016, 23(2).
[12]. Cao Yukun, Zhu Meng, WANG Xiaofei. Fan blade icing prediction based on feature selection and XGBoost . Electrical Automation, 2019, 41 (3): 31-33
[13]. Han Gang, Li Wenrui. Research on project management innovation under the background of Big Data. Economic Issues,2021(01):81-86.
[14]. Li Yushuang, Wang Chunfeng. Application of recursive classification tree in credit risk analysis. Systems Engineering Theory and Practice, 2000(3): 50-55.