


1. Introduction
The evolution of online banking systems considerately provides great help to people’s life, allowing users to conduct payments, transfers, and other business more safely and conveniently without leaving their homes. At the same time, online payment services are heavily used by the financial companies, which result in more and more online payment fraud, which seriously violated both on financial services and the cardholders’ benefit. Especially for companies who rely heavily on online payments, payment fraud is a very important part of the whole risk control system and may have a normal operation of business.
In study 0, the author summarized ten types of credit card frauds. Above all these credit card fraud types, lost and stolen card fraud may be the most common way. In most online transactions, once the fraudsters got the card number, expiry date and cvv number, this transaction can be finished 0.And for offline transactions, the physical card must be presented 0. In these cases, the cardholders even don’t know their cards, or their information was leaked. To sum up, a good way to identify the fraudulent transactions is to find the special characteristics of the clients or the credit card by using the known data 0 .
In this paper, we attempted to find an effective way to identify the fraudulent transactions from a huge transaction dataset using machine learning techniques. This paper will be written as follows: The following part is related work and methodology, including the description of the models and methods, and the third part includes the description of the dataset and analysis of the result. The final part is the conclusion and the future work.
2. Related Work
Until now, many researchers already have done a lot of work on detecting the fraud transactions.
In0, this paper applies five different types of machine learning models (Decision Tree, Gradient Boosting Classifier, Random Forest, Logistic Regression and SVM) in the dataset and using AUC, precision, recall, accuracy and F1-score to evaluate the model prediction result.
In 0, this paper apply a deep learning model to detect the fraud transaction, and focus more on the feature engineering, creating new features that can help the model to have a better understanding of the payment habits of the cardholder, and improves the prediction result of the model.
In 0, this research work focuses more attention on the data analysis and feature engineering, and then using both machine learning techniques and neural network models to detect fraud efficiency. And researchers finally got 99.95% accuracy by Random Forest Classifier.
In 0, researchers make their effort on carrying out different sampling techniques to overcome the imbalanced problem and find that random oversampling can give the best result.
Except for using normal clustering method to detect fraud transactions, some papers also focus on the outlier detection method, such as in 00. In 0, researchers use the Local Outlier Factor model with logistic regression to detect the fraud transactions. And this study 0 focuses on to detect the outlier, which represents the fraudulent transactions, based on distance sum.
3. Methods
This study constructed the fraud detection system based on machine learning techniques. And the steps of training models are as figure 1.
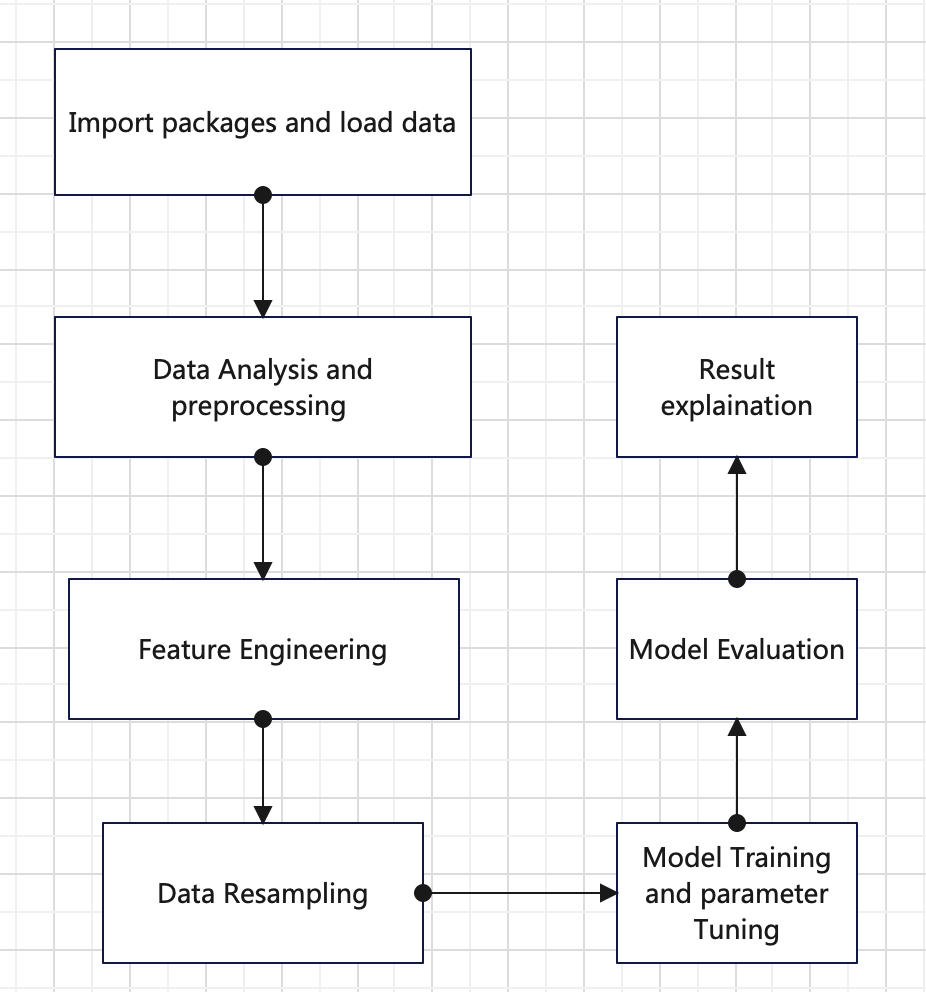
Figure 1. Steps of training models
3.1. Imbalanced data set processing
Imbalanced data typically refer to a classification problem where the classes are not represented equally. In this dataset, Failure to account for the class imbalance often causes inaccurate and decreases predictive performance of many classification algorithms. This dataset presents 20663 fraud transactions out of 590540 transactions, accounting for 3.5% of all transactions, which represents a highly imbalanced problem.
For many classification algorithms, due to the presence of imbalanced data, the classifier can achieve an accuracy of nearly 100% for positive cases and only 0-10% for negative cases. Therefore, we need to eliminate the impact of this imbalance.
There are several approaches to solving class imbalance problem before starting classification: random resampling, SMOTE (Synthetic Minority Oversampling Technique), under-sampling with Tomek Links, combining SMOTE and Tomek Links. we can try all the ways to see which gives the best result.
3.2. Machine Learning Techniques
After the data preprocessing and data transformation, the model will be trained using Random Forest and XGBoost.
1)Random Forest can be employed to deal with multi-class classification problem, which consisting of sufficient decision trees. At first, it can generate many training sets using bootstrap method. There is a decision tree constructed using the data from each training set. In order to avoid overfitting, the random forest method samples both samples and features. After constructing many decisions tree separately, we can adopt the principal of majority subordinate to minority to get the final classification.
2)Extreme Gradient Boosting(xgboost) is a tree boosting system, which can be employed to deal with both classification and regression problems. As an advanced gradient boosting algorithm, widely used in many data mining challenges, this method has obvious advantages: parallelize, reducing overfitting, making it much faster, and increasing performance. It contains multiple sequential CART trees, and its objective function is:
\( obj(θ)=\sum _{i=1}^{n} L({y_{i}},∧{y_{i}})+\sum _{k=1}^{K} Ω({f_{k}}) \) (1)
where \( Ω(f)=γT+\frac{1}{2}λ∥w{∥^{2}} \) , function L is the loss function which is used to evaluate the degree of error between the predicted results of the model and the actual results. The loss function provides a way to measure model performance. The hyperparameters of the term \( Ω \) can control the punishment intensity and the function of the regularization term is to prevent overfitting and reduce the complexity of the tree0.
3.3. C. model evaluation
For this dataset is highly imbalanced, so we can’t only use accuracy score as a metric, which can always be high and misleading, instead using f1-score, accuracy, Recall rate, AUC.
• Accuracy: the percentage of the number of perfect classified samples to the whole sample.
\( Accuracy=\frac{TP+TN}{TP+TN+FP+FN} \) (2)
• Recall: the probability of the predicted result is positive in the actual result is positive.
\( Recall=\frac{TP}{TP+FN} \) (3)
• Precision: the probability of the actual result is positive in the predicted result is positive.
\( Precision=\frac{TP}{TP+FP} \) (4)
• F1-Score: the combination of precision and recall. The higher the F1-score, the more robust the classification model is.
\( F1=\frac{2×precision×recall}{precision+recall} \) (5)
Here,
TP (True Positive): Number of samples which is perfectly classified as positive.
FP (False Positive): Number of negative samples was mistakenly classified as positive.
FN (False Negative): Number of positive samples was mistakenly classified as negative.
TN (True Negative): Number of samples which is perfectly classified as negative.
4. Empirical Data analysis
4.1. Data source and description
This experimental data is from Kaggle. This dataset presents 20663 fraud transactions out of 590540 transactions, accounting for 3.5% of all transactions. From above, we can see that this dataset is unbalanced. Each record has 432 features, including 50 categorical variables and 382 numerical input variables.
The samples in the dataset are separated into two parts according to the time, the train dataset: the test dataset=8:2.
For most of the features in this dataset, the actual meaning is masked, and it is not possible to perform a comprehensive feature study or pre-analysis on the e-commerce transaction dataset.
In this dataset, we combine some features to identify clients, such as using card1+addr1+D1 to represent one client. If we use card1+addr1+D1 to represent one client, this dataset has 83557 clients or credit cards with 2 or more transactions. As can be shown in Figure 2,80841(96.7%) are always normal (isFraud=0) and 1487(1.8%) are always Fraud (isFraud=1). Only 1232(1.5%) have a mixture of isFraud=0 and isFraud=1, which proves that this new feature surely an effective feature to distinguish the fraud one and normal ones.
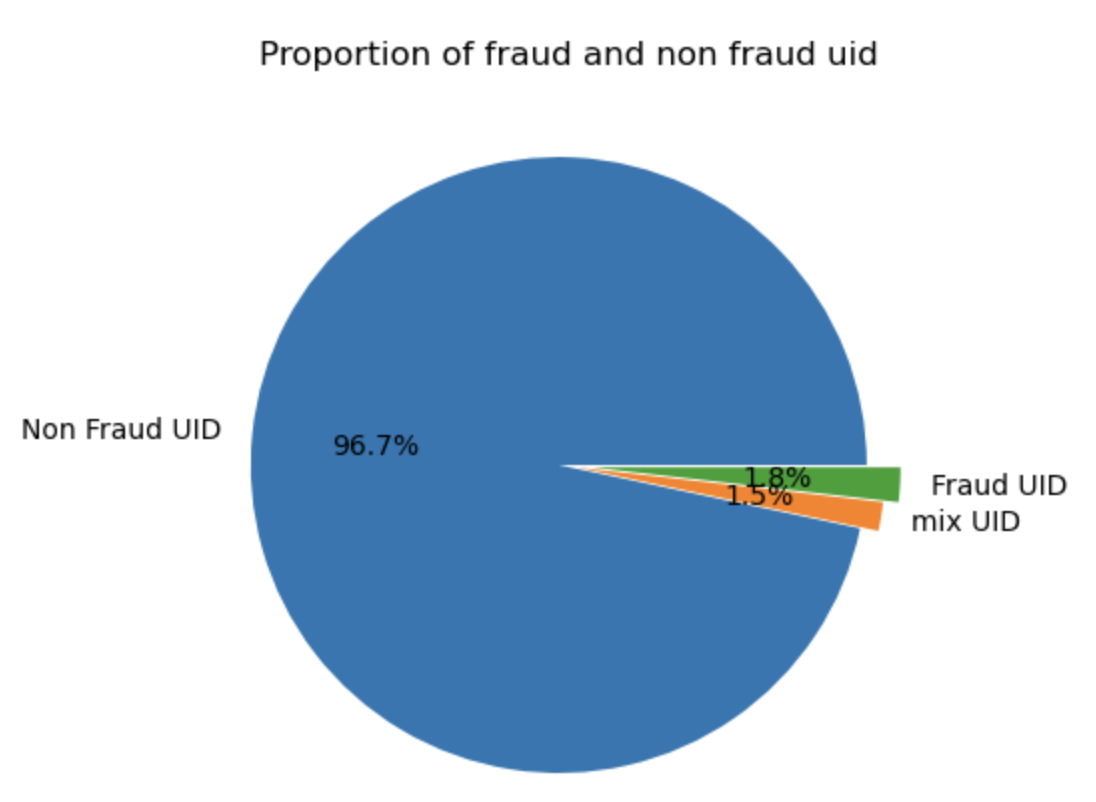
Figure 2. Proportion of Fraud and non-Fraud clients
The distribution of transaction amount and log of transaction amount is shown in Figure 3. From the Figure 3, we can find that the distribution of transaction amount is highly skewed. So, we introduce the log transformation to transaction amount to better view the distribution. After applying log-transformation, the fraud and non-fraud amount becomes normal distribution. Moreover, most of the fraudulent amount are generally lower than the non-fraudulent amount. 85% of the transaction amount is less than 200 USD dollars.
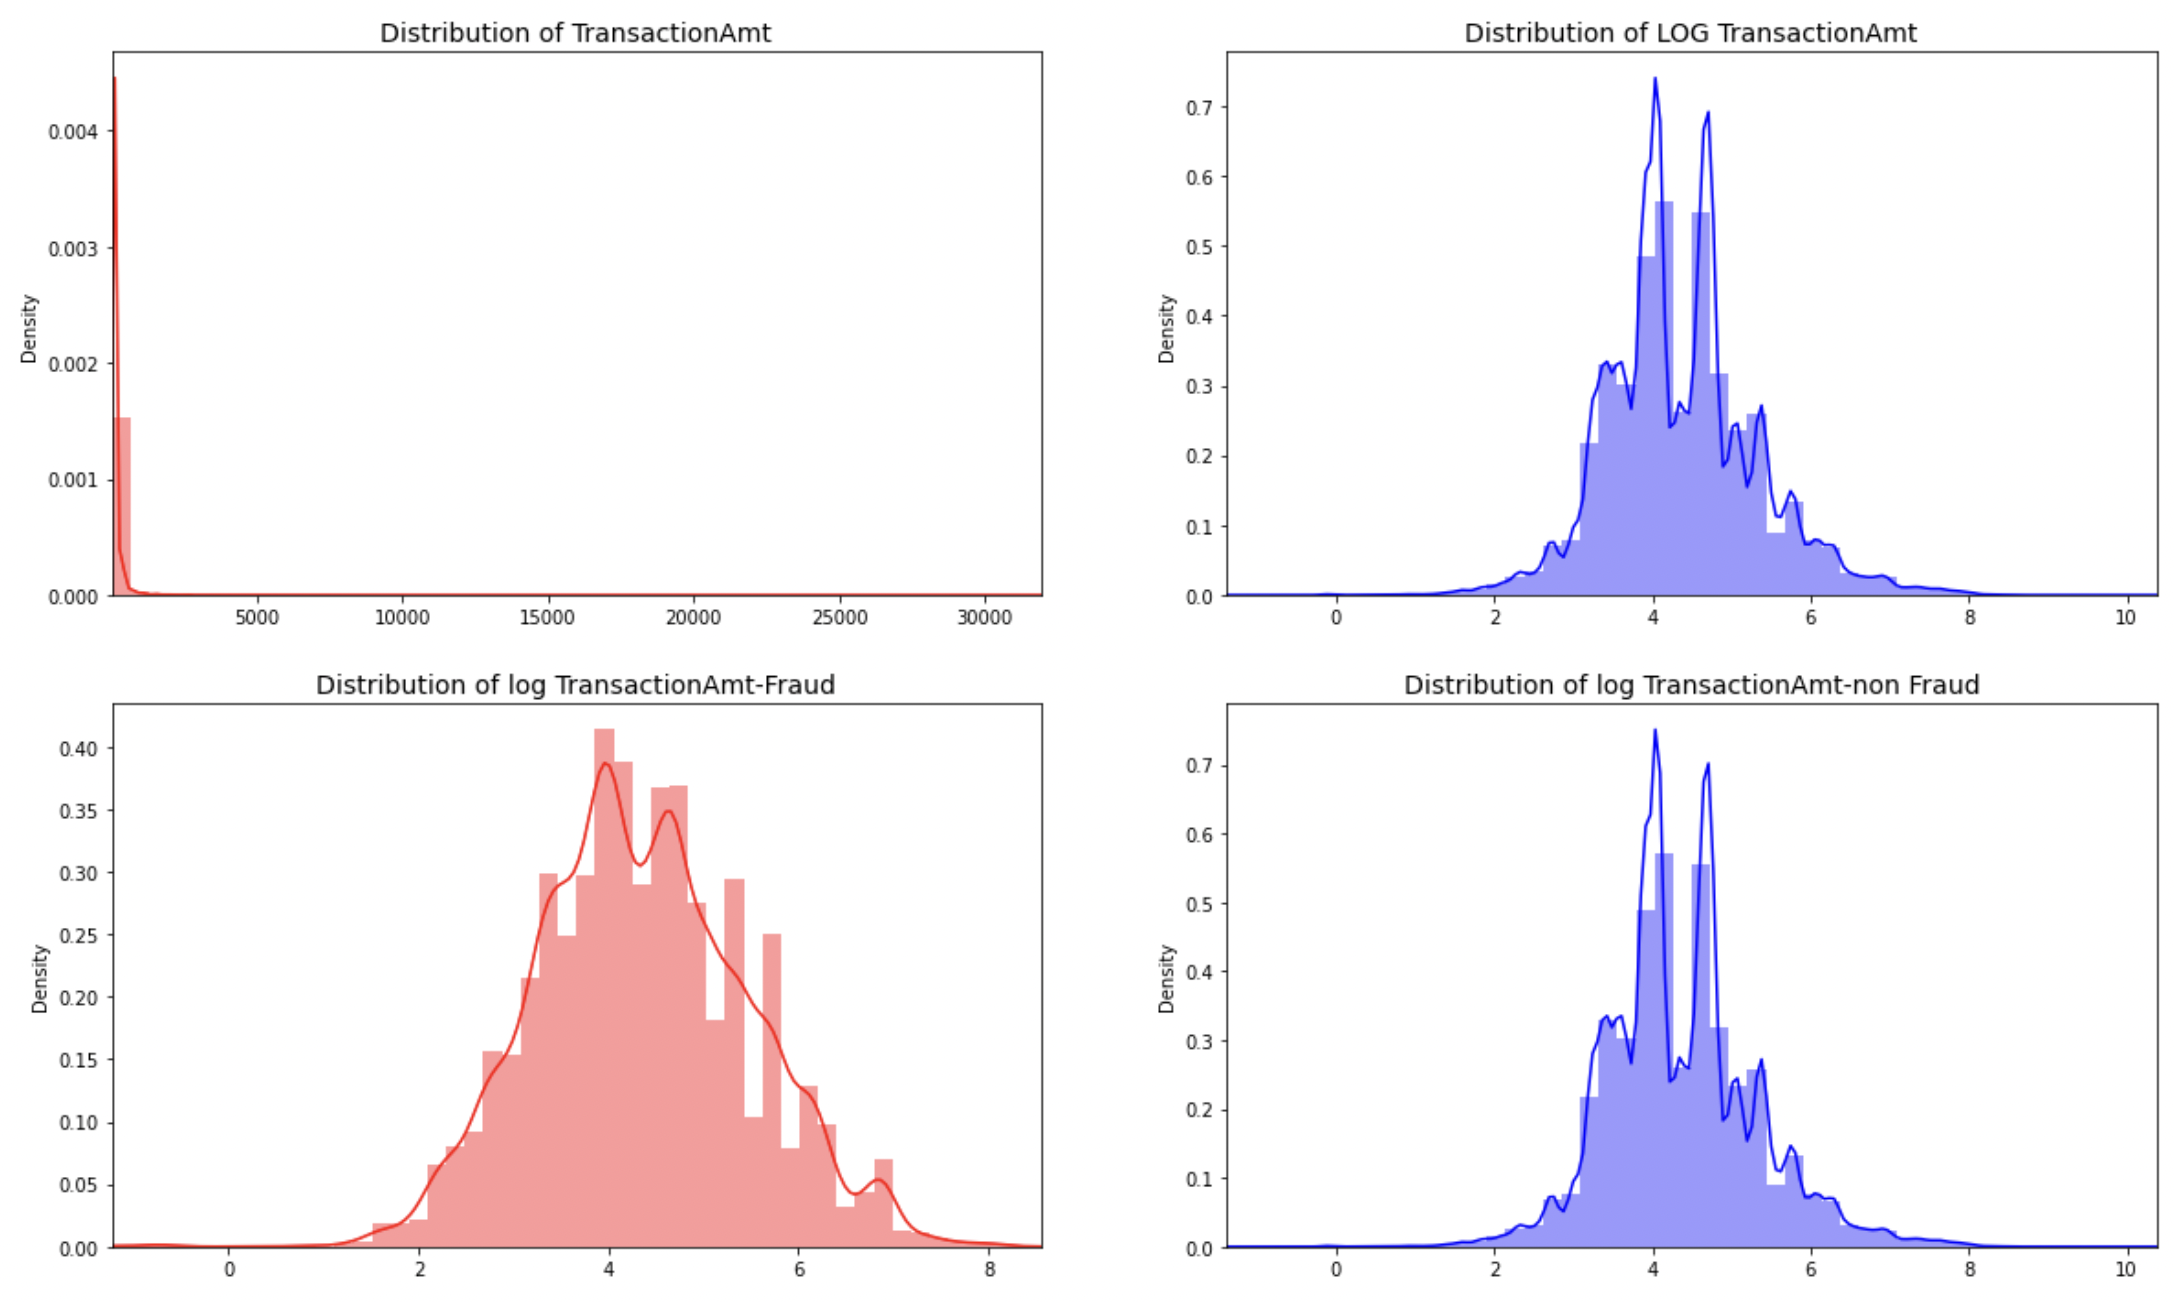
Figure 3. The distribution of Transaction amount and log transaction
The distribution of transaction card type is shown in Figure 4. We can find that about 75% of the transactions are from debit card and 25% of the transactions are from credit card. About half of the fraudulent transactions are from credit card. Intuitively, fraudulent transactions are more likely to happen in credit card transactions.
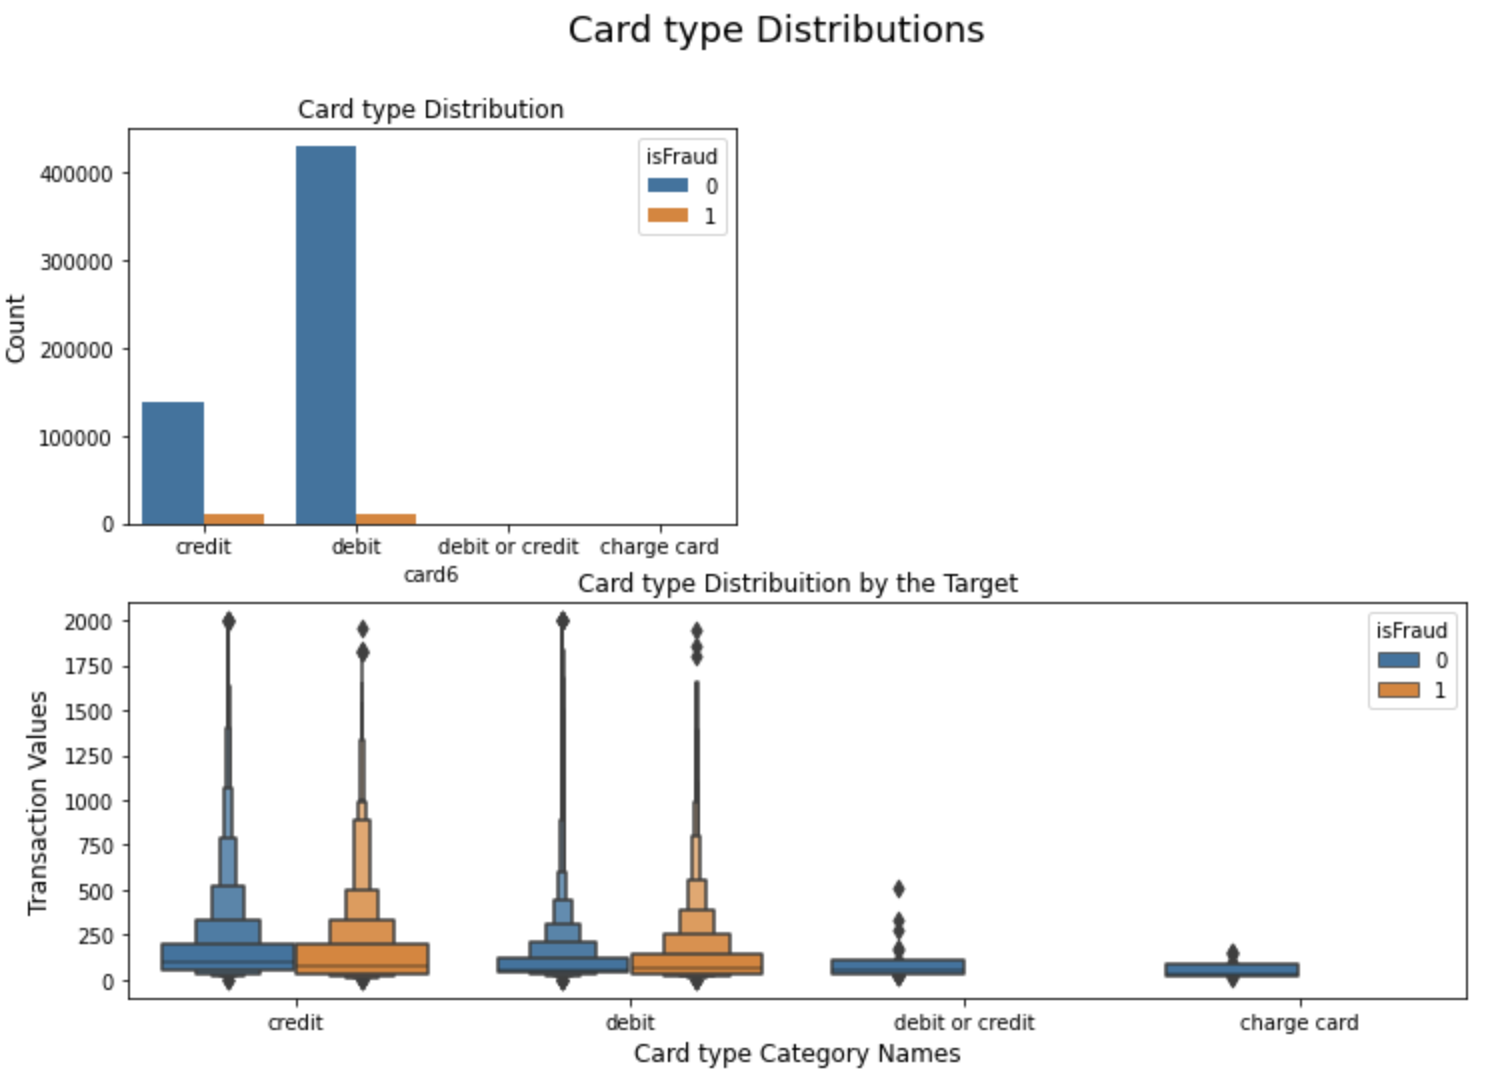
Figure 4. The distribution of card type
In this dataset, we have 339 features of V columns, from V1 to V339, which presents correlated and redundant. We find that there are shared NAN structures in this dataset, and for each block of V columns with shared missing value structure, there are some highly correlated columns. Table1 presents the eleven groups that have the same NAN structures and Figure 5 presents the heat map of correlation of the subsets in Group1.
According to these findings, we can reduce the number of V columns using the following 2 methods: (1) applying PCA on each group individually;(2) selecting a maximum sized subset of uncorrelated columns from each group to represent each block without losing that much information. For example, from figure 4, we can see that in the block V1-V11, we can choose [V1,V3,V4,V6,V8,V11] to represent the V1-V11 block.
After using these two methods, we can reduce 339 features to 139 columns, including 11 features from PCA and 128 features from uncorrelated columns.
Table 1. Group of V columns
Group | feature | Missing rate |
Group1 | V1-V11 | 47.3% |
Group2 | V12-V34 | 12.9% |
Group3 | V35-V52 | 28.6% |
Group4 | V53-V74 | 13.1% |
Group5 | V75-V94 | 15.1% |
Group6 | V95-V137 | 0.05% |
Group7 | V138-V166 | 86.1% |
Group8 | V167-V216 | 76.4% |
Group9 | V217-V278 | 78% |
Group10 | V279-V321 | 0.2% |
Group11 | V322-V339 | 86.1% |
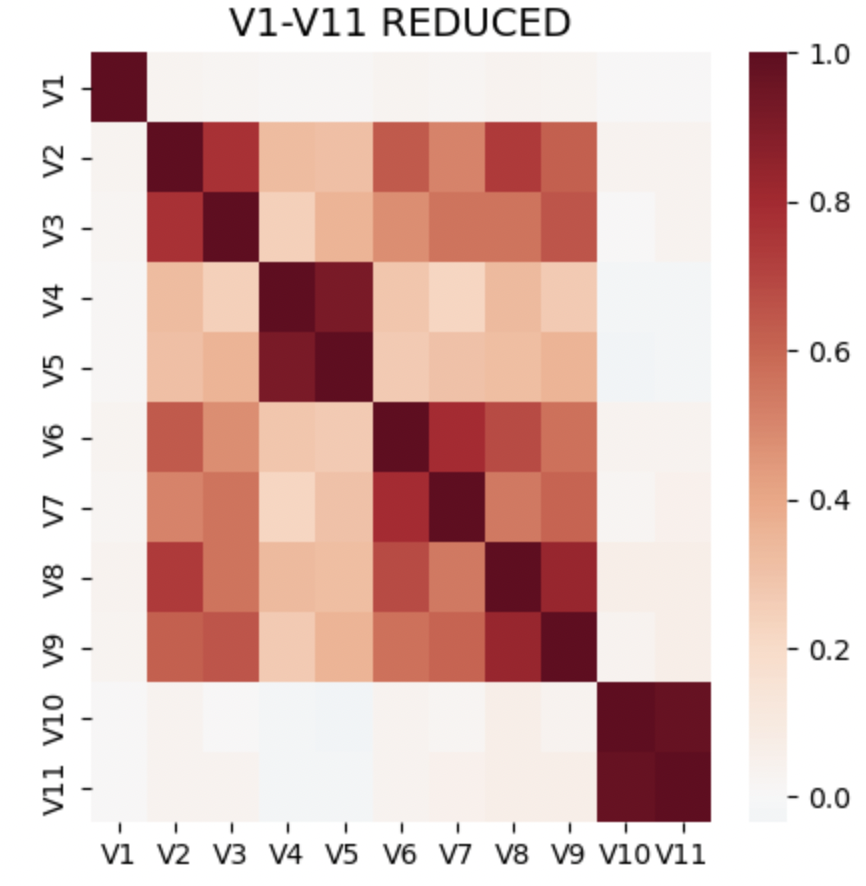
Figure 5. correlation matrix of Group1(V1-V11)
Figure 6 displays the distribution of feature ProductCD. According to the data provider, the feature ProductCD represents the product code for each transaction, and the real meaning is masked. From the Figure 6, we know that ‘W’is the most frequent value, followed by C and R, and the percentage of fraud in product C is highest followed by S and H, which means that fraud transactions are more likely happened in product C.
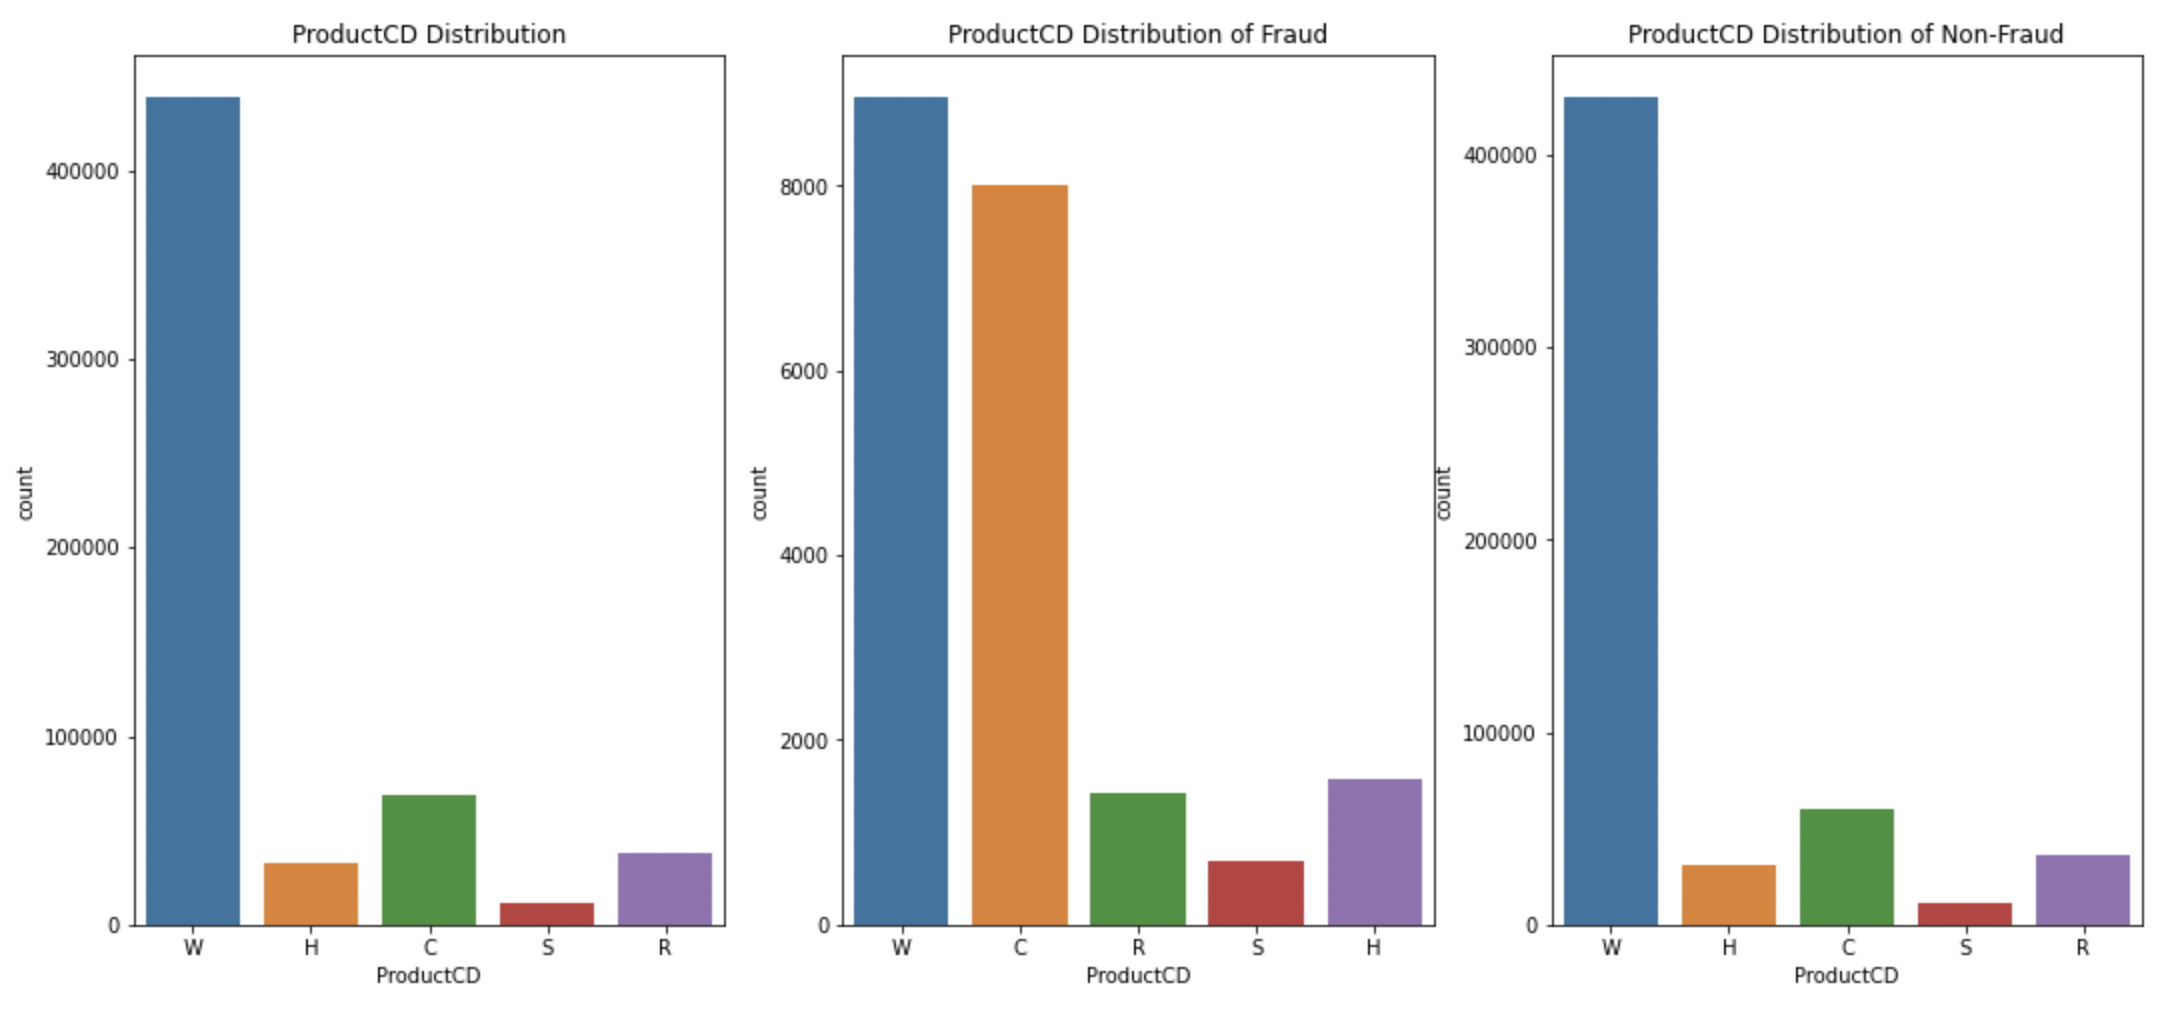
Figure 6. the distribution of ProductCD
4.2. Feature engineering and feature selection
Feature engineering is very important for building a well-preprocessed machine learning model, and well-preprocessed work in this part, can improve the model performance.
At first, after finding that: (1) Missing rate in approximately 49.5% of features is 50%; (2) Missing rate in approximately 17% of the features is 80%; (3) approximately 95% of the features contains missing values, we fill in Nan values using np.nan. Then splitting some single (usually string)features into two columns, such as a string column “id_30” which can be split into two columns, Operating system and version; At the same time, we make a combination of two or more columns into one column to identify clients or credit cards, such as card1, addr1 and D1 can be become a new column to identify one specific card. Next, applying PCA to reduce the dimensionality of V1-V339, reducing V columns from 339 to 11. Finally, applying one-hot encoding, frequency encoding and label encoding to categorical features.
Feature selection is a very important step, and can help to minimize the number of features, enhance model effect and speed up the whole process. There are many ways to do the feature selection, including forward feature selection, recursive feature selection. In this paper, we apply XGBOOST model on the total features to gain the most effective features.
4.3. Performance Evaluation and Discussions
First, we use two commonly used machine learning models to do a comparison, Random Forest and XGBOOST, where the models use only the variables that from normal transformations. Next, adding the variables which can identify specific clients or credit cards to the models. Finally, evaluating the model performance using AUC,accuracy rate, recall score and F1 score, as shown in Table 2.
Table 2. The Comparison of RF and XGBOOST
Model | AUC | Accuracy rate | F1 score | Recall rate |
Random Forest(transactiong-based feature) | 0.6629 | 0.9726 | 0.4530 | 0.3303 |
Random Forest(transaction-based feature+user-based feature) | 0.6645 | 0.9728 | 0.4573 | 0.3334 |
Xgboost(transaction-based feature) | 0.9263 | 0.9687 | 0.5495 | 0.5553 |
Xgboost(transaction-based features+user-based feature) | 0.9354 | 0.9702 | 0.5754 | 0.5884 |
As can be seen from Table 2, we can conclude that:(1) the performance of XGBOOST is much better than Random Forest, which the auc of XGBOOST is about 40 percentage points higher than the auc of RF; (2) Due to high accuracy rate and low auc score in Random Forest, the imbalanced problem is still serious; (3) the performance of adding variables which can identify clients or credit card in the models are better than the performance without adding these variables in AUC, accuracy rate, F1-score and Recall rate. Therefore, we are not predicting fraudulent transactions, but the fraudulent clients or credit card. Or to put it further, we are looking for fraudulent clients and fraudulent groups.
4.4. Discussion
Based on the experimental results mentioned above, we conducted a brief analysis:
1) The superior performance of XGBOOST over Random Forest may be attributed to XGBOOST's stronger ensemble learning capability and optimization algorithm, enabling better handling of complex nonlinear relationships and high-dimensional data. It demonstrates greater flexibility and accuracy in constructing decision trees and performing feature selection, resulting in a higher predictive accuracy for the final model.
2) The relatively high accuracy but low AUC score of Random Forest may be due to the issue of data imbalance. In fraud detection tasks, the number of normal transactions far exceeds that of fraudulent transactions, leading to class imbalance during model training. Random Forest may exhibit relatively poorer identification of minority classes, contributing to the lower AUC score.
3) The inclusion of variables that can identify clients or credit cards may enhance model performance by providing additional information about fraudulent activities. For instance, fraudulent clients may exhibit specific behavioral patterns or use particular credit cards, and incorporating this information into the model can improve the identification of fraudulent activities and enhance the performance of various evaluation metrics.
In summary, XGBOOST possesses advantages in handling nonlinear relationships and high-dimensional data, while Random Forest may be impacted by the issue of data imbalance. Additionally, the inclusion of variables that can identify clients or credit cards can offer crucial information about fraudulent activities, thereby improving model performance.
5. Conclusion
With the development of online banking system and the popularization of e-commerce, more and more fraudulent transactions are generated, and a necessary fraud detection system is needed. In this paper, we have implemented Random Forest and XGBOOST for detecting these frauds. When comparing F1-score, auc score and recall rate for 2 models, XGBOOST performed much better than the Random Forest. At the same time, the performance of XGBOOST with variables which can identify clients or credit card improves 0.1%, from 0.9263 to 0.9354. So overall XGBOOST performed much better in determining the fraud cases, and identifying clients or credit cards can help us to make the prediction better.
As can be seen from the model results, there are still some problems exists. First, the imbalanced problem still exists, and we can still find a better solution to this problem; Next, the feature engineering is not fully done, and we can still find more variables that can identify clients and credit card; Finally, except for machine learning models, we can still try to use deep learning model to see whether there are some progresses in detecting the fraud transactions.
References
[1]. Yashvi Jain, Namrata Tiwari, Shripriya Dubey and Sarika Jain, A Comparative Analysis of Various Credit Card Fraud Detection Techniques, Blue Eyes Intelligence Engineering and Sciences Publications, 2019.
[2]. D. Tanouz, R. R. Subramanian, D. Eswar, G. V. P. Reddy, A. R. Kumar and C. V. N. M. Praneeth, "Credit Card Fraud Detection Using Machine Learning," 2021 5th International Conference on Intelligent Computing and Control Systems (ICICCS), Madurai, India, 2021, pp. 967-972, doi: 10.1109/ICICCS51141.2021.9432308.
[3]. Fayyomi, Aisha & Eleyan, Derar & Eleyan, Amina. (2021). A Survey Paper On Credit Card Fraud Detection Techniques. International Journal of Scientific & Technology Research. 10. 72-79.
[4]. P. Y. Prasad, A. S. Chowdary, C. Bavitha, E. Mounisha and C. Reethika, "A Comparison Study of Fraud Detection in Usage of Credit Cards using Machine Learning," 2023 7th International Conference on Trends in Electronics and Informatics (ICOEI), Tirunelveli, India, 2023, pp. 1204-1209, doi: 10.1109/ICOEI56765.2023.10125838.
[5]. E. Bayhan, A. G. Yavuz, M. A. Güvensan and M. E. Karsligıl, "The Effect of Feature Selection on Credit Card Fraud Detection Success," 2021 29th Signal Processing and Communications Applications Conference (SIU), Istanbul, Turkey, 2021, pp. 1-4, doi: 10.1109/SIU53274.2021.9477812.
[6]. J. S. Kirar, D. Kumar, D. Chatterjee, P. S. Patel and S. Nath Yadav, "Exploratory Data Analysis for Credit Card Fraud Detection," 2021 International Conference on Computational Performance Evaluation (ComPE), Shillong, India, 2021, pp. 157-161, doi: 10.1109/ComPE53109.2021.9751922.
[7]. P. Gupta, A. Varshney, M. R. Khan, R. Ahmed, M. Shuaib and S. Alam, "Unbalanced credit card fraud detection data: A machine learning-oriented comparative study of balancing techniques", Procedia Computer Science, vol. 218, no. 1, pp. 2575-2584, 2023.
[8]. W. -F. Yu and N. Wang, "Research on Credit Card Fraud Detection Model Based on Distance Sum," 2009 International Joint Conference on Artificial Intelligence, Hainan, China, 2009, pp. 353-356, doi: 10.1109/JCAI.2009.146.
[9]. K. K, M. B, S. K, J. P. D and D. Sree Lakshmi, "Credit Card Fraud Identification Using Logistic Regression and Local Outlier Factor," 2022 Second International Conference on Interdisciplinary Cyber Physical Systems (ICPS), Chennai, India, 2022, pp. 99-103, doi: 10.1109/ICPS55917.2022.00026.
[10]. Chen T , Guestrin C .XGBoost: A Scalable Tree Boosting System[J].ACM, 2016.DOI:10.1145/2939672.2939785.
Cite this article
Zhang,J. (2024). Creating a credit card anti-fraud detection sytem using machine learning. Applied and Computational Engineering,47,269-277.
Data availability
The datasets used and/or analyzed during the current study will be available from the authors upon reasonable request.
Disclaimer/Publisher's Note
The statements, opinions and data contained in all publications are solely those of the individual author(s) and contributor(s) and not of EWA Publishing and/or the editor(s). EWA Publishing and/or the editor(s) disclaim responsibility for any injury to people or property resulting from any ideas, methods, instructions or products referred to in the content.
About volume
Volume title: Proceedings of the 4th International Conference on Signal Processing and Machine Learning
© 2024 by the author(s). Licensee EWA Publishing, Oxford, UK. This article is an open access article distributed under the terms and
conditions of the Creative Commons Attribution (CC BY) license. Authors who
publish this series agree to the following terms:
1. Authors retain copyright and grant the series right of first publication with the work simultaneously licensed under a Creative Commons
Attribution License that allows others to share the work with an acknowledgment of the work's authorship and initial publication in this
series.
2. Authors are able to enter into separate, additional contractual arrangements for the non-exclusive distribution of the series's published
version of the work (e.g., post it to an institutional repository or publish it in a book), with an acknowledgment of its initial
publication in this series.
3. Authors are permitted and encouraged to post their work online (e.g., in institutional repositories or on their website) prior to and
during the submission process, as it can lead to productive exchanges, as well as earlier and greater citation of published work (See
Open access policy for details).
References
[1]. Yashvi Jain, Namrata Tiwari, Shripriya Dubey and Sarika Jain, A Comparative Analysis of Various Credit Card Fraud Detection Techniques, Blue Eyes Intelligence Engineering and Sciences Publications, 2019.
[2]. D. Tanouz, R. R. Subramanian, D. Eswar, G. V. P. Reddy, A. R. Kumar and C. V. N. M. Praneeth, "Credit Card Fraud Detection Using Machine Learning," 2021 5th International Conference on Intelligent Computing and Control Systems (ICICCS), Madurai, India, 2021, pp. 967-972, doi: 10.1109/ICICCS51141.2021.9432308.
[3]. Fayyomi, Aisha & Eleyan, Derar & Eleyan, Amina. (2021). A Survey Paper On Credit Card Fraud Detection Techniques. International Journal of Scientific & Technology Research. 10. 72-79.
[4]. P. Y. Prasad, A. S. Chowdary, C. Bavitha, E. Mounisha and C. Reethika, "A Comparison Study of Fraud Detection in Usage of Credit Cards using Machine Learning," 2023 7th International Conference on Trends in Electronics and Informatics (ICOEI), Tirunelveli, India, 2023, pp. 1204-1209, doi: 10.1109/ICOEI56765.2023.10125838.
[5]. E. Bayhan, A. G. Yavuz, M. A. Güvensan and M. E. Karsligıl, "The Effect of Feature Selection on Credit Card Fraud Detection Success," 2021 29th Signal Processing and Communications Applications Conference (SIU), Istanbul, Turkey, 2021, pp. 1-4, doi: 10.1109/SIU53274.2021.9477812.
[6]. J. S. Kirar, D. Kumar, D. Chatterjee, P. S. Patel and S. Nath Yadav, "Exploratory Data Analysis for Credit Card Fraud Detection," 2021 International Conference on Computational Performance Evaluation (ComPE), Shillong, India, 2021, pp. 157-161, doi: 10.1109/ComPE53109.2021.9751922.
[7]. P. Gupta, A. Varshney, M. R. Khan, R. Ahmed, M. Shuaib and S. Alam, "Unbalanced credit card fraud detection data: A machine learning-oriented comparative study of balancing techniques", Procedia Computer Science, vol. 218, no. 1, pp. 2575-2584, 2023.
[8]. W. -F. Yu and N. Wang, "Research on Credit Card Fraud Detection Model Based on Distance Sum," 2009 International Joint Conference on Artificial Intelligence, Hainan, China, 2009, pp. 353-356, doi: 10.1109/JCAI.2009.146.
[9]. K. K, M. B, S. K, J. P. D and D. Sree Lakshmi, "Credit Card Fraud Identification Using Logistic Regression and Local Outlier Factor," 2022 Second International Conference on Interdisciplinary Cyber Physical Systems (ICPS), Chennai, India, 2022, pp. 99-103, doi: 10.1109/ICPS55917.2022.00026.
[10]. Chen T , Guestrin C .XGBoost: A Scalable Tree Boosting System[J].ACM, 2016.DOI:10.1145/2939672.2939785.