


1. Introduction
The stock market is an essential part of the modern financial system and a barometer of the economic development of countries. Fluctuations in stock prices reflect not only the market's expectations of companies but also the market's expectations of the overall economic environment. Therefore, forecasting stock prices helps investors, policymakers, and market regulators to make more informed decisions [1]. Early forecasting methods mainly include fundamental analysis and technical analysis. Fundamental analysis focuses on variables representing a company's financial condition, industry position, and market outlook to assess the investment value of a stock [2]. Technical analysis, on the other hand, is based on past stock price data and uses charts and indicators to predict future price movements. However, these methods have limitations in explaining stock price fluctuations. With advances in computer technology and statistical methods, modern stock price prediction models have gradually shifted to data-driven methods based on linear models, random forests, and LSTMs [3]. These models use of large amount of data and advanced algorithms to predict future stock prices with higher accuracy and interpretability [4]. In investment, accurate stock price forecasting can help people formulate more effective investment strategies, optimize asset allocation, and reduce risks. In risk management, stock price forecasting can help financial institutions assess and manage market risks [5].
With the increasing complexity and uncertainty in financial markets, the needs for stock price prediction are increasing. So, choosing an appropriate forecasting model is significant for investors and financial company. Despite the achievements of modern stock price prediction models, there are still many challenges and problems. For example, how to deal with highly nonlinear stock price fluctuations, and how to improve the generalization ability of the models. The solution to these problems can help further improve the accuracy and reliability of stock price prediction [6]. This thesis aims to provide investors and financial company with suggestions on stock price forecasting by deepening the understanding and exploration of the three models and comparing their principles, scope of application, strengths, weaknesses, and performance in stock price forecasting. It also provides me with a solid foundation in data modeling and in my future financial studies. Meanwhile, in the academic field, an in-depth study of forecasting models can deepen the understanding of each model, not only in the convenience of stock forecasting but also in various areas of financial orientation. Moreover, these models and conclusions will provide a research and theoretical basis for subsequent researchers.
This study is to comparing the performance of linear models, random forest and LSTM ( long short-term memory networks) in stock price prediction. First, these three models' basic principles and scope of application are introduced. The linear model is a simple and easy-to-understand prediction model for stock price prediction with linear relationships. Random forest is a machine learning model based on decision trees, which can handle complex nonlinear problems and yield more patterns and trends from data [6]. LSTM is a model based on recurrent neural networks, which sophisticates in handling sequential data and capturing long-term dependencies and has good results for stock market prediction [7]. After that, the thesis introduced the experimental design and data set selection. This thesis uses stock data from Yahoo.finance website as the research object, and the data includes stock price, trading volume, and other related financial indicators. In order to ensure data quality and consistency, stocks with complete data and no outliers were screened. Meanwhile, in order to comprehensively assess the effect of the model, mean square error (RMSE) is used as evaluation indexes [4]. In the experimental process, three models are used to model, train, and predict the data through Python and related functions and packages, and the prediction results are evaluated to analyze the performance and explore the advantages and disadvantages of each model. Conclusions are drawn by comparing and analyzing the prediction results and evaluation metrics of these three models. Finally, by comparing and analyzing the performance of the linear model, random forest, and LSTM in stock price prediction, the advantages and disadvantages of different models and their scope of application are discussed, and recommendations are made. Practitioners need to pay attention to the scope of application and limitations of different models and adjust and optimize them according to the actual situation.
Linear model, Random Forest, and LSTM are the common models used to predict stock prices, but there are some other models that have significant performance in predicting stock prices. Such as logistic regression model, recurrent neural network model, support vector machine model. Logistic regression is a standard linear regression model that predicts the occurrence of an event by linearizing the probabilistic relationship between the independent and dependent variables. Probabilistic logistic regression is a classification algorithm in which all dependent variables are separated into binary outcomes or 0/1 classification problems. it can generate output values, form model equations and accomplish prediction by providing the input data to a logistic function [8]. The logistic regression model equation is
P(X) = 1 / (1 + e-Z) (1)
where Z = β0 + β1X1 + … + βnXn. Here, P(X) is the probability of the predicted outcome, which is a value between 0 and 1. The more significant probability (usually 0.5) is used as a threshold for classification decisions. The main purpose is to minimize log loss in this regression. One can use maximum likelihood methods and gradient descent algorithms to determine the model parameters [9].
The data set must be pre-processed before taking the task, which can help determine the quality of the data and reduce the impact of outliers. The methods are standardization, normalization, missing value processing, and outlier detection. Training a logistic regression model is to get the model parameters and minimize the classification error based on the given training data. During the training, the data set is divided into training set and test set. The training set trains models to learn about the features of the data, and the test set is used to measure and estimate the accuracy and performance of the model. The evaluation for the models are accuracy, recall, precision, and F1 value. Accuracy is represented by the percentage of correctly classified samples over the total number of samples, and recall is the number of correctly labeled positive samples divided by the number of actual positive samples, while precision is the amount of correctly labeled positive samples divided by that of positively predicted samples, and the F1 value is the balanced value of precision and recall. Logistic regression has the advantages of simplicity, efficiency, and good interpretability and is one of the commonly used methods in predictive model design. However, relying only on the logistic regression model may not satisfy all the needs, and other models need to be used to achieve better classification results.
Support vector machine is a binary classification model based on statistical learning theory. Its basic principle is to map the data into a high-dimensional space, separate the sample points of different categories, and find an optimal solution to maximize the interval of the data set of the hyperplane to achieve the purpose of classification or regression [10]. Historical data related to stock prices are collected as data sources, including daily opening price, closing price, high price and low price. Then data cleaning and feature extraction are performed. Data cleaning mainly removes outliers and missing values, while feature extraction extracts features related to stock price from historical data, such as closing price and opening price [11]. In addition, it is also necessary to standardize the data and adjust the value ranges of different features to the same scale in order to improve the convergence speed and prediction accuracy of the model. When extracting features, it is necessary to consider which features are related to stock price movements. For example, the stock's trading volume, price-earnings ratio, and price-to-book ratio indicators are used as features. When selecting features, it is necessary to judge and screen them according to the actual situation. Selecting appropriate features can improve the predictive performance of the model. Before training the model, the dataset is divided into a training set and a test set. The training set is used to train the model, and the test set is used to evaluate the predictive performance of the model. For model training, the support vector machine algorithm is used to optimize the model's prediction performance by adjusting the model parameters (e.g., kernel function type, penalty coefficient C). To find the optimal model parameters, methods such as cross-validation are used for parameter optimization. Cross-validation obtains the results of predictive performance evaluation of multiple models by dividing the dataset into multiple subsets and using one of the subsets as a test set and the rest of the subsets as a training set each time. The final choice of model parameters should be the one that minimizes the prediction error.
The SVM-based stock price prediction model can achieve better prediction results, but the stock market is affected by a variety of factors, so it is necessary to consider a variety of factors to improve the prediction accuracy of the model in practical applications. The rest part is organized as follows. The Sec. 2 represents the design methodology of three models. The Sec. 3 represents the results and performance comparison of these models. The Sec. 4 represents the limitations and future work recommendations. The Sec. 5 represents the concluding remarks.
2. Data and method
This study used Python as the language for this model building. Python has excellent graphing capabilities and is easy to use for data processing, model training, and prediction. Python has many machine learning libraries such as sci-kit-learn, TensorFlow, and PyTorch, making it easy to build and train various machine learning models. For this assignment, this study used one of these PyTorch libraries to train and test neural network models. This study downloads IBM historical data from yahoo.finance website, including daily opening price, closing price, high price and low price. In order to improve the prediction accuracy of the model, this study pre-processed the data, including data cleaning and normalization. Data cleaning is mainly to remove outliers and missing values. Standardization is to adjust the range of values of different features to the same scale to improve the convergence speed and prediction accuracy of the model. and augment the dataset with technical indicators (moving averages, relative strength index, etc.). Finally, this study uses Python to read the data and process and divide the dataset into training and testing sets. The price is shown in Fig. 1
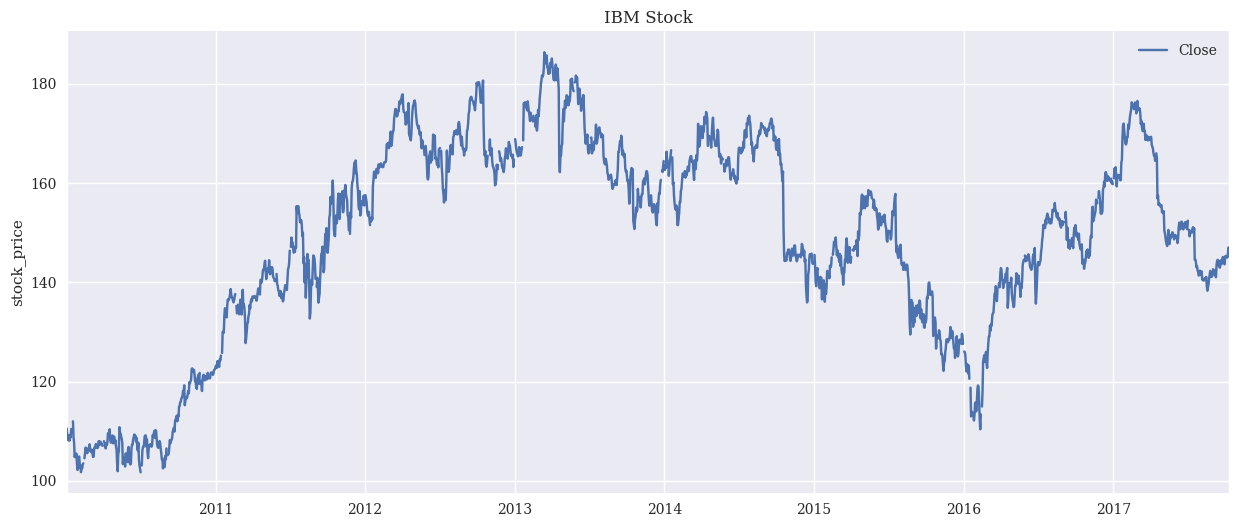
Figure 1. Read the history of IBM's stock price fire bureau (Photo/Picture credit: Original).
Linear modeling is a primary regression analysis method whose main purpose is to establish a linear relationship between the independent and dependent variables. The principle of linear modeling for stock prediction focuses on predicting future stock prices by establishing a linear relationship between the independent and dependent variables. The formula is as:
y = a + bx (2)
where, Y is predicted value or dependent variable, b is slope of the line, x is coefficient or independent variable, a=y-intercept. In this task, linear model uses historical stock price data as the independent variable and fits a best-fit straight line through statistical methods such as least squares to reduce the error between the observed and fitted values. This best-fit straight line is expressed as a combination of a slope, which represents the trend of stock price movements, and an intercept, which represents the specific value of the stock price at a given point in time. This study predicts future stock prices by finding the best-fit line. Specifically, this study gets a predicted value given a point in time by calculating the stock price corresponding to that point in time on a straight line. This predicted value can be used to guide investment decisions, such as buying or selling stocks. Random forest is a learning algorithm based on the decision tree algorithm, which is a tree structure and each internal node represents an attribute, each branch represents a value of this attribute, and each leaf node represents a classification or regression result. With a decision tree, one can divide a dataset into subsets, each containing data with the same feature or attribute. One can then analyse each subset and classify or regress it. In the field of stock prediction, the Random Forest algorithm can handle multi-dimensional features and can take into account the correlation between different features. By training multiple decision trees, Random Forest can reduce the overfitting risk of a single decision tree and improve the accuracy and stability of predictions. The prediction process of Random Forest consists of two phases: the training phase and the prediction phase. In the training phase, the random forest is trained using historical stock data as input features to generate a series of decision trees. In the prediction phase, new stock data is input into the trained Random Forest model, and each decision tree independently predicts the future price trend of the stock, and then the final prediction is made through a voting mechanism [8].
LSTM is based on the learning and prediction capabilities of Recurrent Neural Networks (RNN). LSTM models can process time series data to learn long-term dependencies between time step sequences and data. In stock price prediction, LSTM retains and updates information at each time step through the structure of recurrent neural networks. Future stock price movements are predicted by learning patterns and trends in historical stock price data. Specifically, the LSTM model consists of a series of LSTM cells, each of which includes a forgetting gate, an input gate and an output gate, and a cell state. The forgetting gate controls which information will be discarded from the cell state, the input gate determines which information will be added to the cell state, and the output gate determines which information will be output from the cell state. By controlling these gates and updating the cell state, the LSTM model can capture long-term dependencies in the data and predict future stock price movements. In predictive modelling, many metrics are evaluated such as MSE, RMSE, and Accuracy etc. In this model this study has used RMSE as a performance metric. RMSE measures the difference between predicted and actual values and a lower RMSE value usually means better model performance.
3. Results and discussion
In the modelling, this study used RMSE as a performance metric. The results are simulated on the test set and training set respectively. Firstly, the RMSE of the LSTM model is 2.42 on the training set and 1.86 on the test set. This shows that the LSTM shows reasonable consistency in both the training and test phases. The LSTM is suitable for dealing with time-series data as it is able to capture long-term dependencies in the data. Stock market prices are often influenced by past trends and patterns, which makes LSTM a suitable choice. However, its RMSE on the test set is higher than on the training set, which may indicate some degree of overfitting. Next, the linear regression model has an RMSE of 0.77 on the training set and 1.67 on the test set. Linear regression models are commonly used to determine the relationship between two or more variables. In the context of the stock market, this means that the model tries to find a linear relationship between historical prices and future prices. The performance of the model is very good on the training set but decreases on the test set, which may be since stock market data usually does not follow a linear pattern exactly, leading to a decrease in performance in real-world applications. Finally, the Random Forest model has an RMSE of 0.50 on the training set and a high RMSE of 33.49 on the test set. Random Forest is a powerful integrated learning method that improves prediction accuracy by constructing multiple decision trees. The excellent performance on the training set shows its fitting ability, but the extremely high RMSE on the test set shows extremely severe overfitting. This situation may be due to the excessive complexity of the model, which over-captures specific features and noise in the training data, resulting in its poor generalization ability. The result plots for the three models are as Fig. 2, Fig. 3, and Fig. 4.
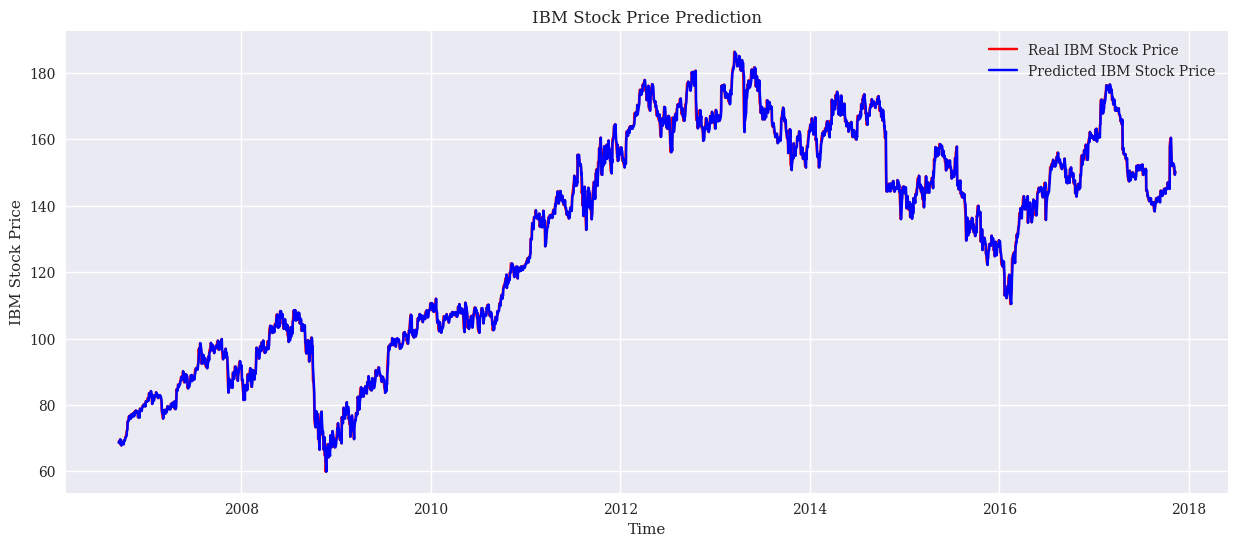
Figure 2. The result of Linear model (Photo/Picture credit: Original).
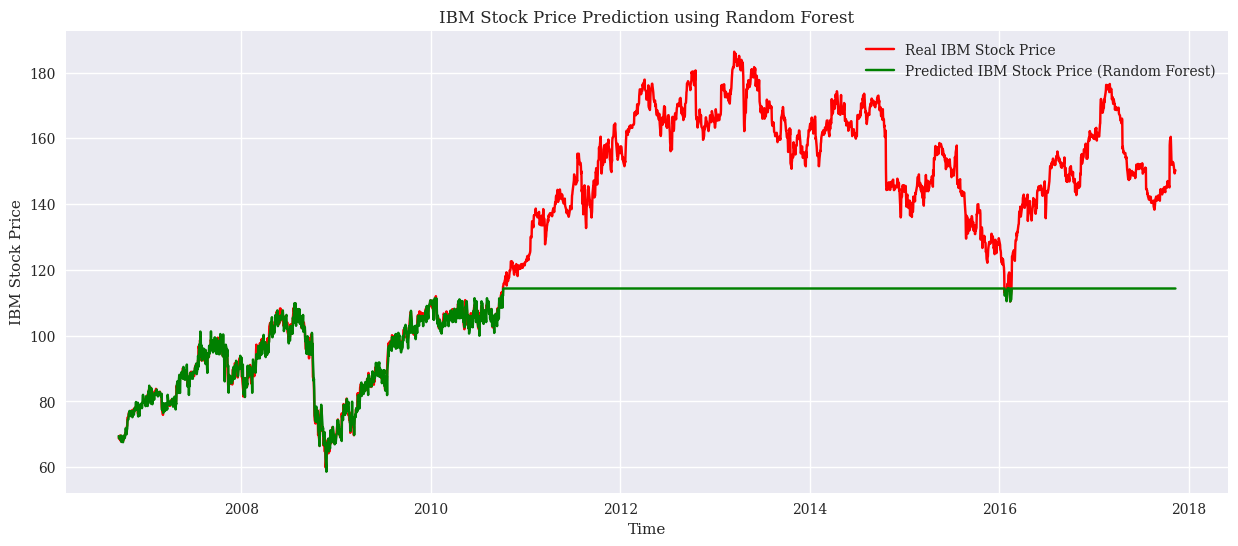
Figure 3. The result of Random Forest model (Photo/Picture credit: Original).
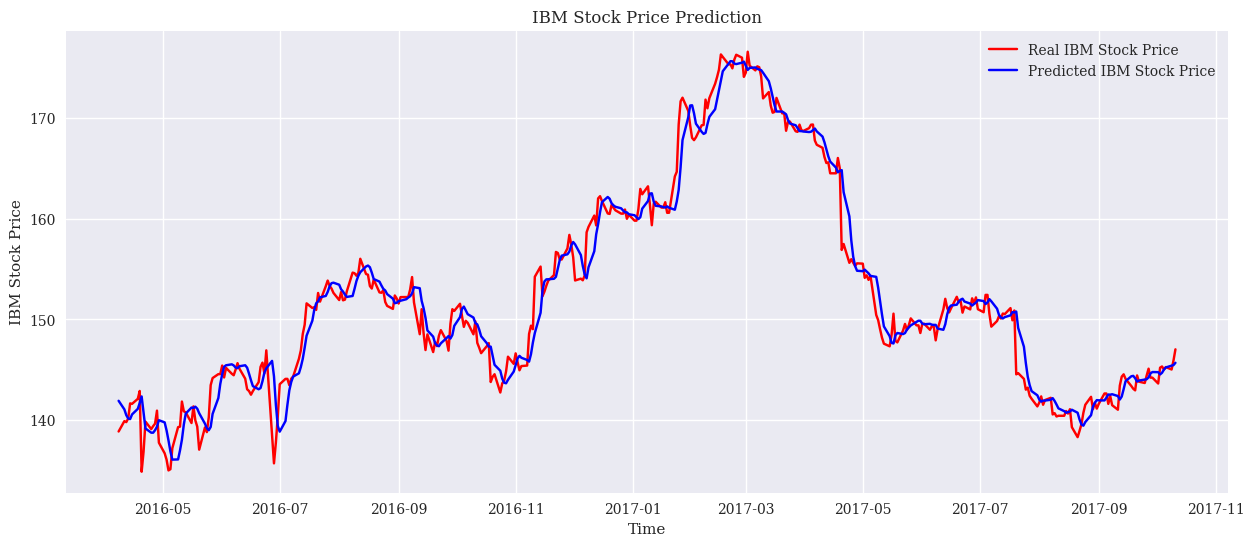
Figure 4. The result of LSTM (Photo/Picture credit: Original).
To summarize, firstly, for the application of the three models, namely, linear model, random forest, and LSTM, in stock price prediction, the results of the correlation analysis may vary depending on the dataset, model parameters and training methods. However, in general, all three models can predict stock price fluctuations to some extent, while some differences may exist. For the linear model, it is assumed that stock price movements are linear, but in reality stock price movements are often nonlinear. Therefore, the linear model may have some bias in predicting stock prices. However, if the dataset is large enough and the linear relationship is obvious, then the prediction result of the linear model may be very accurate. Random Forest is an integrated learning algorithm based on decision trees, which draws multiple samples from the original training samples by Bootstrap sampling method and then trains multiple decision trees based on these samples. The advantage of Random Forest is that it can reduce the overfitting risk of a single decision tree and improve the accuracy and stability of prediction. At the same time, Random Forest can handle multi-dimensional features and consider the correlation between different features, thus improving the accuracy of the prediction. LSTM has a better effect in dealing with time-series data, and thus has been somewhat reflected in this stock prediction. LSTM can learn the long-term dependency relationship in the data, thus better predicting the future stock price movement
Although all three models show varying degrees of effectiveness during the training phase, they perform differently in real-world applications (i.e., on the test set.) The LSTM and linear regression models show relatively good generalization, while the random forest model is severely overfitted. The selection of the most suitable model requires a combination of the model's generalization ability, its adaptability to the data, and its prediction accuracy. In a complex task such as stock price prediction, no single model can guarantee optimal performance, so multi-model fusion or deeper feature engineering may be an effective way to improve prediction accuracy.
4. Limitations and prospects
Linear models, random forests, and LSTM models all have their limitations in predicting stock prices, and their constraints include the following:
• Data quality and completeness: stock price prediction relies on a large amount of historical data. However, due to market volatility, data collection and processing limitations, data may have missing, outliers, or incomplete data, which can negatively affect the model's prediction results.
• Model complexity and generalization ability: Linear models assume that stock price are linear, but in reality, the stock market is affected by a variety of factors, including macroeconomic factors, industry trends, company performance, so their prediction results may be biased. Although Random Forest and LSTM models are able to handle non-linear relationships and long-term dependencies. But they are more complex and computationally intensive, and are prone to overfitting, leading to a decrease in generalization ability.
• Feature Selection and Extraction: Stock price prediction needs the selection of appropriate features to characterize the attributes of the stock and the market situation. However, feature selection and extraction is a complex problem, and different features may have different impacts on the prediction results. Besides, determining the weights and combinations between features is also a challenge.
In the future, one can try to fuse models such as linear models, random forests, and LSTMs so as to utilize the advantages of each. For example, linear and LSTM models can be combined to learn long-term dependencies using LSTM, and then use linear models for prediction to achieve better results. Enhanced Feature Selection and Extraction: for the problem of feature selection and extraction, one can try to adopt techniques such as deep learning to automatically extract features and utilize methods such as unsupervised learning to downscale and filter the features. In addition, one can also try to combine and fuse different features to get better prediction results. Considering market factors and policy impacts: stock price prediction should not only consider historical data and feature information, but also market factors and policy impacts. Therefore, in the future, one can try to introduce more market information and policy factors into the model to improve the accuracy and stability of prediction. In conclusion, although linear models, random forests and LSTM models have limitations in predicting stock prices, through continuous research and practice, one can continuously optimize and improve these models to obtain better prediction results.
5. Conclusion
This study focuses on the comparison of the linear models, random forests and long short-term memory networks (LSTM) in stock price prediction. First, the basic principles and scope of application of these three models are introduced. Linear model is a simple and easy-to-understand prediction model for stock price prediction with linear relationships. Random forest is an integrated learning model based on decision trees, which can handle complex nonlinear problems and can learn more patterns and trends from data. LSTM is a model based on recurrent neural networks, which is suitable for dealing with sequential data and capturing long term dependencies, and has good results for stock market prediction. Afterwards, the research describes the experimental design and data set selection. The historical data of IBM in yahoo. finance is used as the research object, and the data includes stock price, trading volume and other related financial indicators. In order to ensure data quality and consistency, stocks with complete data and no outliers were screened. Meanwhile, to comprehensively assess the predictive effect of the model, the root mean square error (RMSE) was used as the evaluation index. Finally, The thesis discusses the advantages, disadvantages and scope of application of different models and makes recommendations. Investors and financial institutions should choose appropriate forecasting models based on specific needs and market conditions. This experiment still has some shortcomings and limitations, one should combine more advanced experience, literature and more professional experimental results to make a judgment
References
[1]. Jishag A C, Athira A, Shailaja M and Thara S 2019 Predicting the stock market behavior using historic data analysis and news sentiment analysis in R In Advances in intelligent systems and computing pp 717–728.
[2]. Singh T, Kalra R K, Mishra S, and Kumar M 2022 An efficient real-time stock prediction exploiting incremental learning and deep learning Evolving Systems vol 14(6)pp 919–937.
[3]. Loukas S 2023 Time-Series Forecasting: Predicting Stock Prices Using An ARIMA Model Medium Retrieved from: https://towardsdatasciencecom/time-series-forecasting-predicting-stock-prices-using-an-arima-model-2e3b3080bd70
[4]. Chandola D, Mehta A, Singh S, Tikkiwal V A and Agrawal H 2022 Forecasting Directional Movement of Stock Prices using Deep Learning Annals of Data Science vol 10(5) pp 1361–1378.
[5]. Mallikarjuna M and Rao R P 2019 Evaluation of forecasting methods from selected stock market returns Financial Innovation vol 5(1).
[6]. Tiwari S, Bharadwaj A and Gupta S 2017 Stock price prediction using data analytics. In 2017 International Conference on Advances in Computing, Communication and Control (ICAC3) pp. 1-5.
[7]. Yang C and Zhou X 2021 Prediction of Stock Price Based on Linear Regression and LSTM ICMLCA 2021 2nd International Conference on Machine Learning and Computer Application Shenyang China pp 1-4.
[8]. Ma Y, Han R and Fu X 2019 Stock prediction based on random forest and LSTM neural network" 2019 19th International Conference on Control Automation and Systems (ICCAS) Jeju Korea 2019 pp 126-130.
[9]. Gong J and Sun S 2009 A new approach of stock price prediction based on logistic regression model. In 2009 International Conference on New Trends in Information and Service Science pp. 1366-1371.
[10]. Gururaj V, Shriya V R and Ashwini K 2019 Stock market prediction using linear regression and support vector machines Int J Appl Eng Res vol 14(8) pp 1931-1934.
[11]. Illa P K, Parvathala B and Sharma A 2022 Stock price prediction methodology using random forest algorithm and support vector machine Materials Today: Proceedings vol 56 pp 1776–1782.
Cite this article
Lu,Z. (2024). Comparison of stock price prediction models for linear models, random forest and LSTM. Applied and Computational Engineering,54,226-233.
Data availability
The datasets used and/or analyzed during the current study will be available from the authors upon reasonable request.
Disclaimer/Publisher's Note
The statements, opinions and data contained in all publications are solely those of the individual author(s) and contributor(s) and not of EWA Publishing and/or the editor(s). EWA Publishing and/or the editor(s) disclaim responsibility for any injury to people or property resulting from any ideas, methods, instructions or products referred to in the content.
About volume
Volume title: Proceedings of the 4th International Conference on Signal Processing and Machine Learning
© 2024 by the author(s). Licensee EWA Publishing, Oxford, UK. This article is an open access article distributed under the terms and
conditions of the Creative Commons Attribution (CC BY) license. Authors who
publish this series agree to the following terms:
1. Authors retain copyright and grant the series right of first publication with the work simultaneously licensed under a Creative Commons
Attribution License that allows others to share the work with an acknowledgment of the work's authorship and initial publication in this
series.
2. Authors are able to enter into separate, additional contractual arrangements for the non-exclusive distribution of the series's published
version of the work (e.g., post it to an institutional repository or publish it in a book), with an acknowledgment of its initial
publication in this series.
3. Authors are permitted and encouraged to post their work online (e.g., in institutional repositories or on their website) prior to and
during the submission process, as it can lead to productive exchanges, as well as earlier and greater citation of published work (See
Open access policy for details).
References
[1]. Jishag A C, Athira A, Shailaja M and Thara S 2019 Predicting the stock market behavior using historic data analysis and news sentiment analysis in R In Advances in intelligent systems and computing pp 717–728.
[2]. Singh T, Kalra R K, Mishra S, and Kumar M 2022 An efficient real-time stock prediction exploiting incremental learning and deep learning Evolving Systems vol 14(6)pp 919–937.
[3]. Loukas S 2023 Time-Series Forecasting: Predicting Stock Prices Using An ARIMA Model Medium Retrieved from: https://towardsdatasciencecom/time-series-forecasting-predicting-stock-prices-using-an-arima-model-2e3b3080bd70
[4]. Chandola D, Mehta A, Singh S, Tikkiwal V A and Agrawal H 2022 Forecasting Directional Movement of Stock Prices using Deep Learning Annals of Data Science vol 10(5) pp 1361–1378.
[5]. Mallikarjuna M and Rao R P 2019 Evaluation of forecasting methods from selected stock market returns Financial Innovation vol 5(1).
[6]. Tiwari S, Bharadwaj A and Gupta S 2017 Stock price prediction using data analytics. In 2017 International Conference on Advances in Computing, Communication and Control (ICAC3) pp. 1-5.
[7]. Yang C and Zhou X 2021 Prediction of Stock Price Based on Linear Regression and LSTM ICMLCA 2021 2nd International Conference on Machine Learning and Computer Application Shenyang China pp 1-4.
[8]. Ma Y, Han R and Fu X 2019 Stock prediction based on random forest and LSTM neural network" 2019 19th International Conference on Control Automation and Systems (ICCAS) Jeju Korea 2019 pp 126-130.
[9]. Gong J and Sun S 2009 A new approach of stock price prediction based on logistic regression model. In 2009 International Conference on New Trends in Information and Service Science pp. 1366-1371.
[10]. Gururaj V, Shriya V R and Ashwini K 2019 Stock market prediction using linear regression and support vector machines Int J Appl Eng Res vol 14(8) pp 1931-1934.
[11]. Illa P K, Parvathala B and Sharma A 2022 Stock price prediction methodology using random forest algorithm and support vector machine Materials Today: Proceedings vol 56 pp 1776–1782.