


1. Introduction
According to the most recent Cancer Statistics of 2023 [1], the United States has witnessed an estimated 288,300 new cases of prostate cancer and 34,700 associated deaths in 2023, with men having a 12.6% probability of developing prostate cancer from birth to death. These statistics account for 29% of all newly estimated cancer cases and 11% of anticipated deaths. The prevalence of prostate cancer significantly endangers men's health. Additionally, according to previous estimates from GLOBOCAN [2], prostate cancer ranked as the third most prevalent cancer globally (with a population of 1,276.1k and a cumulative risk of 3.73 by age 75), only trailing lung cancer and breast cancer. The persistent rise in the incidence and prevalence of prostate cancer poses an escalating challenge to healthcare systems, emphasizing the urgent need for effective diagnostic and treatment strategies. In light of this growing issue, the exploration of gene expression and the analysis of differential gene expression become increasingly pivotal.
These methodologies offer invaluable insights, bridging the gap between comprehending the molecular mechanisms underlying prostate cancer and their practical applications, from early-stage detection to unraveling disease mechanisms; differential gene expression analysis can be instrumental in predicting disease progression [3], and it holds the potential to offer personalized treatments for cancer, evaluate drug responses [4], and identify potential therapeutic targets for prevention, diagnosis, and treatment, with applications spanning numerous possibilities. Furthermore, integrating differential gene expression analysis with artificial intelligence and machine learning techniques can lead to more powerful and accurate solutions for cancer diagnosis and treatment, as machine learning models can identify complex gene expression patterns from large-scale data beyond human capacity, and deep learning in particular enables high-performance cancer classification and outcome prediction based on transcriptomic profiles; by combining differential gene expression analysis to reveal important cancer genes with the pattern recognition capability of AI, robust multi-gene signatures for precise cancer detection can be developed. Looking forward, harnessing the synergies between differential gene expression analysis and AI/machine learning will open new avenues for advancing precision oncology, with promising directions including building machine learning models based on differential gene expression data to guide individualized treatment selection and prognosis prediction, discovering novel cancer subgroups and biomarkers through deep mining of large-scale cancer transcriptomic data, developing AI-powered diagnostic systems that leverage differential gene expression signatures for accurate early detection, elucidating mechanisms of drug response/resistance by integrating gene expression and machine learning, and accelerating new drug development through AI modeling of differential gene expression effects; by fully leveraging the strengths of both methodologies, they are poised to transform the future of data-driven, personalized cancer medicine.
In this study, we initially acquired gene expression data from the GEO database and TCGA. Subsequently, we filtered the data based on p-value and fold change to identify differentially expressed genes. Following the data acquisition, we constructed and trained an Artificial Neural Network to demonstrate its performance. Furthermore, we conducted a comparative analysis with traditional classifiers and random selection methods. Additionally, we assessed adaptability by applying these methods to Pancreatic Cancer gene expression data.
2. Materials and Methods
2.1. Gene Expression Data Acquisition and Preprocessing
The National Center for Biotechnology Information Gene Expression Omnibus (NCBI GEO) database [5] was utilized to screen three prostate cancer (PCa) gene expression microarray datasets using the keywords "prostate cancer" and "human." Following further screening via meta-DE and other quality control programs, the datasets GSE17951 (cancer:95, normal:13), GSE32571 (cancer:59, normal:39), GSE46602(cancer:16, normal:20), GSE69223 (cancer:15, normal:15), and GSE89194 (cancer:49, normal:49) were identified.
For the acquisition of The Cancer Genome Atlas (TCGA) data, the information was obtained using TCGABiolinks in R. We utilized the PRCA dataset downloaded from TCGA. To maintain uniformity in gene ID and format, we employed g: Convert [6] to convert the ENSG labels to AFFY_HG_U133_PLUS_2 labels.
In total, the dataset comprised 188 normal samples and 736 tumor samples. The normal samples were a sum of 136 and 52, while the tumor samples totaled 234 and 502, respectively. Each sample included expressions of 54,675 genes (and in some cases 83,238 genes). The data format is illustrated in table 1.
Table 1. Gene Data Format for GEO and datasets after conversion.
Sample ID |
p/n |
GALNT15 |
XPNPEP2 |
PCSK1 |
… |
GSM449238 |
0 |
3.25 |
2.95 |
2.69 |
… |
GSM449239 |
0 |
3.43 |
3.41 |
3.53 |
… |
|
|
|
|
|
|
GSM449150 |
1 |
2.09 |
2.39 |
1.90 |
… |
GSM449151 |
1 |
2.08 |
2.42 |
1.84 |
… |
… |
… |
… |
… |
… |
… |
The table demonstrates the sample IDs in the first column, with the second column indicating whether it's a tumor sample (designated as 1 for 'yes' and 0 for 'no'). The gene expression values, specifically for the key gene (identified by the probe ID above), are represented as the log2 value of their original measurements, accentuating the differences.
Subsequently, the obtained data underwent analysis through GEO2R, which employs DESeq2. Further data refinement was conducted based on fold change and adjusted p-values derived from the negative binomial test. The parameters employed to indicate significant data in this experiment were log10FC > 0.3 and adjusted p-value < 0.05. Utilizing log10FC and adjusted p-values, we generated volcano plots to graphically represent the data. Illustrated in figure 1 below, the x-axis of the plot represents log2FC, while the y-axis denotes -log10(p-value). This visualization effectively portrays the significance and magnitude of data alterations by displaying points in distinctive colours. With this technology, we have ruled out 237 differently expressed genes (DEGs). But not all of these genes are in TCGA dataset. After verification and disposing 0 in the TCGA data, we finally choose 220 genes.
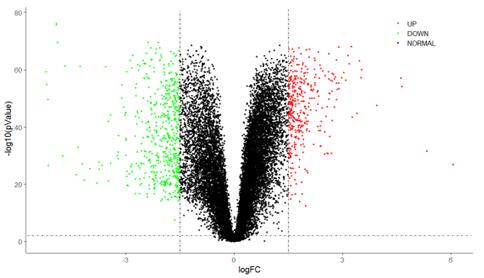
Figure 1. Volcano plot for example gene.
2.2. Evaluating Models
2.2.1. Artificial Neural Network Model. The fundamental unit of an Artificial Neural Network (ANN) is a perceptron, acting as a basic computational unit that receives one or multiple inputs, conducts a weighted summation of these inputs, and subsequently applies an activation function to generate an output. Perceptrons connect with each other, creating distinct layers, namely the input layer, hidden layer, and output layer.
Subsequent to the identification of differentially expressed genes, an Artificial Neural Network (ANN) was formulated to train the data derived from these genes, discerning whether the input gene expression sample represented a normal or tumor sample. ANNs belong to a class of machine learning models inspired by the structure and functionality of biological neural networks, akin to the human brain. They comprise interconnected nodes, often referred to as neurons or perceptrons, organized into layers. These networks are utilized for diverse machine learning tasks encompassing classification, regression, and pattern recognition.
ANNs possess the capability for arbitrarily complex pattern classification and outstanding multi-dimensional function mapping. They have found extensive application in the domain of pattern recognition. The artificial neural network developed for this research comprises an input layer, three hidden layers, and an output layer. It consists of 232 nodes in the input layer, with 256, 64, and 16 nodes in the three respective hidden layers, and 2 nodes in the output layer, reflecting the likelihood of illness or normalcy.
For more detailed information, reference can be made to the output of the function model.summary() shown in table 2.
Table 2. Parameter summary in ANN model.
Layer (type) |
Output Shape |
Param # |
dense (Dense) |
(None, 256) |
56576 |
dense_1 (Dense) |
(None, 64) |
16448 |
dense_2 (Dense) |
(None, 16) |
1040 |
dense_3 (Dense) |
(None, 2) |
34 |
Total params: 74098 |
||
Trainable params: 74098 |
||
Non-trainable params: 0 |
||
A visualization of the network is shown below in figure 2:
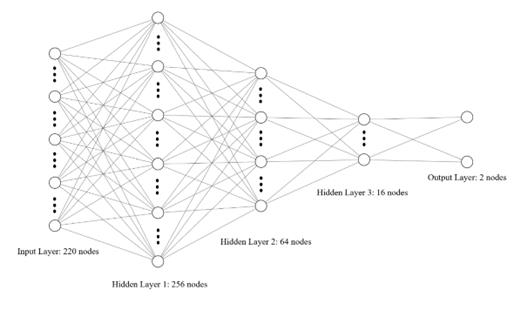
Figure 2. Structure visualization of the ANN. Some nodes are omitted due to the space limit.
Within this network architecture, the hidden layer utilized the Rectified Linear Unit (ReLU) activation function, while the output layer employed softmax. The network employed binary cross-entropy as the optimizer loss function, alongside the inclusion of stochastic gradient descent (SGD) as the optimizer. The training epoch was set at 60, with a batch size of 10.
Regarding the data input, the gene expression data in the Microarray format necessitates normalization. This research implemented z-score normalization as the normalization method. The method's formula for a dataset is as follows:
\( x^\prime=\frac{x - \mu}{\sigma} \)
where \( \mathbf{x}^\prime \) is the specific gene data to train the network, \( \mathbf{x} \) is the filtered data, \( \mathbf{\mu} \) is the sample mean of \( \mathbf{x} \) , and \( \mathbf{\sigma} \) represents the standard differentiation of the original data.
Within the network architecture, the processed gene expression data from these seven genes are allocated to the respective input nodes, as depicted in the graphical representation. Following three hidden layers and one dropout layer, the final output manifests as a two-dimensional array denoting the probability of individuals being classified as either normal or as patients. This array is decoded to determine whether the network has identified the sample as indicative of a normal or abnormal condition.
2.2.2. Traditional Classifier Models. To compare the ANN performance to the traditional classifiers, we introduce four kinds of classifiers: Logistics Regression, Ridge Regression, Naïve Bayes and Decision Tree. The parameters we used in this research are all default values. We used the same data as we used for training ANN, and get the testing results of these four classifiers.
2.3. Evaluating Metrics
In this study, the key assessment parameter is the confusion matrix. This matrix stands as a fundamental tool in the domains of machine learning and statistics, employed to evaluate the performance of a classification model. It offers a tabular representation, enabling an understanding of the extent to which the model's predictions correspond with the actual class labels within a dataset.
Following the representation provided by the confusion matrix, it becomes straightforward to derive essential metrics such as TP (True Positive), TN (True Negative), FP (False Positive), and FN (False Negative). These metrics play vital roles in assessing the model's predictive capabilities and its accuracy in correctly identifying classes.
3. Results
3.1. ANN Outperforms Traditional Classifiers
In this study, we conducted a comprehensive comparison of the Artificial Neural Network (ANN) against four traditional classification algorithms: Logistic Regression, Ridge Classifier, Gaussian Naïve Bayes, and Decision Tree Classifier. The outcomes of this comparative analysis are succinctly presented in table 3.
Table 3. Metrics Comparison of Different Methods.
The data were obtained from five repetitions.
Methods |
Accuracy |
Precision |
Recall |
Specificity |
F1 Score |
Artificial Neural Network |
0.78±0.01 |
0.985±0.012 |
0.77±0.02 |
0.86±0.07 |
2.31±0.02 |
Logistic Regression |
0.76±0.00 |
0.98±0.00 |
0.75±0.00 |
0.85±0.00 |
2.35±0.00 |
Ridge Classifier |
0.70±0.00 |
0.97±0.00 |
0.69±0.00 |
0.81±0.00 |
2.47±0.00 |
Gaussian Naïve Bayes |
0.71±0.00 |
0.994±0.000 |
0.69±0.00 |
0.96±0.00 |
2.47±0.00 |
Decision Tree Classifier |
0.76±0.02 |
0.96±0.01 |
0.76±0.02 |
0.71±0.12 |
2.35±0.04 |
The table distinctly highlights the exceptional performance of the Artificial Neural Network (ANN) in comparison to four traditional classifiers. The ANN demonstrates superior accuracy and recall, coupled with the lowest F1 score among all classifiers, clearly indicating its predominant efficacy in predictive performance. Remarkably, a consistent precision of 0.96 across all models emphasizes the outstanding performance of the dataset with diverse classifiers. This consistently high precision underlines the robust nature of the methodology used, confirming its reliability and effectiveness over conventional classification methods.
3.2. Random Gene Network Analysis
To assess the robustness of the network, we conducted a comparative analysis while maintaining the same network structure and dataset. The only variable altered was the method of selecting Differentially Expressed Genes (DEGs). From the five GEO datasets specified earlier, 220 common genes were randomly selected. Utilizing these expression data, we trained an identical network. Subsequently, this network was evaluated using the TCGA dataset, employing the relevant gene expression data for testing. The outcomes of this assessment, comparing the Random Gene Network with the Selected Gene Network, are presented in table 4.
Table 4. Result comparison of Random Gene Network and Selected Gene Network.
The traditional classifiers in this table also use sampled random genes.
Methods |
Accuracy |
Precision |
Recall |
Specificity |
F1 Score |
Selected Neural Network |
0.78±0.01 |
0.985±0.012 |
0.77±0.02 |
0.89±0.10 |
2.32±0.03 |
Random Gene Network |
0.65±0.12 |
0.92±0.07 |
0.67±0.09 |
0.46±0.46 |
2.60±0.27 |
Logistic Regression |
0.62±0.14 |
0.91±0.07 |
0.64±0.11 |
0.43±0.41 |
2.72±0.37 |
Ridge Classifier |
0.60±0.11 |
0.92±0.06 |
0.60±0.09 |
0.62±0.31 |
2.79±0.31 |
Gaussian Naïve Bayes |
0.59±0.12 |
0.92±0.08 |
0.60±0.09 |
0.48±0.48 |
2.80±0.34 |
Decision Tree Classifier |
0.60±0.18 |
0.94±0.04 |
0.57±0.20 |
0.70±0.18 |
3.01±0.70 |
Table 4 clearly demonstrates a marked reduction in the number of True Positives, decreasing from 400 to 334. Simultaneously, there is a slight increase in the True Negative rate, along with a substantial increase in False Negatives. As a result, both the accuracy and recall metrics show a decline, reflecting a less effective performance in identifying positive patients in comparison to our original network. This shift in performance indicators implies a possible compromise between True Positives and True Negatives, necessitating additional analysis into the network's ability to accurately classify positive patients.
4. Gene Otology and Pathway Analysis
The analysis of differentially expressed genes (DEGs) offers a comprehensive insight into their biological significance. After isolating these genes, we employed the DAVID functional annotation tools to delve into gene ontology (GO) analysis [7,8]. This investigation revealed that the expressions of these genes are not isolated events; rather, they interact intricately and collectively contribute to the formation of pathways that govern human bodily functions. The gene ontology findings are visually represented in a bar graph, as depicted in figure 3.
Delving deeper, within the Gene Ontology Biological Process (GO_BP) category, we identified certain genes that play a pivotal role in the G1/S transition of the mitotic cell cycle. This transition is a critical phase within the broader spectrum of the mitotic cell cycle phase transitions. The process begins with the activation of G1 cyclin-dependent kinase (G1 CDK), which triggers the transcription of G1 cyclins. This phase culminates in a positive feedback loop, where G1 cyclins enhance the activity of G1 CDK, propelling the cell into the S phase and initiating DNA replication. This complex biological process is further elucidated at [9], offering a more detailed understanding of its mechanisms.
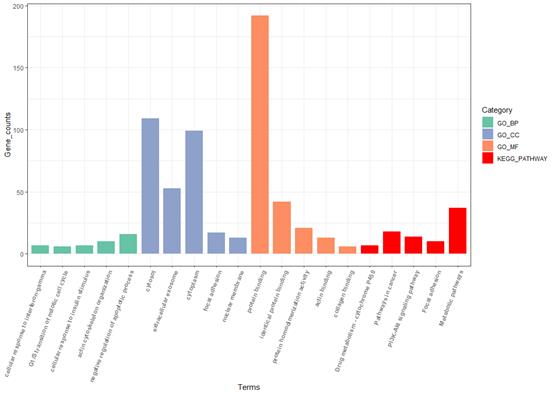
Figure 3. Gene Otology analysis for obtained genes.
In the realm of oncology, particularly concerning prostate cancer, these findings gain additional significance. It is hypothesized that prostate cancer may induce an abnormal increase in mitotic cell cycle activity. This upsurge in the expression of genes associated with the mitotic cell cycle could correlate with the aggressive proliferation of cancer cells within the prostate gland. Such an escalation in cellular activity, especially in the context of cancer, could significantly contribute to the progression of the disease. This underscores the critical role these genes play in the cancer landscape, highlighting their potential as biomarkers or therapeutic targets.
Moreover, our analysis extended to the Kyoto Encyclopedia of Genes and Genomes (KEGG) pathway, which further implicated these genes in pathways intimately linked to cancer. Identifying these genes within cancer-associated pathways not only validates their relevance to cancer biology but also reinforces the reliability of our gene selection and filtering methodology. This validation is crucial, as it underscores the significance of these genes in deciphering the molecular mechanisms underlying prostate cancer. It provides a crucial link between gene expression patterns and the advancement of this malignancy, offering potential avenues for targeted therapeutic interventions and a deeper understanding of cancer biology.
5. Model Transferability
This research methodology demonstrates remarkable versatility and broad applicability across a spectrum of disease domains. Its utility extends well beyond the confines of prostate cancer (PCa), encompassing other complex diseases such as Pancreatic Cancer (PAAD). Drawing inspiration from a similar research approach delineated in a concurrent study, as detailed at [10], we meticulously acquired datasets identical to those utilized in that specific investigation. These datasets, encompassing GSE23397, GSE28735, GSE41368, GSE32676, GSE15471, GSE71729, GSE60979, GSE16515, and GSE62452, formed the foundational basis of our analysis. We figured out 59 DEGs according to our method. We use GSE15471(cancer:39, normal:39), GSE23397(cancer:15, normal:6), GSE28735(cancer:45, normal:45), GSE32676(cancer:25, normal:7), GSE41368 (cancer:6, normal:6), GSE60979(cancer:49, normal:12), GSE71729(cancer:145, normal:134) as training data, and GSE16515(cancer:36, normal:16), GSE62452(cancer:69, normal:61) as testing data.
Our methodological approach involved a rigorous process of data filtration, followed by the training of a neural network using a set of consistent and carefully calibrated parameters. This methodology was meticulously applied to the aforementioned datasets. The results derived from this approach are presented in a detailed and comprehensive manner in Table 5.
Table 5. Metrices for PAAD Data. The Accuracy and Specificity rise because the difference of sample amount and difference of marker genes for cancer.
Methods |
Accuracy |
Precision |
Recall |
Specificity |
F1 Score |
Artificial Neural Network |
0.87±0.01 |
0.97±0.02 |
0.81±0.02 |
0.96±0.03 |
2.27±0.02 |
Logistic Regression |
0.85±0.00 |
0.92±0.00 |
0.81±0.00 |
0.91±0.00 |
2.32±0.00 |
Ridge Classifier |
0.86±0.00 |
0.93±0.00 |
0.82±0.00 |
0.92±0.00 |
2.29±0.00 |
Gaussian Naïve Bayes |
0.84±0.00 |
0.92±0.00 |
0.79±0.00 |
0.91±0.00 |
2.35±0.00 |
Decision Tree Classifier |
0.84±0.02 |
0.88±0.01 |
0.83±0.03 |
0.86±0.01 |
2.35±0.05 |
A thorough examination of the data presented in Table 5 reveals a noteworthy observation: all five types of classifiers employed in our study exhibited robust performance. This finding underscores the transferability and efficacy of our method across different cancer types. Furthermore, in certain instances, our Artificial Neural Network (ANN) demonstrated superior performance compared to traditional classifiers. This suggests that ANNs may offer a more effective and potentially transformative approach in the realm of cancer diagnosis, heralding a new era of precision and accuracy in this critical field of medical science.
6. Discussion and Conclusion
In this study, we have employed advanced bioinformatics methods, including fold change and p-value analysis, to screen differentially expressed genes (DEGs) in the context of prostate cancer (PCa). A fully connected Artificial Neural Network (ANN), alongside other classifiers such as Logistic Regression, Ridge, Gaussian NB, and Decision Tree, was meticulously trained on gene expression data. This approach has yielded a robust model for PCa diagnosis, demonstrating that under the filtering conditions of log2FC > 1 and p-value < 0.05, the data aligns effectively with these classifiers. The versatility of this method suggests its potential applicability in diagnosing other forms of cancer, thereby offering novel insights and methodologies for tackling complex diseases.
The significance of Differential Gene Expression (DGE) analysis in cancer research cannot be overstated. It serves as a crucial step in deciphering the complex pathways leading to cancer formation, emphasizing the role of genetic factors in the development of this disease. Our study underscores the importance of understanding these genetic variations, as they are paramount in both the diagnosis and treatment of cancer. DGE analysis has revealed that genes exhibiting differential expression are closely associated with cancer formation. Genetic mutations or variations in genomes can lead to abnormal gene expression, which is a key factor influencing cancer development.
Furthermore, the transition from mRNA to DNA in cancer research is an area ripe for exploration. mRNA, being the transcription product of DNA and directly involved in protein synthesis, offers valuable insights into the mechanisms of cancer development. Investigating the presence of cancer-linked elements within DNA, such as mutations and DNA modifications like methylation, is crucial. These genetic alterations are pivotal in the development of cancer, as they can lead to the silencing or overactivation of certain genes, thereby contributing to the disease.
In addition, the study of protein synthesis and its aberrations is vital for cancer diagnosis. Starting from DEGs and identifying specific proteins exhibiting unusual expressions is a fundamental process for early cancer diagnosis and treatment. This specialized protein detection technology, focusing on specific biomarkers like AFP (alpha fetoprotein), holds promising applications in cancer diagnosis and treatment, making detection methods more targeted and effective.
Looking ahead, further research avenues could delve deeper into these genetic and epigenetic mechanisms. Understanding the intricate relationship between gene expression, DNA mutations, and protein synthesis will not only enhance our comprehension of cancer development but also pave the way for more accurate and robust diagnostic and therapeutic strategies. This study represents a significant step in that direction, providing a foundation for future research to build upon.
References
[1]. Siegel RL, Miller KD, Wagle NS and Jemal A. 2023. J. A Cancer Journ. for Clinicians. 73(1):17–48.
[2]. Ferlay J, Colombet M, Soerjomataram I, Mathers C, Parkin DM, Piñeros M, et al. 2018. D. Intl. Jour. of Cancer. 144(8).
[3]. Ji Q, Zheng Y, Zhang G, Hu Y, Fan X, Hou Y, et al. 2019. J. Annals of the Rhe. Diseases. 78(1):100–10.
[4]. Melouane A, Ghanemi A, Aubé S, Yoshioka M and St-Amand J. 2018. J. Ageing Res. Reviews. 41:53–63.
[5]. geo. Nih.gov. 2019. Available from: https://www.ncbi.nlm.nih.gov/geo/
[6]. g:Profiler biit.cs.ut.ee. Available from: https://biit.cs.ut.ee/gprofiler/convert
[7]. Sherman BT, Hao M, Qiu J, Jiao X, Baseler MW, Lane HC, et al. 2022. M. Nucleic Acids Res. 50(W1).
[8]. Huang DW, Sherman BT and Lempicki RA. 2008. D. Nat. Protocols. 4(1):44–57.
[9]. Almeida PP, Cardoso CP and Freitas LM. 2020. J. BMC Cancer. 20(1).
[10]. Bertoli C, Skotheim JM and Bruin RAM. 2013. J. 23 Nat. Rev. Molecular Cell Biol. 14(8):518–28.
Cite this article
Xie,Y.;Xie,J. (2024). Integrates Differential Gene Expression analysis and deep learning for accurate and robust prostate cancer diagnosis. Applied and Computational Engineering,57,66-74.
Data availability
The datasets used and/or analyzed during the current study will be available from the authors upon reasonable request.
Disclaimer/Publisher's Note
The statements, opinions and data contained in all publications are solely those of the individual author(s) and contributor(s) and not of EWA Publishing and/or the editor(s). EWA Publishing and/or the editor(s) disclaim responsibility for any injury to people or property resulting from any ideas, methods, instructions or products referred to in the content.
About volume
Volume title: Proceedings of the 6th International Conference on Computing and Data Science
© 2024 by the author(s). Licensee EWA Publishing, Oxford, UK. This article is an open access article distributed under the terms and
conditions of the Creative Commons Attribution (CC BY) license. Authors who
publish this series agree to the following terms:
1. Authors retain copyright and grant the series right of first publication with the work simultaneously licensed under a Creative Commons
Attribution License that allows others to share the work with an acknowledgment of the work's authorship and initial publication in this
series.
2. Authors are able to enter into separate, additional contractual arrangements for the non-exclusive distribution of the series's published
version of the work (e.g., post it to an institutional repository or publish it in a book), with an acknowledgment of its initial
publication in this series.
3. Authors are permitted and encouraged to post their work online (e.g., in institutional repositories or on their website) prior to and
during the submission process, as it can lead to productive exchanges, as well as earlier and greater citation of published work (See
Open access policy for details).
References
[1]. Siegel RL, Miller KD, Wagle NS and Jemal A. 2023. J. A Cancer Journ. for Clinicians. 73(1):17–48.
[2]. Ferlay J, Colombet M, Soerjomataram I, Mathers C, Parkin DM, Piñeros M, et al. 2018. D. Intl. Jour. of Cancer. 144(8).
[3]. Ji Q, Zheng Y, Zhang G, Hu Y, Fan X, Hou Y, et al. 2019. J. Annals of the Rhe. Diseases. 78(1):100–10.
[4]. Melouane A, Ghanemi A, Aubé S, Yoshioka M and St-Amand J. 2018. J. Ageing Res. Reviews. 41:53–63.
[5]. geo. Nih.gov. 2019. Available from: https://www.ncbi.nlm.nih.gov/geo/
[6]. g:Profiler biit.cs.ut.ee. Available from: https://biit.cs.ut.ee/gprofiler/convert
[7]. Sherman BT, Hao M, Qiu J, Jiao X, Baseler MW, Lane HC, et al. 2022. M. Nucleic Acids Res. 50(W1).
[8]. Huang DW, Sherman BT and Lempicki RA. 2008. D. Nat. Protocols. 4(1):44–57.
[9]. Almeida PP, Cardoso CP and Freitas LM. 2020. J. BMC Cancer. 20(1).
[10]. Bertoli C, Skotheim JM and Bruin RAM. 2013. J. 23 Nat. Rev. Molecular Cell Biol. 14(8):518–28.