


1. Introduction
In recent decades, Earth has undergone rapid and transient climate change, marked by significant global warming that has deeply affected various facets of our environment. These changes have had widespread repercussions on weather patterns, climate dynamics, ecosystems, societal well-being, and economic stability (IPCC, 2019). To mitigate these impacts, a range of strategies has been implemented, from land and ocean-based CO2 drawdown methods to carbon capture and storage. The Paris Agreement of 2016 stands as a landmark policy effort aimed at preserving a reasonable chance of limiting global warming to well below 2 degrees [1].
A common misunderstanding, prevalent in public discourse, is the assumption that stabilizing atmospheric composition would also stabilize global mean temperatures. An illustrative case is provided by the Hadley Centre model, which simulates a decline in Pacific zonal sea surface temperature gradients and leads to a rapid die-back of the Amazon Forest by the mid-21st century. This ecological collapse triggers a nonlinear rise in atmospheric CO2, further accelerating global warming [2].
Among Earth's climate phenomena, the El Niño-Southern Oscillation (ENSO) is of paramount importance [3]. Originating in the Tropical Pacific, ENSO wields a dominant interannual influence on global climate. It exerts profound effects on both the climate and ecology of the Tropical Pacific and beyond. For example, El Niño events often lead to droughts and forest fires due to an eastward shift in convection, while La Niña events tend to cause heavy rains and flooding. These broad-reaching effects position ENSO as a key component in the Earth's response to anthropogenic warming.
This essay focuses on the potential changes in ENSO dynamics under greenhouse warming, specifically the eastward shift and intensification of ENSO-related atmospheric teleconnections, such as the Pacific-South American patterns. Over the years, the Coupled Model Intercomparison Project (CMIP) has evolved from its first phase to the current sixth phase (CMIP6). The projections from these models align closely with observed temperature increases over land and present a spatial congruency between projections and observations [4]. This suggests that CMIP models might be slightly conservative in their future warming projections up to the year 2020. However, these models face challenges in accurately capturing long-term trends, particularly due to their sensitivity to internal variability over timescales of 20 years or less.
2. ENSO
2.1. Definition
The El Niño-Southern Oscillation (ENSO) stands as a paramount internal climate fluctuation on an interannual temporal scale [5]. It is imperative to acknowledge that, within the scientific community, there exists no universally ratified characterization for an "El Niño" phenomenon. Nevertheless, a widely embraced criterion posits that an El Niño event may be deemed to have transpired when the 5-month moving average of sea surface temperature anomalies, situated within the Nino 3.4 region (extending from 5°N to 5°S and from 120°W to 170°W), surpasses the threshold of 0.4°C for an uninterrupted duration of at least six consecutive months (Trenberth, National Center for Atmospheric Research, Boulder, Colorado) [6]. In alignment with this established criterion, it can be asserted that El Niño occurrences manifest approximately 31% of the time, while concomitant to this, La Niña events, defined in a comparable fashion, materialize approximately 23% of the time.
The terminology and understanding of what constitutes an El Niño event have evolved over time, making it a challenging phenomenon to define precisely. Numerous researchers, from Quinn et al. (1978) and Glantz and Thomson (1981) to Glantz (1996), have highlighted the varying historical interpretations of the term. Glantz (1996) eventually proposed a definition for El Niño that aimed for clarity and consistency suitable for dictionary inclusion.
|
|
|
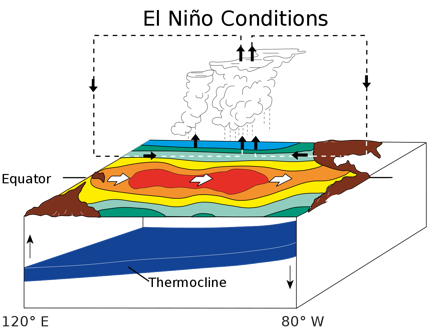
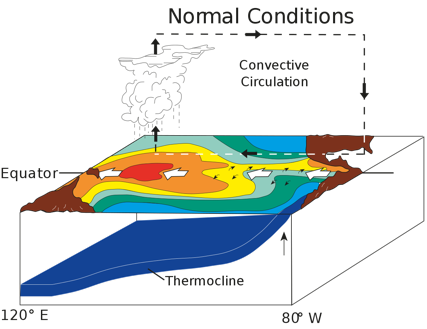
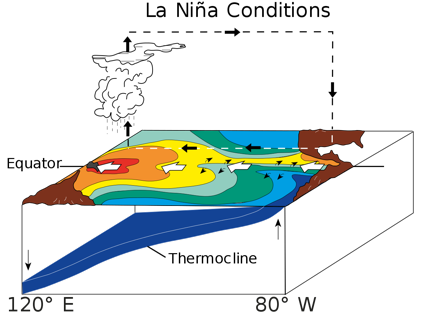
Figure 1. The Walker Circulation is a tropical Pacific atmospheric pattern moving warm, moist air westward, causing rainfall in the western Pacific and dryness in the east. El Niño, a warming of the Pacific, disrupts global climate. La Niña, its counterpart, features cooler waters and distinct climate impacts [7].
2.2. El Nino and La Niña
ENSO exhibits irregular fluctuations between cold (La Niña) and warm (El Niño) conditions in the eastern and central equatorial Pacific, occurring on a timescale of 2 to 7 years. Initially, the term “El Niño” referred to an annual, relatively weak warm ocean current that flowed southward along the coasts of Peru and Ecuador around Christmastime. However, in contemporary understanding, this term has come to signify a much broader anomalous warming of the ocean that extends to the international date line, accompanied by global climatic disruptions. The atmospheric element associated with El Niño is called the “Southern Oscillation.”
Conversely, “La Niña,” which translates to “the girl” in Spanish, is defined as an event characterized by the cooling of the tropical Pacific and represents the cold phase of the ENSO cycle. For public understanding and scientific discourse, the overarching term for this complex interplay of oceanic and atmospheric conditions is “ENSO.”
2.3. EP- and CP-type
Two distinct categories of ENSO occurrences, specifically Eastern Pacific El Niño and Central Pacific El Niño, are subjected to scrutiny through an examination of their Pattern Correlation Coefficients (PCCs) concerning monthly sea surface temperature (SST) anomalies within the tropical expanse of the Pacific Ocean [8].In the context of two distinct Shared Socioeconomic Pathway (SSP) scenarios, SSP2-4.5 and SSP5-8.5, ensemble models present projections that indicate a potential decrease in the overall frequency of El Niño events by approximately 26% and 16%, respectively, in relation to historical occurrences and future predictions [9].
Furthermore, this analysis posits that the recent upswing in the incidence of Central Pacific El Niño events may find its origins in multidecadal fluctuations rather than being ascribed solely to anthropogenic global warming.
El differentiations of El Niño phenomena are commonly classified into three categories: (EP (Eastern Pacific type), CP (Central Pacific type), or Mix (mixed type), with undiagnosed cases indicated by a dash [10]. Diverse methodologies are employed to facilitate this categorization, encompassing the Pattern Correlation approach (referred to as the PTN method) and the El Niño Modoki Index (known as EMI). Additionally, certain investigations make use of indices such as the cold tongue and warm pool (CP/EP) for classification purposes.
According to Table 1, there has been a notable increase in the number of Central Pacific El Niño events over the last two decades, with six Central Pacific events diagnosed compared to just three Eastern Pacific events. This trend aligns with the findings of previous research, which also indicates that Central Pacific El Niño events have become more frequent in recent years.
Table 1. Type of EI Nion events determined in the present study and previous studies [12].
Type | ||||||||
Yu and Kim (2013) (1951--2010) | ||||||||
El Niho years | Present study (1951-2020) | PTN | Nion | EMI | CT/WP | Jeong and Ahn (2017) (1982-2014) | Paek et al. (2017) (1961-2016) | Shi et al. (2020) (1965-2016) |
1951-1952 | EP | Mix | EP | EP | EP | |||
1953-1954 | Mix | Mix | EP | CP | CP | |||
1957-1958 | EP | CP | EP | CP | EP | |||
1963-1964 | EP | CP | EP | CP | EP | - | ||
1965-1966 | EP | CP | EP | CP | EP | CP | EP | |
1966-1967 | CP | - | - | - | - | - | CP | |
1967-1968 | CP | - | - | - | - | - | CP | |
1968-1969 | - | CP | CP | CP | CP | CP | - | |
1969-1970 | - | CP | EP | EP | EP | Mix | EP | |
1972-1973 | EP | Mix | EP | EP | EP | EP | EP | |
1976-1977 | EP | Mix | EP | EP | EP | EP | EP | |
1977-1978 | - | CP | CP | CP | CP | CP | CP | |
1982-1983 | EP | EP | EP | EP | EP | Mix | EP | EP |
1986-1987 | Mix | Mix | EP | EP | EP | - | Mix | CP |
1987-1988 | - | CP | EP | EP | CP | - | - | - |
1990-1991 | CP | - | - | - | - | CP | - | CP |
1991-1992 | EP | CP | EP | EP | EP | EP | CP | CP |
1993-1994 | Mix | - | - | - | - | - | - | - |
1994-1995 | CP | CP | CP | CP | CP | CP | CP | CP |
1997-1998 | EP | EP | EP | EP | EP | EP | EP | EP |
2001-2002 | CP | - | - | - | - | - | - | - |
2002-2003 | CP | CP | EP | CP | CP | CP | CP | |
2004-2005 | CP | CP | CP | CP | CP | CP | CP | CP |
2006-2007 | EP | Mix | EP | EP | EP | EP | Mix | - |
2009-2010 | EP | CP | CP | CP | EP | CP | EP | - |
2014-2015 | CP | - | - | |||||
2015-2016 | EP | Mix | EP | |||||
2017-2018 | CP | |||||||
2019-2020 | CP | |||||||
3. Response
3.1. Amplitude
In the context of global warming, the potential impact on ENSO is a subject of significant concern, particularly the possibility of an amplified ENSO amplitude. This amplification is theoretically rooted in the planet's warming conditions, which can lead to more pronounced climate fluctuations. One key mechanism behind this involves the nonlinear increase in atmospheric water vapor content as global temperatures rise, thereby enhancing feedback loops that are crucial to ENSO dynamics. Observations in recent years have indeed pointed to changes in ENSO amplitude that align with these expectations. This relationship highlights the complex interaction between various climate drivers and ENSO behavior in a warming world, marking it as a critical area of research for understanding future climate changes.
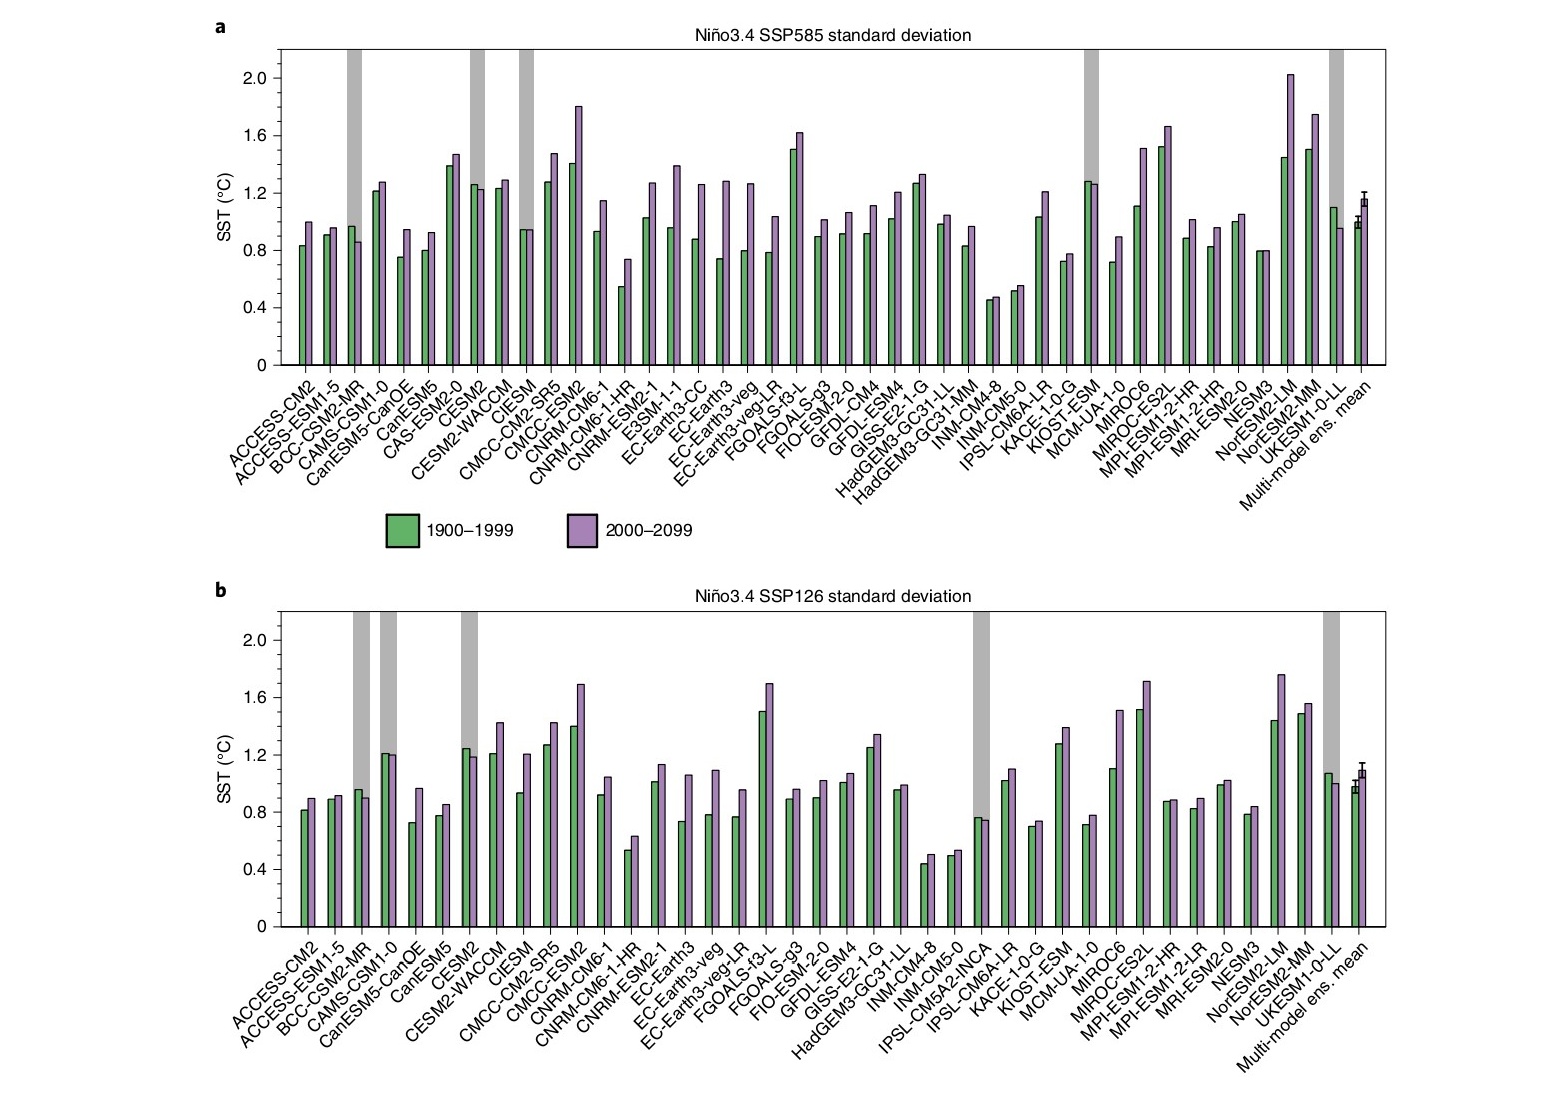
Figure 2. An inter-model consensus on increased ENSO SST variability [11].
A broad consensus among climate models highlights an increase in the variability of sea surface temperatures (SST) associated with ENSO. Specifically, for the SSP585 and SSP126 scenarios, 43 CMIP6 models for SSP585 and 39 for SSP126 provide insights into the standard deviation of ENSO Niño3.4 SST. A significant majority of these models—88.4% under the SSP585 scenario and 87.2% under the SSP126 scenario—predict an escalation in ENSO variability throughout the 21st century (2000–2099) when compared to the 20th century (1900–1999). It's worth noting that models shaded in gray do not corroborate this upward trend. Additionally, the multi-model ensemble mean substantiates this projected increase, backed by statistically significant differences as confirmed through Bootstrap test-derived error bars [11].
3.2. Diversity
The inherent variability of sea surface temperatures (SST) in the El Niño-Southern Oscillation ENSO plays a crucial role in its global impacts. However, predicting its future behavior continues to be a complex scientific challenge. While the Intergovernmental Panel on Climate Change (IPCC) suggests that ENSO SST variability may remain consistent across different emission scenarios, a noticeable increase is evident when comparing the 20th and 21st centuries [11].
This upward trend is particularly pronounced in the four reputable emission scenarios outlined by the IPCC.
A consensus among CMIP6 models further supports the notion of increased ENSO SST variability in the 21st century across all four Shared Socioeconomic Pathway (SSP) scenarios [11]. This agreement is based on analyses that contrast century-long periods of SST variability between the two eras [12]. Examining these extended timescales helps to minimize the effects of internal variability, thereby enhancing the detection of signals induced by greenhouse gases. The improved representation of ENSO processes in CMIP6 models, including nonlinear feedback mechanisms, reinforces this consensus. It underscores the importance of ongoing model refinement to generate more reliable future forecasts [13]. Notably, the consensus also highlights an anticipated increase in ENSO SST variability and associated rainfall fluctuations, especially in scenarios that involve aggressive climate mitigation strategies.
4. Conclusions and Discussion
In summary, ENSO is a pivotal climate phenomenon whose reactions to global warming have significant implications. Characterized by its alternating El Niño and La Niña phases, ENSO is at the core of interannual climate variability. The oscillation between these warm and cold phases, reminiscent of the ocean's ebb and flow, has far-reaching effects on global weather patterns, ecosystems, and societies. Advanced climate models have further revealed two distinct types of ENSO: the Eastern Pacific (EP) and the Central Pacific (CP) types [2].
In the final analysis, data from the last two decades indicate that ENSO's amplitude has intensified [11]. Additionally, sea surface temperature (SST) variability and the frequency of Central Pacific-type El Niño events may increase in response to climate warming. However, there is some uncertainty surrounding the underlying reasons for the uptick in Central Pacific-type ENSO events and the strengthened amplitude of the phenomenon. Some theories suggest that this could be attributed to the multidecadal variability of ENSO rather than solely to climate change. As a result, ongoing research is essential to fully understand the implications of these changes for future climate patterns.
References
[1]. Celsius.M. (2016). Paris Agreement climate proposals need a boost to keep warming well below 2°C. Nature, 534(7609), 631-639.
[2]. Jia, F., Cai, W., Gan, B., Wu, L., & Di Lorenzo, E. (2021). Enhanced North Pacific impact on El Niño/southern oscillation under greenhouse warming. Nature Climate Change, 11(10), 840-847.
[3]. Latif, M., & Keenlyside, N. S. (2009). El Niño/Southern Oscillation response to global warming. Proceedings of the National Academy of Sciences, 106(49), 20578-20583.
[4]. Carvalho, D., Rafael, S., Monteiro, A., Rodrigues, V., Lopes, M., & Rocha, A. (2022). How well have CMIP3, CMIP5 and CMIP6 future climate projections portrayed the recently observed warming. Scientific Reports, 12(1), 11983.
[5]. Bjerknes, J. (1969). Atmospheric teleconnections from the equatorial Pacific. Monthly Weather Review, 97(3), 163-172.
[6]. Trenberth, K. E. (1997). The definition of El Niño. Bulletin of the American Meteorological Society, 78(12), 2771-2778.
[7]. Hu, S., & Fedorov, A. V. (2018). Cross-equatorial winds control El Niño diversity and change. Nature Climate Change, 8(9), 798-802.
[8]. Lyu, K., Zhang, X., Church, J. A., & Hu, J. (2016). Evaluation of the interdecadal variability of sea surface temperature and sea level in the Pacific in CMIP3 and CMIP5 models. International Journal of Climatology, 36(11), 3723-3740.
[9]. Chen, C., Cane, M. A., Wittenberg, A. T., & Chen, D. (2017). ENSO in the CMIP5 simulations: Life cycles, diversity, and responses to climate change. Journal of Climate, 30(2), 775-801.
[10]. Ren, H. L., & Jin, F. F. (2013). Recharge oscillator mechanisms in two types of ENSO. Journal of Climate, 26(17), 6506-6523.
[11]. Cai, W., Ng, B., Wang, G., Santoso, A., Wu, L., & Yang, K. (2022). Increased ENSO sea surface temperature variability under four IPCC emission scenarios. Nature Climate Change, 12(3), 228-231.
[12]. Alizadeh, O., Qadimi, M., Zolghadrshojaee, M., & Irannejad, P. (2022). Frequency of different types of El Niño events under global warming. International Journal of Climatology, 42(16), 9697-9709.
[13]. Fredriksen, H. B., Berner, J., Subramanian, A. C., & Capotondi, A. (2020). How does El Niño–Southern Oscillation change under global warming—A first look at CMIP6. Geophysical Research Letters, 47(22), e2020GL090640.
Cite this article
Zhu,D. (2024). The response to ENSO under global warming. Applied and Computational Engineering,56,186-192.
Data availability
The datasets used and/or analyzed during the current study will be available from the authors upon reasonable request.
Disclaimer/Publisher's Note
The statements, opinions and data contained in all publications are solely those of the individual author(s) and contributor(s) and not of EWA Publishing and/or the editor(s). EWA Publishing and/or the editor(s) disclaim responsibility for any injury to people or property resulting from any ideas, methods, instructions or products referred to in the content.
About volume
Volume title: Proceedings of the 4th International Conference on Materials Chemistry and Environmental Engineering
© 2024 by the author(s). Licensee EWA Publishing, Oxford, UK. This article is an open access article distributed under the terms and
conditions of the Creative Commons Attribution (CC BY) license. Authors who
publish this series agree to the following terms:
1. Authors retain copyright and grant the series right of first publication with the work simultaneously licensed under a Creative Commons
Attribution License that allows others to share the work with an acknowledgment of the work's authorship and initial publication in this
series.
2. Authors are able to enter into separate, additional contractual arrangements for the non-exclusive distribution of the series's published
version of the work (e.g., post it to an institutional repository or publish it in a book), with an acknowledgment of its initial
publication in this series.
3. Authors are permitted and encouraged to post their work online (e.g., in institutional repositories or on their website) prior to and
during the submission process, as it can lead to productive exchanges, as well as earlier and greater citation of published work (See
Open access policy for details).
References
[1]. Celsius.M. (2016). Paris Agreement climate proposals need a boost to keep warming well below 2°C. Nature, 534(7609), 631-639.
[2]. Jia, F., Cai, W., Gan, B., Wu, L., & Di Lorenzo, E. (2021). Enhanced North Pacific impact on El Niño/southern oscillation under greenhouse warming. Nature Climate Change, 11(10), 840-847.
[3]. Latif, M., & Keenlyside, N. S. (2009). El Niño/Southern Oscillation response to global warming. Proceedings of the National Academy of Sciences, 106(49), 20578-20583.
[4]. Carvalho, D., Rafael, S., Monteiro, A., Rodrigues, V., Lopes, M., & Rocha, A. (2022). How well have CMIP3, CMIP5 and CMIP6 future climate projections portrayed the recently observed warming. Scientific Reports, 12(1), 11983.
[5]. Bjerknes, J. (1969). Atmospheric teleconnections from the equatorial Pacific. Monthly Weather Review, 97(3), 163-172.
[6]. Trenberth, K. E. (1997). The definition of El Niño. Bulletin of the American Meteorological Society, 78(12), 2771-2778.
[7]. Hu, S., & Fedorov, A. V. (2018). Cross-equatorial winds control El Niño diversity and change. Nature Climate Change, 8(9), 798-802.
[8]. Lyu, K., Zhang, X., Church, J. A., & Hu, J. (2016). Evaluation of the interdecadal variability of sea surface temperature and sea level in the Pacific in CMIP3 and CMIP5 models. International Journal of Climatology, 36(11), 3723-3740.
[9]. Chen, C., Cane, M. A., Wittenberg, A. T., & Chen, D. (2017). ENSO in the CMIP5 simulations: Life cycles, diversity, and responses to climate change. Journal of Climate, 30(2), 775-801.
[10]. Ren, H. L., & Jin, F. F. (2013). Recharge oscillator mechanisms in two types of ENSO. Journal of Climate, 26(17), 6506-6523.
[11]. Cai, W., Ng, B., Wang, G., Santoso, A., Wu, L., & Yang, K. (2022). Increased ENSO sea surface temperature variability under four IPCC emission scenarios. Nature Climate Change, 12(3), 228-231.
[12]. Alizadeh, O., Qadimi, M., Zolghadrshojaee, M., & Irannejad, P. (2022). Frequency of different types of El Niño events under global warming. International Journal of Climatology, 42(16), 9697-9709.
[13]. Fredriksen, H. B., Berner, J., Subramanian, A. C., & Capotondi, A. (2020). How does El Niño–Southern Oscillation change under global warming—A first look at CMIP6. Geophysical Research Letters, 47(22), e2020GL090640.