


1.Introduction
Arable land is the foundation of a country’s food security. Currently, the structure of China’s arable land is continuously optimized and grain production is showing stable and positive trends. However, influenced by urbanization and the potential for higher profits from cash crops, some farmers might repurpose grain fields for other uses in pursuit of economic benefits. A Survey has indicated that the trend of “non-grain” use of China’s arable land is gradually expanding. Through field investigations combined with statistical data, this study preliminarily estimates that the current “non-grain” rate of China’s arable land is approximately 27%. The types and degrees of “non-grain” utilization vary across different regions of the country [1]. The issue of “non-grain” conversion can lead to a reduction in the area of land used for grain cultivation, threatening national food security and potentially having negative implications for the stable development of society.
Using traditional methods to monitor the “non-grain” use of arable lands requires significant manpower and time for on-site inspections and checks. With the advancement of remote sensing technology, it has been widely applied across various sectors including land resource surveys, ecological environment monitoring, hydrology, and water resources. Remote sensing has also demonstrated exceptional performance in areas like crop monitoring. Therefore, utilizing remote sensing technology for monitoring the “non-grain” use of arable lands can, in theory, significantly improve work efficiency, save resources, and reduce regulatory oversights.
Chen Shaogen and his team conducted an in-depth study on the issue of “non-grain” use of arable lands in Chengdu using imagery from Sentinel-2. They applied multi-temporal vegetation index analysis and object-oriented classification methods. However, they did not present the results of the object-oriented classification, nor did they utilize time-series NDVI values to extract vegetation from the study area [2]. Xu Chao and his colleagues, while using remote sensing to monitor the Baoji Gorge irrigation area, utilized various data derived from the calculations of time-series remote sensing image bands, including NDVI, NDWI, EVI, etc., to monitor the irrigation status of vegetation. They separated and analyzed the irrigation areas through the variation curve of NDVI for wheat in December of a year [3]. Zhou Xiajia further employed time-series NDVI analysis of remote sensing images to classify vegetation and wastelands and extracted the areas cultivated with double-cropped rice. Ultimately, using drone imagery with a higher resolution, the research corrected the results, accurately extracting the wasteland areas of the study region with a high accuracy rate [4]. All the above studies have demonstrated the feasibility and immense potential of remote sensing technology in monitoring plant cultivation and health status, providing theoretical and technical references for this research.
Starting with the current development of remote sensing technology and the trend of “non-grain” land use issues, this study explores the application of remote sensing imagery in arable land monitoring. Data from the Landsat 8-9 OLI/TIRS of the National Aeronautics and Space Administration’s (NASA) land satellite series was utilized as the imagery data source for this research. By examining the varying reflectance of different features in remote sensing bands, the research studied changes in arable lands. It employed multi-temporal comparisons to capture the seasonal trends of crops. With remote sensing band calculation techniques, the research extracted areas cultivated with rice and non-agricultural regions, obtaining distribution patterns for both areas. This provides data for subsequent analysis and monitoring of “non-grain” land use trends.
2.Research Area and Data Sources
2.1.Overview of the Research Area
The Nandu River, located in the belly of the Leizhou Peninsula in Guangdong, is the largest in the region. The downstream banks of the Nandu River consist of alluvial plains, with fertile soil. The Dongyang and Xiyang often referred to as the “granary of Leizhou,” comprises a contiguous paddy field of 220,000 mu located here. The Nandu River Basin is prone to heavy rainfall. Due to its gentle riverbed and tidal backflow, it frequently experiences flooding disasters [5]. Vast expanses of arable lands are distributed along both sides of the river, making it one of the largest main double-cropped rice production areas in Guangdong Province. With policy support, the grain output of this region has been steadily increasing year by year, showing a stable and positive trend [6, 7].
2.2.Data
This study selected Landsat 8-9 OLI/TIRS of the U.S. Landsat series as the image data source. This data source offers various advantages, including short revisit cycles, rich spectral bands, extensive coverage, and data sets with a large period. It has been extensively used in terrestrial observation, vegetation change monitoring, water system variation monitoring, and other fields. Once operated, Landsat 8 and Landsat 9 complete a full spectral imaging of the Earth’s equatorial regions every 16 days. The Operational Land Imager (OLI) and Thermal Infrared Sensor (TIRS) of both Landsat 8 and Landsat 9 offer users data across multiple bands, enabling user selection and application [8]. Additionally, data from this series is easily accessible, and timely, and can significantly improve work efficiency while reducing costs. The band data for Landsat 8 and Landsat 9 are shown in Table 1.
Table 1. Landsat 8-9 OLI/TIRS band information
|
Band Number |
Band Name |
Wavelength(μm) |
Resolution (meters) |
|
1 |
Coastal/Aerosol |
0.43 - 0.45 |
30 |
|
2 |
Blue |
0.45 - 0.51 |
30 |
|
3 |
Green |
0.53 - 0.59 |
30 |
|
4 |
Red |
0.64–0.67 |
30 |
|
5 |
Near-Infrared (NIR) |
0.85–0.88 |
30 |
|
6 |
Shortwave Infrared (SWIR) 1 |
1.57–1.65 |
30 |
|
7 |
Shortwave Infrared (SWIR) 2 |
2.11–2.29 |
30 |
|
8 |
Panchromatic |
0.50–0.68 |
15 |
|
9 |
Cirrus |
1.36–1.38 |
30 |
|
10 |
Thermal Infrared (TIRS) 1 |
10.60–11.19 |
100 |
|
11 |
Thermal Infrared (TIRS) 2 |
11.50-12.51 |
100 |
The data utilized in this paper is from the L2SP product level of Landsat 8 and Landsat 9. This type of product has undergone atmospheric correction and directly represents the surface reflectance. In the selected imagery from December 2020 to May 2022, most of the arable land areas on both sides of the Nandu River Basin were not obscured by clouds. Therefore, after cropping, the images can be directly used for analysis.
2.3.Research Methods
One of the most common methods for extracting data from NDVI time series is based on a threshold approach. It assumes that when the filtered or partially smoothed NDVI value exceeds a given threshold, the vegetation growing season begins. Conversely, when the value falls below the threshold, it indicates the season when the arable land is not being utilized [9, 10]. Based on the rice cultivation characteristics in the study area, this research acquired imagery from critical periods of rice planting and harvesting within the region, followed by pre-processing tasks such as cropping. The study utilized time-series NDVI for analysis, compared the NDVI variation curves of double-cropped rice, and obtained the change pattern of double-cropping rice in the study area. Band calculations were employed, using composite imagery from four quarters to extract the double-cropped rice cultivation areas, and composite imagery from six quarters to extract the non-agricultural areas. Finally, suspicious patterns and areas where rice has not been planted can be roughly identified through the result images.
2.3.1.Multi-temporal Vegetation Index Analysis. The chlorophyll in plant leaves has a distinct absorption and reflection spectrum compared to other features, especially evident in the near-infrared band. This research will use the NDVI calculated from the red and near-infrared bands as the foundation for subsequent analysis and classification extraction. NDVI (Normalized Difference Vegetation Index) is an index commonly used in the remote sensing field to assess surface vegetation coverage. NDVI calculation is based on the difference in reflectance of the Red and Near-Infrared (NIR) bands. This index is a crucial indicator reflecting the vitality and growth status of vegetation [11]. The formula for calculating the NDVI is as follows.
\( NDVI=\frac{(NIR-R)}{(NIR+R)}\ \ \ (1) \)
2.3.2.Farmland Extraction Through Band Calculation. After obtaining the NDVI variation curves for the double-cropped rice areas and non-agricultural regions, band calculations can be employed to extract other areas of double-cropped rice cultivation and non-agricultural lands within the study region.
Based on the distribution characteristics of NDVI within the study area, this paper set the extraction threshold for rice at 0.2. Detailed explanations can be found in Section 3.1. The formula for rice extraction in this region is as follows.
\( (NDVI1-NDVI2 \gt 0.2)(NDVI1 \gt 0.25)(NDVI3-NDVI4 \gt 0.2)(NDVI3 \gt 0.25)\ \ \ (2) \)
Considering the low vegetation coverage of non-agricultural lands within the study area, the threshold for band calculation formulas of non-agricultural zones in this region is set at 0.15. The formula is as follows.
\( (NDVI0 \lt 0.15)(NDVI1 \lt 0.15) (NDVI2 \lt 0.15) (NDVI3 \lt 0.15)(NDVI4 \lt \)
\( 0.15)(NDVI5 \lt 0.15))\ \ \ (3) \)
In the equation, NDVI0 represents the NDVI for the fourth quarter of 2020. NDVI1, NDVI2, NDVI3, and NDVI4 correspond to the NDVI values for the first through fourth quarters of 2021, respectively. NDVI5 denotes the NDVI for the first quarter of 2022.
3.Results
3.1.Long-term time series changes in crop growth
The study selected images from December 2020 to May 2022, encompassing two complete rice growth cycles. After performing NDVI band calculations on the processed Landsat 8 and Landsat 9 images and applying a series of denoising treatments, monthly NDVI images were obtained. This study chose remote sensing images of the main nodes of rice growth and extracted the rice planting areas and non-agricultural areas such as wasteland and buildings in the area.
Figure 1 shows the average NDVI changes for rice cultivation areas and non-agricultural land in the study area over the 12 months of 2021. As depicted in Figure 1, the NDVI changes in the rice planting area of the study region align with the characteristics of double-cropping rice. During the rice growing period, the average NDVI value in cultivated areas is always higher than 0.15, while the NDVI values in non-agricultural areas such as wasteland and buildings remain between 0.1 and 0.15. As evident from Figure 1, the NDVI values for the double-cropped rice cultivation areas in the research zone are higher (above 0.25) in the first and third quarters, while they are below 0.25 in the second and fourth quarters. The maximum difference in NDVI values between any two cultivation seasons exceeds 0.2.
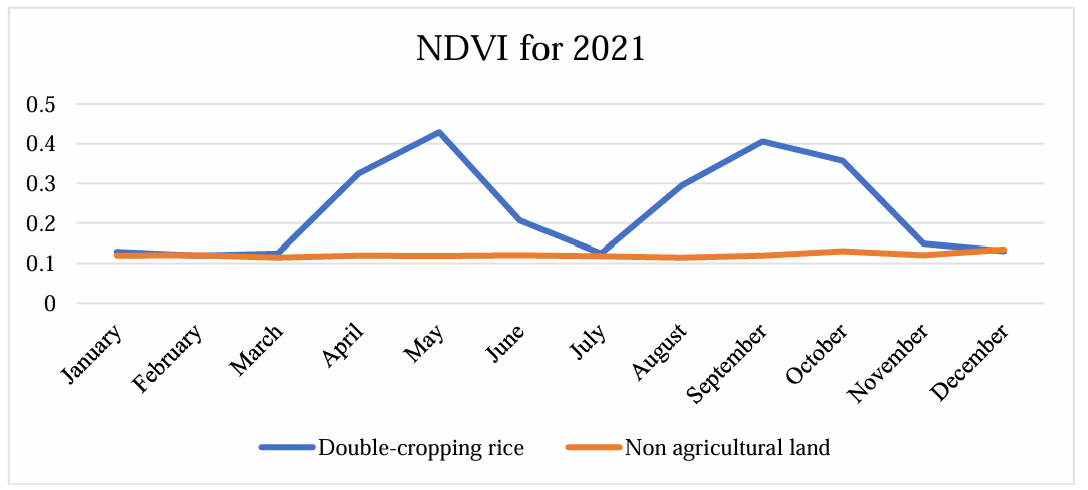
Figure 1. NDVI changes of double-cropping rice and non-agricultural land features in the study area in 2021
Figure 2(a-f) presents the NDVI images for six quarters, from the fourth quarter of 2020 to the first quarter of 2022, processed from a series of images. Through the six images depicted in Figure 2(a, b, c, d, e, f), the variations over these quarters predominantly match the NDVI curve changes for double-cropped rice in the study area as shown in Figure 1. Rice cultivation areas exhibit higher NDVI values in the first and third quarters (Figure 2(b, d, f)) and lower NDVI values in the second and fourth quarters (Figure 2(a, c, e)). Across the consecutive NDVI images over these six quarters, areas with anomalous NDVI value changes can be observed. For instance, pixels and areas that remain unchanged over multiple periods, excluding the regular non-agricultural areas such as water bodies, residential areas, and roads, may represent wastelands or unauthorized constructions. Plots that haven’t been categorized as double-cropped rice cultivation areas or non-agricultural regions might have been planted with single-cropped rice or possibly other crops.
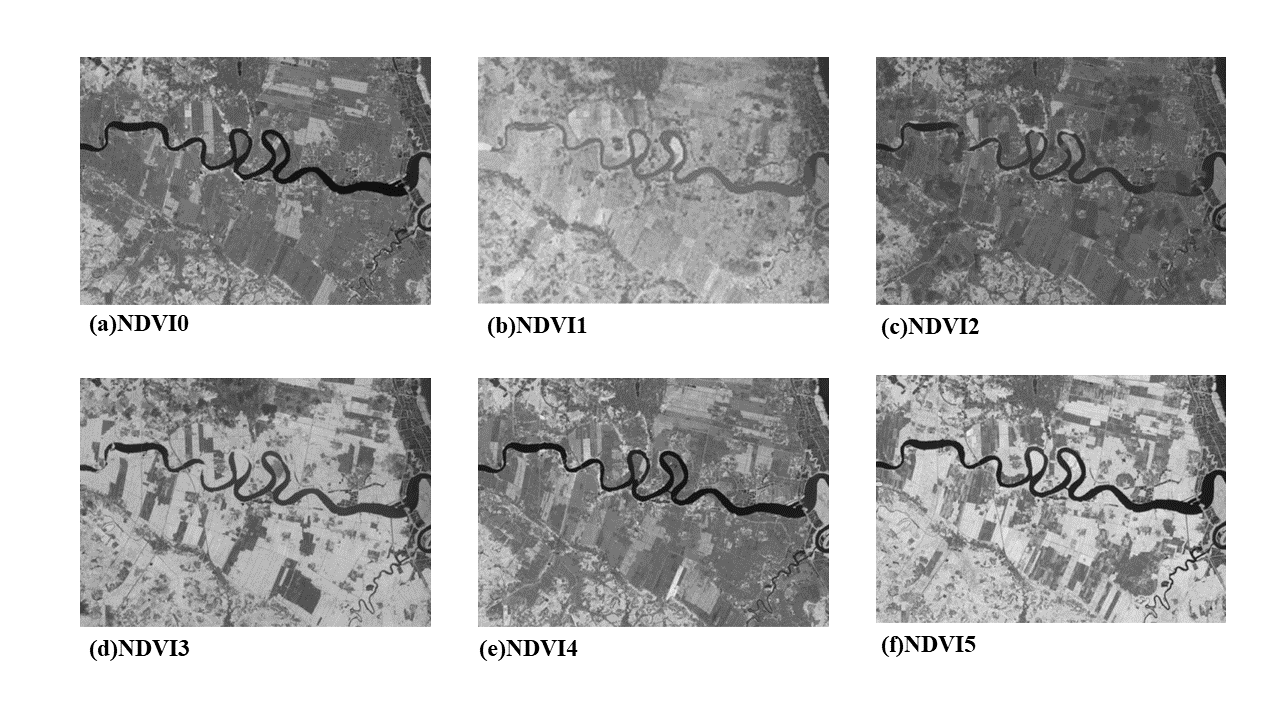
Figure 2. Quarterly NDVI data set
3.2.Area Extraction Through Band Calculations
Based on the growth patterns identified in Figure 1 and combined with the NDVI images from the four quarters of 2021, the study area’s rice cultivation regions were extracted using band calculations. Figure 3 displays the extraction results for rice planting areas in this region. As evident from the figure, a significant number of double-cropped rice cultivation areas are distributed along both banks of the Nandu River, and the vast majority of these areas are in normal condition.
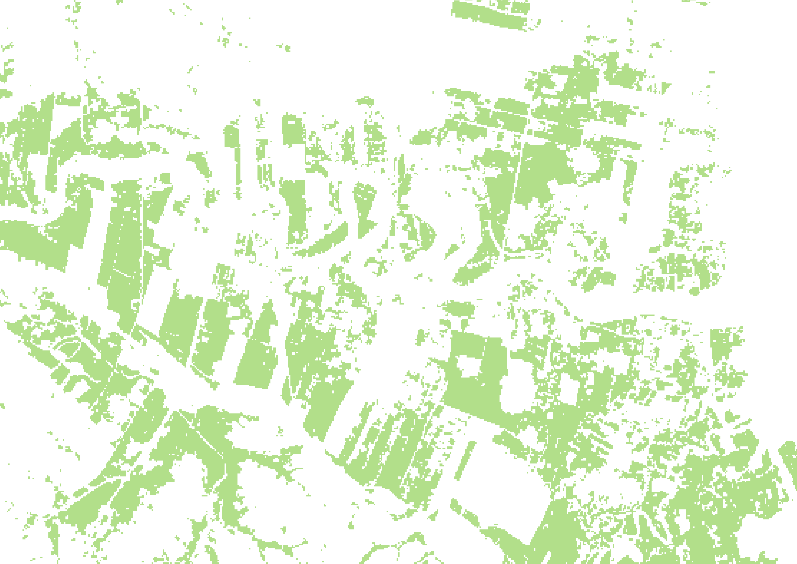
Figure 3. Extraction map of double-cropping rice planting areas
Areas where the NDVI values did not exceed 0.2 over multiple quarters were extracted using a non-agricultural area extraction formula. Figure 4 displays the extraction results, which include areas such as roads, buildings, rivers, and lakes. There is minimal overlap between the extracted areas and the rice cultivation regions. However, a few patches are located near the rice cultivation areas, which might represent unauthorized constructions or abandoned plots.
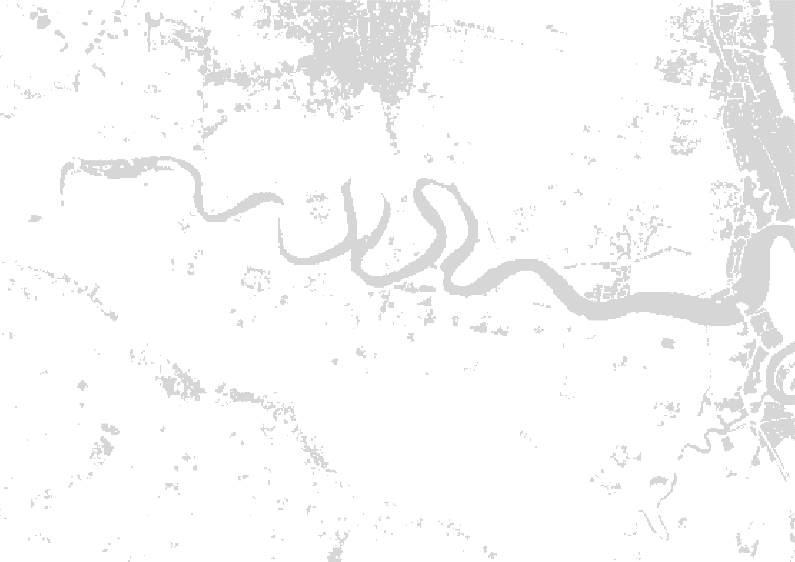
Figure 4. Non-agricultural area extraction map
The two images were superimposed onto an RGB image of the region for a particular quarter, resulting in Figure 5. As observed from Figure 5, some areas in the study region are neither covered by rice cultivation nor classified as non-agricultural areas. These areas might be planted with other crops. However, they could also be areas where rice was grown for just one season or regions affected by patchy clouds. Specific conditions require verification by inspection personnel based on relevant documents and on-site investigation.
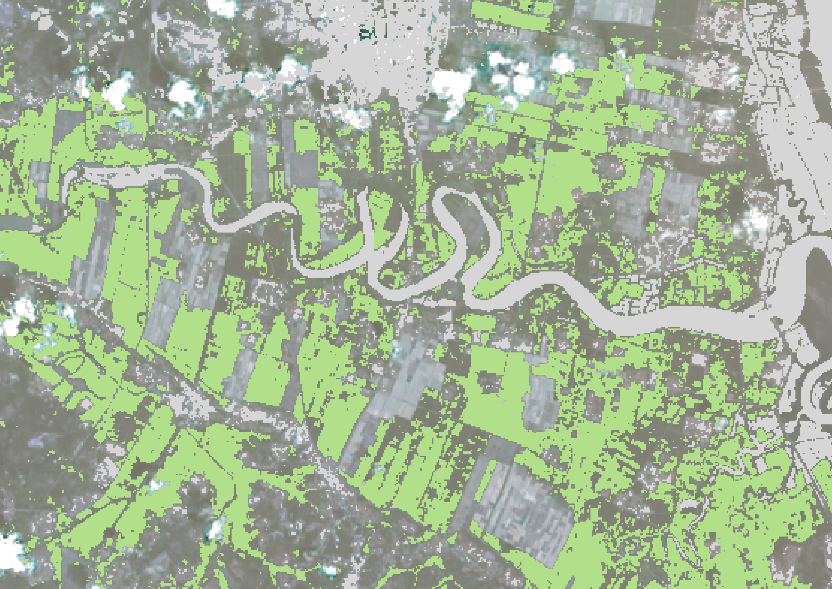
Figure 5. Regional composite map
4.Discussion
This study utilizes remote sensing satellite images from Landsat-8 and Landsat-9 as data sources to monitor the rice cultivation areas along both banks of the Nandu River, aiming to explore the potential of remote sensing technology in this direction. The research employed time-series remote sensing images and band calculations to extract paddy fields cultivated with rice. Simultaneously, non-agricultural areas were also extracted to monitor suspicious patches distributed near the paddy fields.
By using remote sensing technology for monitoring, only a few simple steps are required to rapidly and effectively extract areas for analysis. Compared to traditional on-site investigations, this method takes less time and offers a more intuitive view of the distribution of different areas on the map, providing results for subsequent analysis. However, the method used in this study will be affected by many factors when extracting regions. These include lighting, cultivation decisions, cloud cover, etc., resulting in reduced accuracy of processing results.
This study employed remote sensing technology to complete the extraction and elimination processes in cultivated land supervision and protection. However, to achieve higher precision results, in addition to relying on object-oriented classification and deep neural networks for detailed feature classification, it is also essential to carry out verification and validation of cultivated land protection. Using platforms like ArcGIS and based on positioning services, verifiers can precisely locate suspicious areas for visits and photography. Finally, by integrating administrative data and archival records, the nature and conditions of land usage can be verified, thereby reducing fieldwork and increasing work efficiency [12].
5.Conclusion
This study employed images from six consecutive quarters, extracting rice cultivation and non-agricultural areas along both banks of the Nandu River based on NDVI analysis and band calculations. An analysis of these regions was conducted to explore rapid and effective monitoring methods. The experiments in this study led to the following conclusions:
1) Multi-temporal satellite remote sensing images, through NDVI and band calculations, can accurately extract the planting range of crops with specific growth cycles in a region, and obtain relatively clear boundaries.
2) The study area, the Nandu River basin, has vast rice cultivation areas along both banks. The “non-grain” issue in this region is not pronounced; however, there are some suspicious patches and areas suspected of cultivating other crops that deserve attention.
3) Remote sensing technology demonstrates good applicability in monitoring the “non-grain” issue of cultivated lands. Compared to traditional manual investigations, this technology is efficient and fast. It can help the government and relevant agencies save manpower and resources.
The aforementioned research results indicate that the monitoring method based on time-series remote sensing images can provide a preliminary survey scope for the agricultural sector and offer a scientific basis for subsequent analyses. Additionally, China has paid significant attention to food security in recent years, leading to the introduction of numerous related policies to ensure the cultivated area of grain fields. Remote sensing monitoring allows areas that lack manpower or have transportation difficulties to promptly obtain information about the cultivation zones, assisting in policy implementation. In summary, the potential of remote sensing in cultivated land monitoring is substantial, and it’s a technology that deserves attention and development.
References
[1]. Kong X 2020 Non-grain issues of cultivated land, causes, and countermeasures China Land 11 pp 17-19
[2]. Chen S, Chen B, He Y, Ma Y, and Qiu S 2023 Research on remote sensing monitoring and application of “Non Grain” cultivated land Geomatics & Spatial Information Technology 46(6) pp 132-135
[3]. Xu C, Lyu J, Liu Y, et al 2022 Remote sensing monitoring method of cultivated land irrigation area in Baojixia Irrigation District based on GEE Journal of Drainage and Irrigation Machinery Engineering (JDIME) 40(11) pp 1167-1172
[4]. Zhou X 2023 Application research on remote sensing monitoring of cultivated land abandoned in hilly area Remote Sensing for Natural Resources
[5]. Zhanjiang Local Chronicles Compilation Committee 2004 Zhanjiang Municipal Chronicles Zhonghua Book Company
[6]. Leizhou Survey Team of the National Bureau of Statistics, Leizhou Bureau of Statistics, 2021, 2020 Leizhou National Economic and Social Development Statistical Bulletin
[7]. Leizhou Survey Team of the National Bureau of Statistics, Leizhou Bureau of Statistics, 2022, 2021 Leizhou National Economic and Social Development Statistical Bulletin
[8]. U.S. Geological Survey 2015 Landsat—Earth Observation Satellites https://doi.org/10.3133/fs20153081
[9]. Lloyd D 1990 A phenological classification of terrestrial vegetation cover using shortwave vegetation index imagery Int. J. Remote Sens. 11 pp 2269-79
[10]. Reed B C , Brown J F ,VanderZee D , Loveland T R , Merchant J W and Ohlen D O 1994 Measuring phenological variability from satellite imagery J. Veg. Sci. 5 pp 703-714
[11]. Rouse, J W , Haas,R H, Schell J A, andDeering D W 1973 Monitoring vegetation systems in the Great Plains with ERTS Third ERTS Symposium NASA SP-351 I pp 309-317
[12]. Wang, X 2023 Thoughts on remote sensing inspector of cultivated land protection in new period Urban Geotechnical Investigation & Surveying 4 pp117-119
Cite this article
Wen,C. (2024). Remote sensing monitoring and application research on the "Non Grain" cultivated land of arable lands in the Nandu River Basin. Applied and Computational Engineering,60,177-184.
Data availability
The datasets used and/or analyzed during the current study will be available from the authors upon reasonable request.
Disclaimer/Publisher's Note
The statements, opinions and data contained in all publications are solely those of the individual author(s) and contributor(s) and not of EWA Publishing and/or the editor(s). EWA Publishing and/or the editor(s) disclaim responsibility for any injury to people or property resulting from any ideas, methods, instructions or products referred to in the content.
About volume
Volume title: Proceedings of the 4th International Conference on Materials Chemistry and Environmental Engineering
© 2024 by the author(s). Licensee EWA Publishing, Oxford, UK. This article is an open access article distributed under the terms and
conditions of the Creative Commons Attribution (CC BY) license. Authors who
publish this series agree to the following terms:
1. Authors retain copyright and grant the series right of first publication with the work simultaneously licensed under a Creative Commons
Attribution License that allows others to share the work with an acknowledgment of the work's authorship and initial publication in this
series.
2. Authors are able to enter into separate, additional contractual arrangements for the non-exclusive distribution of the series's published
version of the work (e.g., post it to an institutional repository or publish it in a book), with an acknowledgment of its initial
publication in this series.
3. Authors are permitted and encouraged to post their work online (e.g., in institutional repositories or on their website) prior to and
during the submission process, as it can lead to productive exchanges, as well as earlier and greater citation of published work (See
Open access policy for details).
References
[1]. Kong X 2020 Non-grain issues of cultivated land, causes, and countermeasures China Land 11 pp 17-19
[2]. Chen S, Chen B, He Y, Ma Y, and Qiu S 2023 Research on remote sensing monitoring and application of “Non Grain” cultivated land Geomatics & Spatial Information Technology 46(6) pp 132-135
[3]. Xu C, Lyu J, Liu Y, et al 2022 Remote sensing monitoring method of cultivated land irrigation area in Baojixia Irrigation District based on GEE Journal of Drainage and Irrigation Machinery Engineering (JDIME) 40(11) pp 1167-1172
[4]. Zhou X 2023 Application research on remote sensing monitoring of cultivated land abandoned in hilly area Remote Sensing for Natural Resources
[5]. Zhanjiang Local Chronicles Compilation Committee 2004 Zhanjiang Municipal Chronicles Zhonghua Book Company
[6]. Leizhou Survey Team of the National Bureau of Statistics, Leizhou Bureau of Statistics, 2021, 2020 Leizhou National Economic and Social Development Statistical Bulletin
[7]. Leizhou Survey Team of the National Bureau of Statistics, Leizhou Bureau of Statistics, 2022, 2021 Leizhou National Economic and Social Development Statistical Bulletin
[8]. U.S. Geological Survey 2015 Landsat—Earth Observation Satellites https://doi.org/10.3133/fs20153081
[9]. Lloyd D 1990 A phenological classification of terrestrial vegetation cover using shortwave vegetation index imagery Int. J. Remote Sens. 11 pp 2269-79
[10]. Reed B C , Brown J F ,VanderZee D , Loveland T R , Merchant J W and Ohlen D O 1994 Measuring phenological variability from satellite imagery J. Veg. Sci. 5 pp 703-714
[11]. Rouse, J W , Haas,R H, Schell J A, andDeering D W 1973 Monitoring vegetation systems in the Great Plains with ERTS Third ERTS Symposium NASA SP-351 I pp 309-317
[12]. Wang, X 2023 Thoughts on remote sensing inspector of cultivated land protection in new period Urban Geotechnical Investigation & Surveying 4 pp117-119