


1. Introduction
Many cities around the globe are expanding as people move in for opportunities and better living conditions. As new houses, apartments, parks, schools, shopping centers, and recreational parks are being built rapidly for immigrants, city administrations need to optimize and regulate how lands are used to avoid inefficient use of land or adverse effects on the environment [1].
This regulation process heavily relies on quality data on city land. Unplanned or incorrectly planned city expansion such as what occurred in Wilmington DE, not only leads to financial loss but also causes political issues [2]. In the 1970s, the city was not planned properly for construction of Interstate 95. Thousands of residents were displaced for rebuilding, however, a civic center at French Street was never built as planned. And the city center has been falling ever since. As a result, citizens of Willington have been raising questions on the government about urban planning leading to political arguments in the city for many years. Similar disasters in city planning in other cities also introduced political fights. To meet the demands of city planning, in recent years, cities across the globe have been allocating resources for urban planning. Innovative technologies including remote sensing are employed for city planning.
It is very important to know the current information on land use in the city as detailed as possible before city planning. There are two general approaches for obtaining the data: traditional surveys and remote sensing. Traditional surveying techniques use a line-of-sight between the instrument and a roving surveyor[2]. The limitations of traditional surveying techniques are a surveyor needs to see over whole surveyed areas on the ground, the areas are normally measured one by one and the information is assembled together. Traditional surveying techniques are both time-consuming and resource-consuming and cannot be conducted fast enough for city planning. Also, traditional surveying techniques involve personnel sent to the field heavily therefore errors and mistakes cannot be avoided. Even though traditional surveying techniques are still being used for small land lots for specific purposes, they are not suitable for collecting data on large areas such as a whole city.
As remote sensing technology becomes popular and affordable, it has been adopted to replace traditional surveying techniques for city planning. Remote sensing is the process of detecting and monitoring the physical characteristics of an area by measuring its reflected and emitted radiation at a distance[3]. Two main advantages of remote sensing over traditional survey methods are efficiency and additional information. First, flying over the surveyed land, drones or satellites can obtain information for a whole city in hours as compared to months by traditional surveying techniques. The information collected by remote sensing can be processed by computer quickly and give the users almost a real-time picture of the city. So that the decision-makers can move forward quickly to set policies and regulations. Moreover, no personnel need to be sent to the field and therefore, human errors are minimized as data is collected and processed by computer. Overall, remote sensing saves time and money and therefore increases the efficiency of data collection and processing.
In addition, remote sensing provides valuable information that cannot be obtained otherwise. For example, colors can be monitored by remote sensing giving more information on the objects in the fields that cannot be obtained by traditional survey methods. So that dead trees can be identified by colors[4]. The authority can decide either to replant them or replace them with buildings[5]. It is also easy to locate flood routes in the city in case of heavy rains. So that buildings would not be constructed in the flood path. And maybe a park with a river path should be considered for the planning of the flood zone. It is almost impossible to collect such information by traditional survey methods.
The population of Burlington has steadily increased since 2000 demanding more facilities[6]. The city authorities urgently need accurate and detailed data on land use for planning and approving new constructions and reconstructing outdated buildings. The city which used traditional survey methods for the past decades recently turned to remote sensing [7] for data collection. Therefore, this paper uses Burlington, Vermont as an example to study how remote sensing technology changes city planning.
2. Method
2.1. Study Area
As shown in Figure 1, Burlington is the largest city in Vermont and the county seat of Chittenden County. Burlington area is made of mountains, lakes, and valleys with abundant trees, fish, and other natural resources. It is cold in the winter but cool in the summer. The Burlington area has been expanding due to the ever-increasing population in recent years. Therefore, data is needed to estimate how the environment changes in the area so that regulators can plan for the city expansion.
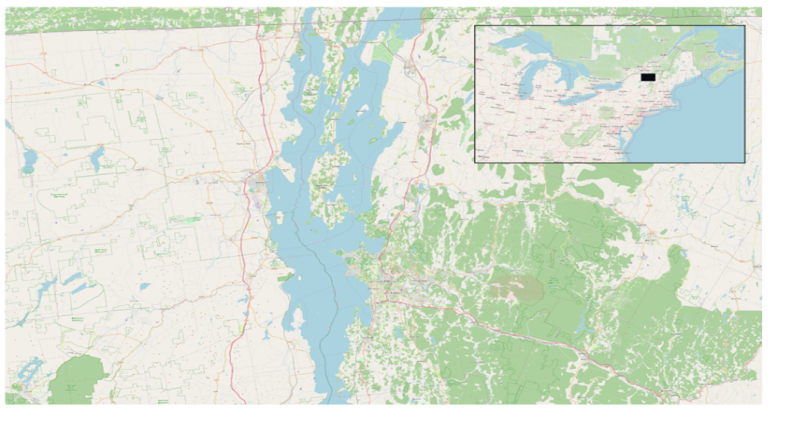
Figure 1. Overview Map of the study area
2.2. Data
The data collected in the current study was from Landsat 8 and 9, and from the year 2015 to the year 2023. The Landsat Missions are executed by eight Earth-observing operational satellites that carry remote sensors to collect data and image our planet as a part of the U.S. Geological Survey (USGS) National Land Imaging (NLI) Program. The easily accessible Landsats have been used heavily to investigate the changes of the Earth over time. Satellite data were obtained using various light bands for the Burlington VT area from the year 2015 to the current year 2023. The specific location parameters are 44° 28' 33.1788'' N, 73° 12' 43.4664'' W.
Digital Elevation Model (DEM) creates images to represent the bare ground (bare earth) topographic surface of the Earth excluding surface objects such as trees and buildings.
2.3. Method
Human activities and city expansion can be measured by Normalized difference vegetation index (NDVI) which is a graphical indicator for analyzing whether the target being observed contains green health vegetation or not. NDVI is calculated with the following equation: NDVI = (NIR-Red) / (NIR+Red), where NIR is near-infrared light and Red is visible red light. When human activities are present in an area, the vegetation is destroyed to make room for buildings, roads, and other facilities and therefore will show in the NDVI analysis. In addition, NDVI can also monitor lake water levels because the water and land are shown in different colors in NDVI.
3. Result and Discussion
3.1. Analysis based on the band ratio
True-color bands use red, green, and blue while False-color bands use at least one wavelength outside the visible range or some other type of data but the data were shown on the screen by color after computer processing[8]. Figures 2 (a) and (b) are images using a Semi-Automatic classification plug-in to create a true-color band. Band 5/4/3 is a classical combination of bands that highlight vegetation (Figure 3). These figures inform one of the landscape changes such as the reduction of lakes and reservoirs. The current data showed that the lake's shape has changed dramatically from 2015 to 2023. For example, it appears that the southern part of the lake has become narrower. On the other hand, the northern part of the lake becomes wider. One possibility was that sediment accumulation changed how water was distributed through the lake[9]. In addition, the wasteland areas (grey areas) along the lake have been decreasing from 2015 to 2023 probably due to new constructions built for new immigrants.
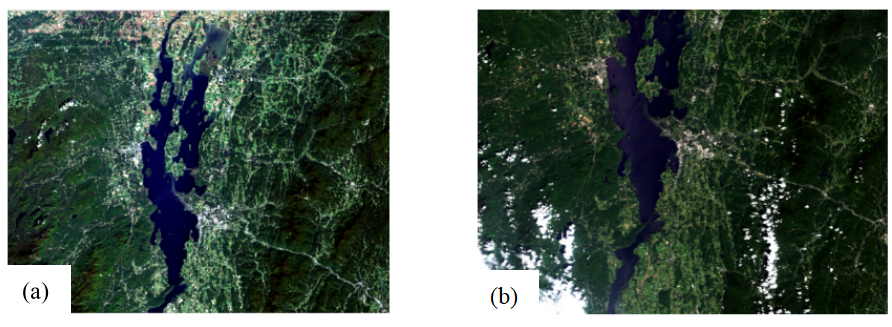
Figure 2. Ture color band: (a) is on 2015 June;(b) is on 2023 July.
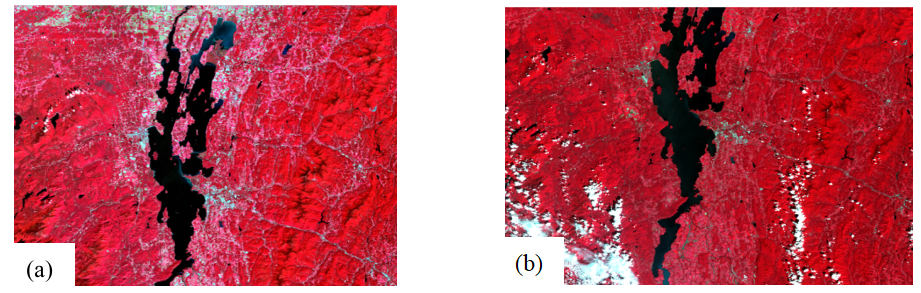
Figure 3. False color band: (a) is on 2015 June;(b) is on 2023 July.
3.2. Analysis of the changes in the study area
Table 1. Changes between mountain, lake, and urban areas
CrossClass Code | New Class | Reference Class | Pixel Sum | Area (meter^2) |
Lake area | 1 | 2 | 202,797 | 182,517,300 |
Mountain | 2 | 1 | 30,780 | 27,702,000 |
Urban area | 3 | 2 | 4585837 | 4127253300 |
Table 1 shows the changes between mountain, lake, and urban areas. The satellite DEM data showed that there are 202,797-pixel blocks equivalent to 182,517,300 square meters that have undergone changes indicating mountain-to-lake transition while 30,780-pixel blocks equivalent to 27,702,000 square meters have undergone the opposite change, during the years 2015 to 2023. The water levels are influenced by two main factors: precipitation and human activities. It is concerning that the water levels of some lakes have decreased year by year, exposing the mountain part. Since the precipitation in the area seemed to be similar through the years, human activities may have drained some lakes. For example, some roads may have blocked the flow of the streams and decreased the total inflows of some lakes. Therefore, researchers should monitor the decreasing water levels of the lakes closely to ensure that the city expansion does not affect the lakes. This is especially important for Lake Champlain- the mother lake of Burlington. It provided the water resource for people and factories in the area. Its conditions greatly influence the future of the city.
The satellite images at different bands (Figure 4) also showed that, from the year 2015 to the year 2023, there are 4585837-pixel blocks equivalent to 4127253300 square meters that have undergone the change from mountainous areas to urban areas. This indicates that immigrants occupied the mountains for a living since the room has run out in the valley and around Lake Champlain. The roads, facilities, and utilities have been built for the residents in the mountains. These new changes may change the landscape and water flows in the mountains and may influence the water levels in the lakes. It would be interesting to correlate the decrease or increase of the water levels of the lakes to the urban expansion in the same area to see how human activities influence the local environments[10]. If the correlation can be established statistically, one can conclude that human immigration has affected the water levels in some lakes in the area. With that knowledge, the city regulator could control where people can settle in the mountains and maybe keep some areas clear for the protection of the environment. After the regulations were executed, researchers could monitor the water levels and city expansion yearly in the future to ensure that the city made the appropriate decision for urban expansion. The public would be also convinced by the strong data support.
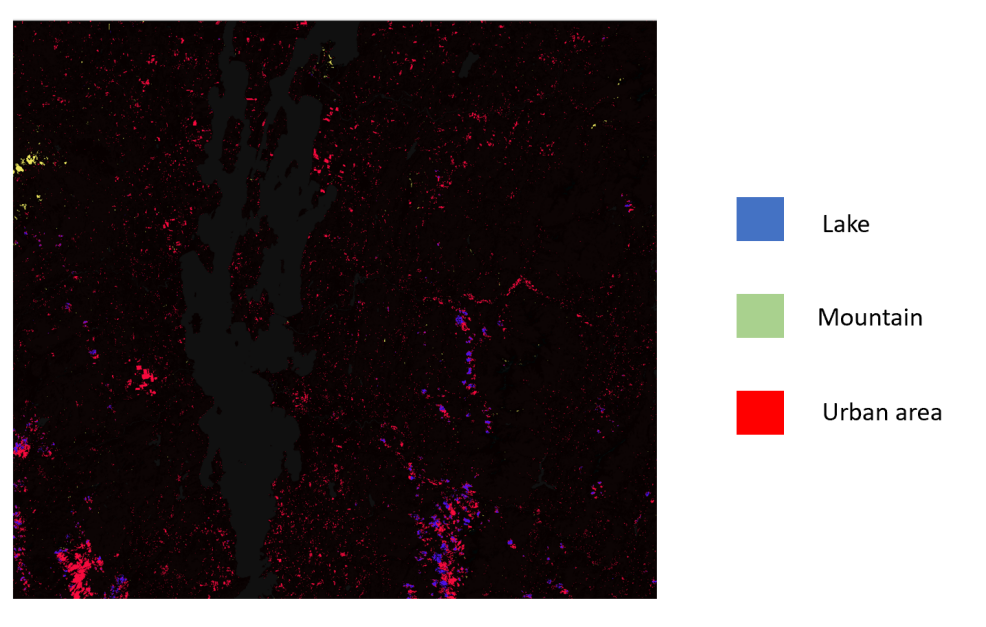
Figure 4. Satellite images illustrating lake, mountain, and urban areas of Burlington
Overall, remote sensing has provided valuable and instant data to evaluate how city expansion influences the local environment. Because of the use of satellite-based remote sensing, regulators now can make decisions supported by scientific data.
4. Conclusion
Remote sensing technology provides a broad overview of seismic activity, covering vast areas and providing key data for early detection and monitoring. Remote sensing plays a key role in identifying potential earthquake precursors, from surface deformation to changes in water tables, temperature changes, and geomagnetic anomalies. The efficiency of remote sensing, especially in hard-to-reach locations, offers greater advantages over traditional seismic tools.
The current study used remote sensing to study the changes in the water levels of lakes and urban expansion around the Burlington Vermont area. The results from the satellite images showed that some water levels of lakes have dropped significantly during the years from 2015 to 2023. At the same time frame, people have moved into the mountainous areas around the old city expanding the urban area. The limitation of the study is that the correlation between the two changes stated above was studied so it is unknown if the drop in the water levels was caused or not caused by the increased human activities in the same area.
Therefore, one should overlay the changes in water level and human activities on the same map to see if they are overlapped. If the changes are overlapped on the map, a hypothesis could be generated that human activities lead to decreased water levels in the Burlington area. This hypothesis could be tested by introducing or eliminating some human activities in some designated areas and monitoring the change in the water level in the nearby lakes. The hypothesis, if supported by the data, could influence how the city expansion is regulated by the city government. It would be sensible for the regulator to limit the number of populations in each area so that water would not be depleted. Since water is so essential and people care about water in life. With the progress of technology, urban expansion can be restricted by regulating residential and industrial construction in the future to avoid the reduction of water area. At the same time, remote sensing technology can be fully utilized to detect the water area changes year by year.
References
[1]. Pipitone C, Maltese A, Dardanelli G, Lo B M, La L G 2018 Monitoring Water Surface and Level of a Reservoir Using Different Remote Sensing Approaches and Comparison with Dam Displacements Evaluated via GNSS Remote Sens. 10 p 71
[2]. Boori M S, Netzband M, Choudhary K 2015 Monitoring and modeling of urban sprawl through remote sensing and GIS in Kuala Lumpur, Malaysia. Ecol Process 4 p 15
[3]. Winter T C, Harvey JW, Franke O L, and Alley W M 1998 Ground water and surface water: A single resource. U.S. Geological Survey 1139
[4]. Dai W and Dai W Z 2019 IOP Conf. Ser.: Earth Environ. Sci. 227 052004
[5]. Talen E 2012 City Rules: How Urban Regulations Affect Urban Form. Island Press.
[6]. Delaware Online 2023 Wilmington, Delaware: How Did Urban Planning Failure Impact Black Community? https://www.delawareonline.com/story/opinion/2023/09/07/wil mington-delaware-how-did-urban-planning-failure-impact-black-community/70775119007/
[7]. Science technology 2022 What is remote sensing and what is it used for? https://www.usgs.gov/faqs/what-remote-sensing-and-what-it-used
[8]. Kala S 2018 An algorithm for generating natural color images from false color using spectral transformation technique with higher polynomial order. Isprs - International Archives of the Photogrammetry Remote Sensing and Spatial Information Sciences. XLII-5 pp 643-648
[9]. Bennett K, Buck C E 2016 Interpretation of lake sediment accumulation rates The Holocene 26(7)pp 1092-02
[10]. Bernard A E, Laurent M A, Jeroen D L2015 Modeling the impacts of urbanization on lake water level using L-THIA Urban Climate 14(4) pp 578-585
Cite this article
Li,H. (2024). Monitoring of urban expansion in Burlington based on remote sensing data. Applied and Computational Engineering,61,66-71.
Data availability
The datasets used and/or analyzed during the current study will be available from the authors upon reasonable request.
Disclaimer/Publisher's Note
The statements, opinions and data contained in all publications are solely those of the individual author(s) and contributor(s) and not of EWA Publishing and/or the editor(s). EWA Publishing and/or the editor(s) disclaim responsibility for any injury to people or property resulting from any ideas, methods, instructions or products referred to in the content.
About volume
Volume title: Proceedings of the 4th International Conference on Materials Chemistry and Environmental Engineering
© 2024 by the author(s). Licensee EWA Publishing, Oxford, UK. This article is an open access article distributed under the terms and
conditions of the Creative Commons Attribution (CC BY) license. Authors who
publish this series agree to the following terms:
1. Authors retain copyright and grant the series right of first publication with the work simultaneously licensed under a Creative Commons
Attribution License that allows others to share the work with an acknowledgment of the work's authorship and initial publication in this
series.
2. Authors are able to enter into separate, additional contractual arrangements for the non-exclusive distribution of the series's published
version of the work (e.g., post it to an institutional repository or publish it in a book), with an acknowledgment of its initial
publication in this series.
3. Authors are permitted and encouraged to post their work online (e.g., in institutional repositories or on their website) prior to and
during the submission process, as it can lead to productive exchanges, as well as earlier and greater citation of published work (See
Open access policy for details).
References
[1]. Pipitone C, Maltese A, Dardanelli G, Lo B M, La L G 2018 Monitoring Water Surface and Level of a Reservoir Using Different Remote Sensing Approaches and Comparison with Dam Displacements Evaluated via GNSS Remote Sens. 10 p 71
[2]. Boori M S, Netzband M, Choudhary K 2015 Monitoring and modeling of urban sprawl through remote sensing and GIS in Kuala Lumpur, Malaysia. Ecol Process 4 p 15
[3]. Winter T C, Harvey JW, Franke O L, and Alley W M 1998 Ground water and surface water: A single resource. U.S. Geological Survey 1139
[4]. Dai W and Dai W Z 2019 IOP Conf. Ser.: Earth Environ. Sci. 227 052004
[5]. Talen E 2012 City Rules: How Urban Regulations Affect Urban Form. Island Press.
[6]. Delaware Online 2023 Wilmington, Delaware: How Did Urban Planning Failure Impact Black Community? https://www.delawareonline.com/story/opinion/2023/09/07/wil mington-delaware-how-did-urban-planning-failure-impact-black-community/70775119007/
[7]. Science technology 2022 What is remote sensing and what is it used for? https://www.usgs.gov/faqs/what-remote-sensing-and-what-it-used
[8]. Kala S 2018 An algorithm for generating natural color images from false color using spectral transformation technique with higher polynomial order. Isprs - International Archives of the Photogrammetry Remote Sensing and Spatial Information Sciences. XLII-5 pp 643-648
[9]. Bennett K, Buck C E 2016 Interpretation of lake sediment accumulation rates The Holocene 26(7)pp 1092-02
[10]. Bernard A E, Laurent M A, Jeroen D L2015 Modeling the impacts of urbanization on lake water level using L-THIA Urban Climate 14(4) pp 578-585