


1. Introduction
In modern society, social media has become an indispensable part of our lives. Work, education, and nearly every aspect of our lives has transformed as social media burgeons. Everyone was allowed to share their knowledge, experience, emotions, and opinions with the public, seen by people having similar interests. Social media shortens the connecting distance between people and provides an extensive database of information people share. Individuals can easily find different information they want on social media and connect with different kinds of people.
Social media, at the same time benefiting the users, also causes a bunch of new problems, for example, the spread of hate speech. In the past, hateful words spoken by a person could not spread worldwide, but it is possible now. The spread of free speech enables people with the same dissatisfaction to connect and organize for parades and even horrible violence that unrest societal stability. Through no violence coming up, kids or youths and even adults that have not had comprehensive minds or complete understanding of an event will implicitly be misled by enthusiastically hateful users and gradually become new hate infectors.
Hate speech has long been contentious, with one side advocating free speech and the other side against it because of the current and potentially notorious influence on the stability of the society. In the United States, hate speeches are allowed in most social media, but with some policies by individual social media against its spread. Despite these effects on offensive content, spreading hate is still not an entrenched problem in nearly all social media platforms. That is why an effective approach to detecting and predicting the spread of hate speech is worthwhile to research.
There are numerous papers on detecting hate speeches on social media, from calculating the offensiveness of sentences according to syntactic features to using deep learning to detect hate speech [1-2]. These researches focus more on hate detection and classification in posts using natural language processing models, but few are about the spread of hate speech. Although some work was on the retweet graph and research on the spread of hate speech, they focus more on finding hateful users using DeGroot's model [3-4]. So, there is a big gap in characterizing the network features of hate speech diffusion and how to predict the spread of hate speech. Understanding the spread of hate speech is crucial because it provides insights into how harmful content gets a wider audience so policymakers can develop constructive strategies against hate speech.
The research questions are:
RQ1: What are some network structural features of hate speech diffusion? What decides the spreading ability of each node?
This research used the retweets in hateful users to research the hate speech diffusion in hateful user groups. By looking into the connectivity, degree distribution, and centralities, a better understanding of the network structural features of hate speech diffusion could be made. Constructing a retweet graph from a hateful user called a single-spot hate spread graph and analyzing the network would evaluate the spreading ability of each node.
RQ2: What could be the approximate probability of retweeting a post of others in a hateful user group? How much difference is there between an approximate Erdos-Renyi Graph and the hate-spread retweet graph from a random hateful user?
Building up the Erdos-Renyi graphs to approximate the retweet graph from a hateful user could be used to find an estimated probability of retweeting. The most approximate Erdos-Renyi graph could be made by controlling the node number and the edge number.
And the study used Twitter as my data source. Twitter stands out among various social networks as a prominent and crucial platform for research due to its real-time nature and significant data availability [5]. With its succinct message format and unfiltered content stream, Twitter's popularity has surged, particularly during events, with approximately 500 million daily tweets, often featuring news ahead of traditional media sources, so Twitter could provide variable, realistic, and massive data for me. Retweeting has emerged as a pivotal method for disseminating information on Twitter. Investigating the mechanics of retweeting is crucial for comprehending information propagation within the platform [6]. Moreover, Twitter has long been denounced for not effectively handling discrimination and instigating violence that even causes real damage and injury, although with the policy on hateful content. Therefore, Twitter's retweet network in hateful users could be noteworthy to research about the spread of hate speech.
2. Literature Review
Recent years have seen an increasing notice of hate speech in research. However, most papers focus on detecting hateful users through tweets' contents and classifying using natural language processing and deep learning. There have been researchers trying multiple ways, including different languages, machine learning models, and algorithms, to detect different labels of hate speech on various platforms [7]. The early research by Chen et al. came up with Lexical Syntactic Features to detect abusive language in YouTube comments [1]. Dinakar et al. [8] then adopt a commonsense knowledge base under supervised SVM in Cyberbullying detection. They used TF-IDF (Term Frequency - Inverse Document Frequency), lexicon, POS (Part-of-speech)-bigrams, and topic-specific unigrams or bigrams as features, which are also commonly used in later research. With the development of the neural network, there emerges a spurt in natural language processing models using neural networks and deep learning, like LSTM (long short-term memory networks), CNN (convolutional neural networks), BERT (Bidirectional Encoder Representations from Transformers). For example, Badjatiya et al. tried a bunch of deep-learning models for the detection of hateful tweets on Twitter [2]. Through the rapid update and improvement of the machine learning model, the detection accuracy of hate speech has been greatly enhanced recently.
Detecting hate speech is critical, but how these hate speeches originated and spread through social media is also worthy of research. It is common for individuals to have negative thoughts and words about others, but social media platforms proliferate the hate, inform people with similar penchants, and incite violence as a gang a possible thing. DeGroot's information diffusion model was applied to predict hateful users in repost networks of Gab, a social media [3]. The model converts the directed repost edge weights into the probability network of briefs, so if a user highly believes a hateful user, the user is potentially hateful. Researchers collected data from Twitter constructs retweets graph implements DeGroot's model with new attempts of using the lexicon in the initialization of a brief network [4]. These two articles investigated the hate speech network but focused more on how to characterize hateful users instead of the diffusion of hate speech. Masud et al. proposed a new neural network [9], RETINA, for predicting retweet behaviors among users. They used topics of tweets as sound features presenting the contents of tweets and achieved a high F-score. Though the topic-based model is ingenious, the topic can sometimes be misleading and ambiguous.
Besides the research on hate speech spread, the characteristics of the retweet network are also consequential. The retweets network of hateful users could have similar peculiarities as the larger retweets graph. Nevertheless, some distinctions could also be revealed while considering the clusters of hate speech. A few articles study and analyze the retweet graph and its features in statistical and network analysis. The earliest paper on quantitative research in Twitter information diffusion conducts a bunch of topological analyses, including the distribution of followers, degree of separation, and homophily of the follower network [10]. It is shown that the Twitter follower network has a degree distribution incompliant with the Power Law. The analysis of separation degree is shorter than that suggested by the Small World Theory, which states that any user could reach another user in 6 steps. The analysis on the retweet tree shows that the retweet of a post, once started, will go viral no matter the followers of the original poster. This paper focused more on the follower graph, while Bild et al. analyzed the features of the retweet graph more thoroughly and found that the retweet graph was compliant with the Power Law and small-world Theory [11]. The retweet network of hate speech is predicted to have similar features as a general retweet graph. Efstathiades et al. revisited the network presented by Kwak et al. and concluded that the Twitter network has changed over time as the population grows from around 41 million to more than 500 million users [10][12]. It suggested that the largest strongly connected components previously were divided into smaller strongly connected components and developed a sparser tree. This can be explained by the growing number of people with different interests coming to Twitter to form different collections.
3. Methodology
Because of the dearth of research on the spread of hate speech and the different focus, this study aimed to investigate the diffusion of hate speech on Twitter through network analysis, which hasn't been fully researched.
3.1. Dataset:
To construct the retweet network, we obtained a dataset from Kaggle [4], which comprises approximately 100 thousand Twitter users. Among these users, we identified over 500 hateful users, and each user was labelled with their extent of hate, categorized as 'hateful,' 'normal,' or 'other.' The dataset also includes a file with all the directed edges in the retweet graph. More Twitter Data could be obtained by the Twitter Streaming API or the Twitter REST API [13].
3.2. Constructing the Retweet Network:
To create the retweet network, we considered nodes as Twitter users, and directed edges represented retweet relationships between those users. A directed edge from user A to user B indicates that user A shared user B's content. However, the dataset presented a limitation as it did not contain the original tweets of each user, making it challenging to distinguish hateful users solely based on their retweet behavior accurately.
3.3. Network Analysis:
I started by visualizing the entire retweet network with all edges from hateful users. I first checked the connectivity of each node and their strongly connected components. These could help me understand the basic structure of the graph. Then, I plotted the degree distribution of the graph to see the nodes' connectivity patterns.
However, due to the network's high density, analyzing the entire graph became cumbersome. As a result, I focused on a subnetwork of hate spread from one hateful user. This individual spread of retweet graph showed the ability of each node to spread messages using retweeting. By iterating all the hateful users, I obtained all the spreading ability of the nodes. Analyzing these subnetworks gave me insights into the single spot spread of hate speech.
3.4. Modeling the Retweet Network:
I modeled the retweet network using a directed Erdos-Renyi (ER) network to gain further understanding and generate a more manageable comparison. We determined the optimal probability of the ER graph for retweeting between two nodes by finding the nearest edge numbers. Through iterating all approximations of single-spot retweet graphs, I got an average probability of retweeting between two random nodes.
3.5. Evaluation of ER Graph Similarity:
To assess the similarity between the ER graph and the original hate graph, I compared several network metrics. These metrics included maximum and average degree, various centralities (degree, eigenvector, and betweenness centrality), average clustering coefficient, and graph density. This analysis shows how well the ER graph represents the spread of hate speech in comparison to the original hate graph.
3.6. Limitations and Future Directions:
While this study sheds light on the spread of hate speech through network analysis, it is essential to note some limitations. The dataset's lack of original tweets restricts our ability to identify hateful users based solely on retweet behavior accurately. Additionally, this study focuses solely on Twitter data and may not capture the entirety of hate speech spread on other platforms.
What's more, the degree distribution of my retweet network obeys the Power law, but the ER graph gives a binomial distribution. That could explain why the original hate graph has a higher average degree and max degree and a higher clustering coefficient but a lower closeness centrality. Thus, I would try other models that obey the Power Law in future research.
3.7. Ethical Considerations:
It is important to acknowledge that this study deals with sensitive and potentially harmful content related to hate speech. The dataset has taken measures to anonymize user data and prioritize user privacy. I understood the potential implications of this research on individuals and communities, and I aimed to handle the data with utmost responsibility.
4. Results
Before viewing the results in terms of the research question, I started with the dataset itself. Table 1 demonstrates the statistics of the dataset. The dataset contains three kinds of users: "hateful," "normal," and "other." It has around 100k users, but only 544 hateful users are confirmed to be hateful in the dataset. The percentage of hateful users is only about 0.54% of the whole dataset. As for the connection between the hateful user and other or normal users, 8.6% of normal users have connected with hateful neighbors, and 2.7% of other users have hateful neighbors. In the dataset, the hateful user only takes up a small portion of users.
Table 1: Dataset Statistics of Numbers of 'Hateful', 'Normal', 'Other' Users in Dataset
Property | Value |
Total Number of Users | 100,386 |
Number of Normal Users | 4,427 |
Number of Other Users | 95,415 |
Number of Hateful Users | 544 |
Number of Normal Users with Hateful Neighbors | 380 |
Number of Other Users with Hateful Neighbors | 2,547 |
4.1. Retweet Network in Hateful Users:
To better understand the hate spread between hateful users, I checked the retweets between hateful users and plotted the retweet graph for hateful users. Figure 1 shows hate spread in the hateful user group. The directed retweet graph included all 544 hateful users as nodes, with connected hateful users as blue and disconnected as red. It included all the retweets between different users, with 3237 edges. In the graph, there are 136 disconnected hateful users, meaning that they don't have hateful neighbors connected. The disconnected hateful users take up a quarter of all the hateful users. In the rest of the 408 connected hateful users, the largest strongly connected component's size in the connected hateful users is 247. It illustrates that one-fourth of the hateful users don't have much dissemination ability, while in the connected hateful users, there is a strongly connected component that links about half of them. The diameter of the connected component, the maximum shortest distance between two distinct nodes, is 10, so two of the connected hateful users can be reached in 10 steps.
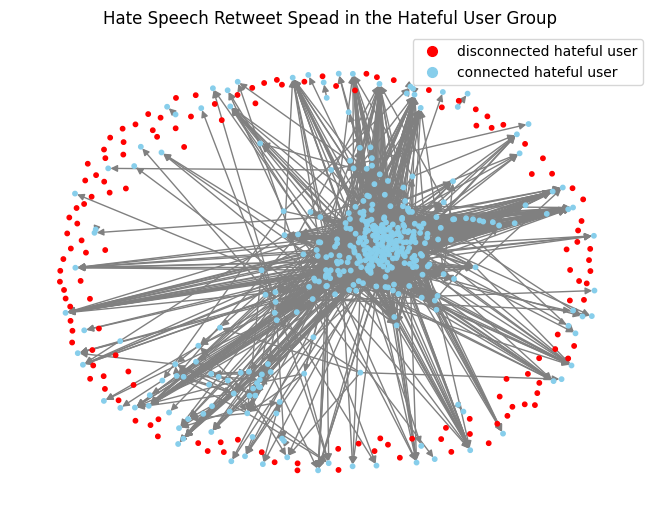
Figure 1. Retweet Network in All Hateful Users
The retweet network containing all the hateful users is very dense to analyze and check for details, so I tested individual hateful connected users' ability to spread hate speech by drawing a retweet started from a selected connected hateful user. I began by choosing a random hateful user who is connected and saw how the retweeting behavior is diffused. Figure 2 shows a single retweet spread from a randomly picked, connected hateful user as a start, which shows the potential spread of a message by this user in the hateful user group. In this graph, the picked user can spread tweets to 308 other hateful users. It is dense in the center while sparse on the outside. There is a strongly connected component of size 247 in the center.
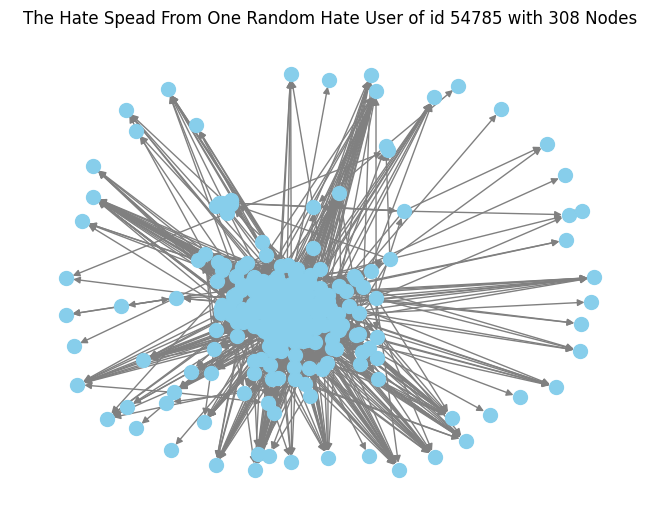
Figure 2. Retweet Spread Graph from One Random Hateful User with 308 Nodes
By iterating all the hateful users, we could see the potential hate spreading ability from every hateful user. Figure 3 shows the node numbers and max strongly connected component sizes of all single spotted hate spread graphs from each hateful user. The x-axis is the 544 node indexes that the graph started from. According to the graph, there are 296 graphs with over or equal to 308 nodes with 247 strongly connected components, and 21 graphs with the largest strongly connected component of 9, while other 229 graphs with node numbers smaller than 9 and a maximum strongly connected component of either size of 1 or 2. It shows that around 54% of the hateful users have the ability to spread a message to over half of the hateful users because of the connection to the largest strongly connected component in the graph, while the other proportion of the hateful users has a small ability to spread messages by retweeting and 40% of hateful users are even isolated as disconnected hateful user.
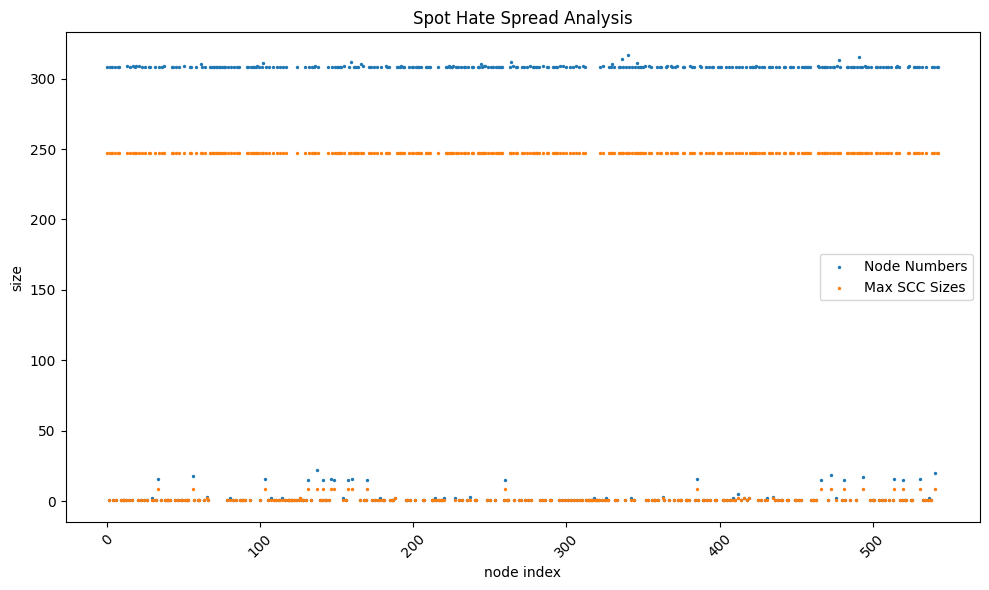
Figure 3. Scatter Plot of the Node Number and Max Strongly Connected Component Size in All Single Spot Retweet Spread Graphs
4.2. Degree distribution:
The degree distribution describes the frequency of nodes with different degrees in the graph. It provides a valuable representation of important insights into the structural characteristics of the graph. Figure 4 shows the degree distribution of the hate graph of all retweets between hateful users, and Figure 5 illustrates the degree distribution of a random single-spot hate spread graph. These two graphs of degree distributions indicate that the hate-spread retweet graph follows the Power Law. The Power Law suggests only a small proportion of people have a higher degree, while most people have a very low degree. As for the degree distribution of the hate graph of all retweets, there is only one user with a degree of 141, while most users were under a degree of 5. Similarly, in the degree distribution of the random retweet graph with 308 nodes, there is only one user with a degree of 138, while most nodes have a degree under 20.
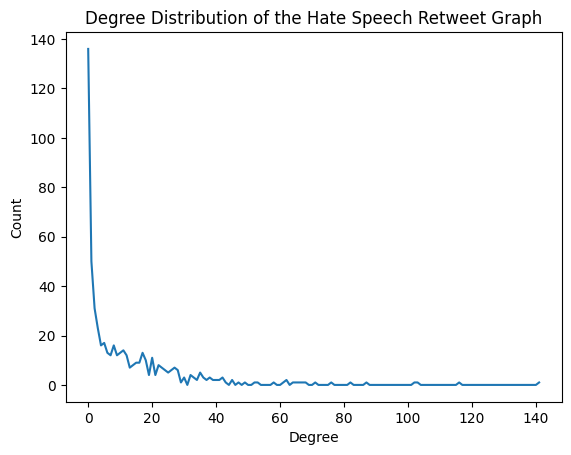
Figure 4. Degree Distribution of Retweet Graph in All Hateful Users
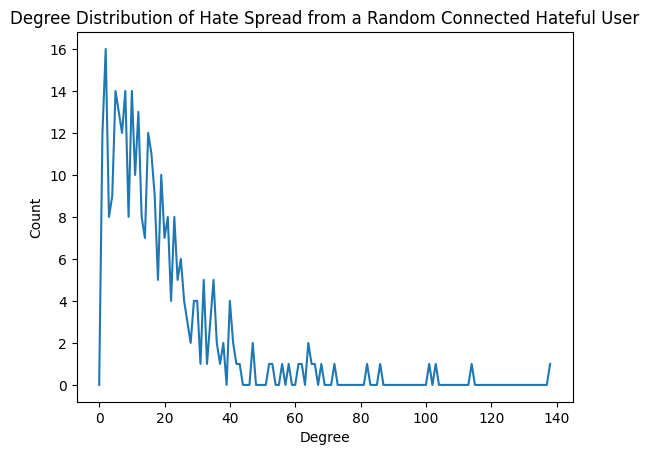
Figure 5. Degree Distribution of a Single Spot Retweet Spread Graph with 308 Nodes
4.3. Erodos-Renyi Modeling:
To simulate the most similar Erdos-Renyi graph, I started with finding the most suitable probability of the Erodos-Renyi graph according to the edge and node number of the hate spread from a selected hateful user. Figure 6 shows a simulated Erodos-Renyi model with 308 nodes. Apparently, the ER approximated graph is much denser than the original single-spotted hate spread graph. The ER graph is a strongly connected component with a 308-node strongly connected component, while the original graph has a strongly connected component of 247. The average probability of all the 500 graphs is about 0.26. It is shown that all graphs with node number over 308 has a probability of 0.03, all the graph of disconnected node has a probability of 0, and for the graph with the max strongly connected component of 9, the average probability is around 0.09, while the rest graphs with node number either 2 or 3 and a strongly connected component of either 1 or 2, have very fluctuated probability.
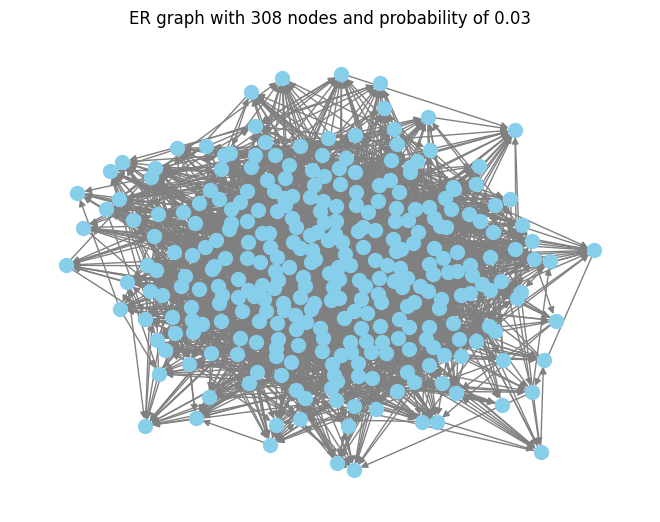
Figure 6. Erdos-Renyi Approximation of a Single Spot Retweet Spread Graph with 308 Nodes
I chose single-spotted hate spread with 308 nodes for comparing the similarity of ER approximation and the original graph because the probability for single-spot hate spread graphs with 308 or higher nodes have a stable probability of 0.03, and the features are relatively stable. I compared the density, max, and average degree, max and average degree centrality, max and average eigenvector centrality, max and average closeness centrality, and average clustering coefficient between the two graphs in Table 2. The table demonstrates a similar value in density, average degree centrality, and average betweenness centrality between the two graphs, but the average degree, max degree, and max degree centrality are much higher in the single-spot hate spread graph. For eigenvector centrality, the ER graph has a slightly higher average eigenvector centrality but a much lower max eigenvector centrality. Although the two graphs have similar average betweenness centrality, the original hate spread graph has a higher max betweenness centrality. In closeness centrality, the ER approximated graph has a higher average and max closeness centrality. The table also shows that the single-spot hate spread graph has a much higher average clustering coefficient.
Table 2. Comparision Between Single-Spotted Hate Spread and Erdos-Renyi Approximated Graph
| Single-spot hate spread graph | ER approximated graph |
Density | 0.03 | 0.03 |
Average Degree | 18.6 | 18.9 |
Max Degree | 138 | 32 |
Average Degree Centrality | 0.0604 | 0.0614 |
Max Degree Centrality | 0.4495 | 0.1042 |
Average Eigenvector Centrality | 0.0409 | 0.0539 |
Max Eigenvector Centrality | 0.2003 | 0.1231 |
Average Betweenness Centrality | 0.0064 | 0.0058 |
Max Betweenness Centrality | 0.1117 | 0.0157 |
Average Closeness Centrality | 0.2423 | 0.3598 |
Max Closeness Centrality | 0.3210 | 0.4104 |
Average Clustering Coefficient | 0.1555 | 0.0325 |
The Erodos-Renyi graph's degree distribution is shown in Figure 7. The degree distribution of the ER graph is completely different from the hate spread graph. The degree distribution of the ER graph follows the Binomial Distribution, where most nodes have a related mean value of degree, while the Power law says most nodes share a very low value of degree. In the graph, we could find that most nodes in the ER graph have a degree in the range of 10 to 25. The max of the degree is 32, while the max degree in the original graph is 138.
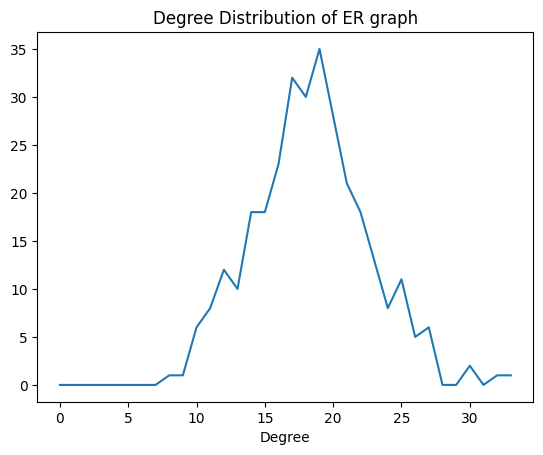
Figure 7. Degree Distribution of the Erdos-Renyi Approximation Graph
5. Discussion
Based on my results, we could give several insights. But firstly, in our data, the hateful users take up a small proportion of the whole data, and the percentage of general users connected with the hateful user is also relatively small. The dataset could be biased, so we needed more data to support the findings.
5.1. Research Insights
In the retweet network between all the hateful users, one-fourth of them are disconnected, meaning that these hateful users are not connected with other hateful users, while there is a strongly connected component in the connected part of the graph covering over half of the hateful users. The small diameter of the connected part of the graph shows that hateful users are closely connected, but longer than what the small-world theory suggests in 6 steps [14]. It suggests that hateful users have a polarized distribution. They are either closely connected or isolated.
By iterating all the hateful users with their own subgraphs, called single-spotted hate-spread retweet graphs, the study evaluated the individual ability to spread hate speech using retweets. The graphs are dense in the center with a strongly connected component and sparse on the outside with sink nodes, meaning these nodes didn't retweet others' posts but were retweeted by others. This study also found that the single-spotted retweet graphs' node number is heavily dependent on the size of the max strongly connected component in the graph. Because each strongly connected component is not connected, nodes can only connect to one of the strongly connected components, and the node number is within a range. The node number of each sub-retweet graph shows the number of nodes the initial node could spread and represents the spreading ability of the start node, so the spreading ability depends on the size of the strongly connected component it connects.
The degree distributions of both the whole retweet graph of all hateful users and the single-spotted retweet graph obey the Power Law, showing that nodes with higher degrees are scarce, while nodes with low degrees are much. As we know, Erdos-Renyi (ER) graphs have a binomial distribution of the degree, so there could be some differences between the retweet graphs and the ER approximated graph, but it is still worthwhile to have an average approximation of the probability of retweeting. Because when the number of nodes was set with a similar number of edges, the ER approximation graphs are more likely to average the probability of retweeting to every node instead of a small number of people with a very high probability to retweet while most people are very unlikely to retweet in the retweet graph. In other words, the ER graph could give an average probability of retweeting.
An Erdos-Renyi approximation plotted with a controlled density similar to the original single-spotted retweet graph. The results show that the probability of a node retweet also largely relates to the strongly connected component of the node connected, but it doesn't mean that there is a positive or negative proportion. The probability of an ER graph is more depends on the density of a graph. That's why the ER graphs with smaller node numbers greatly fluctuate their probabilities of linking edges. By looping through all the graphs, the average probability found is around 0.026. However, more datasets are needed to confirm whether these approximations could work in other data or only for this dataset.
The comparison data between the single-spotted spread graph and the ER approximated graph shows that ER approximation is more average, closer in geodesic distance, but less clustering graph, while the single-spot hate spread graph is centralized. The idea is the same as that the ER approximation is an average version of the single-spotted spread graph.
5.2. Future Direction
My research is only based on one dataset, so the conclusions need more datasets to support and improve. What's more, how the retweet graph behavior in other interested groups could be considered, and the similarities could be compared. Also, further research could try other models to approximate the retweet graph and see the similarity. To better predict and model the network, the Method of Graph Neural Network (GNN) would be a direction but could require more data to support it. For example, adopting GNN with natural language processing models for the detection of hate speech [15].
6. Conclusions
For the first research question, the research found that the hate speech diffusion on retweets relies on the size of the strongly connected components and gives a polarized node layout with a quarter of hateful users disconnected, while half are strongly connected. And the degree distribution of hate speech retweets follows the Power Law. The spreading ability of each node is largely decided by the size of the strongly connected component to the node connected.
By applying the Erdos-Renyi Model in research question two, we could estimate the average probability of retweets between two random hateful users because the ER graph is an average version of the hate spread graph when density is controlled. The average probability found in the study for this dataset is 0.026. However, because of different degree distributions, the ER approximation is a less centralized graph than the original hate diffusion.
Overall, the network analysis of the retweet graph of hateful users gives important insights into how hate speech spreads among hateful users through retweets. With more data in the future, more findings and improvements could be made. The Erdos-Renyi graphs could provide valuable information on the average retweet probability. Further research could try out other models for experiments.
Acknowledgement
The author would like to express sincere gratitude to Professor Munther A. Dahleh from the Massachusetts Institute of Technology for valuable insights and guidance, which greatly enriched the quality of this research. The author also deeply appreciates his continuous encouragement and support throughout this project.
Appendix
GitHub Link: https://github.com/ychen3221/Hate-Speech-Retweet-Diffusion.
References
[1]. Chen, Y., Zhou, Y., Zhu, S., & Xu, H. (2012). Detecting offensive language in social media to protect adolescent online safety. 2012 International Conference on Privacy, Security, Risk and Trust and 2012 International Confernece on Social Computing, IEEE. https://ieeexplore.ieee.org/document/6406271/
[2]. Badjatiya, P., Gupta, S., Gupta, M., & Varma, V. (2017, June 1). Deep learning for hate speech detection in Tweets. arXiv.org. https://arxiv.org/abs/1706.00188
[3]. Mathew, B., Dutt, R., Goyal, P., & Mukherjee, A. (2018, December 4). Spread of hate speech in online social media. arXiv.org. https://arxiv.org/abs/1812.01693
[4]. Ribeiro, M. H., Calais, P. H., Santos, Y. A., Almeida, V. A. F., & Meira Jr, W. (2018, March 23). Characterizing and detecting hateful users on Twitter. arXiv.org. https://arxiv.org/abs/1803.08977
[5]. Pereira-Kohatsu, J. C., Quijano-Sánchez, L., Liberatore, F., & Camacho-Collados, M. (2019, October 26). Detecting and monitoring hate speech in Twitter. MDPI. https://www.mdpi.com/1424-8220/19/21/4654#B2-sensors-19-04654
[6]. Suh, B., Profile, V., Hong, L., Pirolli, P., Chi, E. H., & Metrics, O. M. A. (2010, August 1). Want to be retweeted? large scale analytics on factors impacting retweet in Twitter network: Proceedings of the 2010 IEEE Second International Conference on Social Computing. Guide Proceedings. https://dl.acm.org/doi/10.1109/SocialCom.2010.33
[7]. Jahan, M. S., & Oussalah, M. (2021, May 22). A systematic review of hate speech automatic detection using Natural Language Processing. arXiv.org. https://doi.org/10.48550/arXiv.2106.00742
[8]. Karthik, Dinakar., Rosalind, W., Picard., Henry, Lieberman. (2015). Common Sense Reasoning for Detection, Prevention, and Mitigation of Cyberbullying. 4168-4172.
[9]. Masud, S., Dutta, S., Makkar, S., Jain, C., Goyal, V., Das, A., & Chakraborty, T. (2020, October 9). Hate is the new Infodemic: A topic-aware modeling of hate speech diffusion on Twitter. arXiv.org. https://arxiv.org/abs/2010.04377
[10]. Kwak, H., Lee, C., Park, H., & Moon, S. (2010, April 1). What is Twitter, a social network or a news media?: Proceedings of the 19th International Conference on World Wide Web. ACM Other conferences. https://dl.acm.org/doi/10.1145/1772690.1772751
[11]. Bild, D. R., Liu, Y., Dick, R. P., Mao, Z. M., & Wallach, D. S. (2014, February 11). Aggregate characterization of user behavior in Twitter and analysis of the retweet graph. arXiv.org. https://arxiv.org/abs/1402.2671
[12]. Efstathiades, H., Antoniades, D., Pallis, G., Dikaiakos, M. D., Szlávik, Z., & Sips, R.-J. (2016). Online social network evolution: Revisiting the Twitter graph. 2016 IEEE International Conference on Big Data (Big Data). https://ieeexplore.ieee.org/document/7840655/
[13]. Thij, M. ten, Ouboter, T., Worm, D., Litvak, N., Berg, H. van den, & Bhulai, S. (2015, January 31). Modelling of trends in Twitter using Retweet Graph Dynamics. arXiv.org. https://arxiv.org/abs/1502.00166v1
[14]. Watts, D. J., & Strogatz, S. H. (1998). Collective dynamics of “small-world” networks.
[15]. Das, M., Saha, P., Dutt, R., Goyal, P., Mukherjee, A., & Mathew, B. (2021, August 1). You too brutus! trapping hateful users in social media: Challenges, Solutions & Insights. arXiv.org. https://doi.org/10.48550/arXiv.2108.00524
Cite this article
Chen,Y. (2024). Cascading dynamics of hate speech propagation: Unveiling network structures and probability of retweeting on Twitter. Applied and Computational Engineering,73,100-110.
Data availability
The datasets used and/or analyzed during the current study will be available from the authors upon reasonable request.
Disclaimer/Publisher's Note
The statements, opinions and data contained in all publications are solely those of the individual author(s) and contributor(s) and not of EWA Publishing and/or the editor(s). EWA Publishing and/or the editor(s) disclaim responsibility for any injury to people or property resulting from any ideas, methods, instructions or products referred to in the content.
About volume
Volume title: Proceedings of the 2nd International Conference on Software Engineering and Machine Learning
© 2024 by the author(s). Licensee EWA Publishing, Oxford, UK. This article is an open access article distributed under the terms and
conditions of the Creative Commons Attribution (CC BY) license. Authors who
publish this series agree to the following terms:
1. Authors retain copyright and grant the series right of first publication with the work simultaneously licensed under a Creative Commons
Attribution License that allows others to share the work with an acknowledgment of the work's authorship and initial publication in this
series.
2. Authors are able to enter into separate, additional contractual arrangements for the non-exclusive distribution of the series's published
version of the work (e.g., post it to an institutional repository or publish it in a book), with an acknowledgment of its initial
publication in this series.
3. Authors are permitted and encouraged to post their work online (e.g., in institutional repositories or on their website) prior to and
during the submission process, as it can lead to productive exchanges, as well as earlier and greater citation of published work (See
Open access policy for details).
References
[1]. Chen, Y., Zhou, Y., Zhu, S., & Xu, H. (2012). Detecting offensive language in social media to protect adolescent online safety. 2012 International Conference on Privacy, Security, Risk and Trust and 2012 International Confernece on Social Computing, IEEE. https://ieeexplore.ieee.org/document/6406271/
[2]. Badjatiya, P., Gupta, S., Gupta, M., & Varma, V. (2017, June 1). Deep learning for hate speech detection in Tweets. arXiv.org. https://arxiv.org/abs/1706.00188
[3]. Mathew, B., Dutt, R., Goyal, P., & Mukherjee, A. (2018, December 4). Spread of hate speech in online social media. arXiv.org. https://arxiv.org/abs/1812.01693
[4]. Ribeiro, M. H., Calais, P. H., Santos, Y. A., Almeida, V. A. F., & Meira Jr, W. (2018, March 23). Characterizing and detecting hateful users on Twitter. arXiv.org. https://arxiv.org/abs/1803.08977
[5]. Pereira-Kohatsu, J. C., Quijano-Sánchez, L., Liberatore, F., & Camacho-Collados, M. (2019, October 26). Detecting and monitoring hate speech in Twitter. MDPI. https://www.mdpi.com/1424-8220/19/21/4654#B2-sensors-19-04654
[6]. Suh, B., Profile, V., Hong, L., Pirolli, P., Chi, E. H., & Metrics, O. M. A. (2010, August 1). Want to be retweeted? large scale analytics on factors impacting retweet in Twitter network: Proceedings of the 2010 IEEE Second International Conference on Social Computing. Guide Proceedings. https://dl.acm.org/doi/10.1109/SocialCom.2010.33
[7]. Jahan, M. S., & Oussalah, M. (2021, May 22). A systematic review of hate speech automatic detection using Natural Language Processing. arXiv.org. https://doi.org/10.48550/arXiv.2106.00742
[8]. Karthik, Dinakar., Rosalind, W., Picard., Henry, Lieberman. (2015). Common Sense Reasoning for Detection, Prevention, and Mitigation of Cyberbullying. 4168-4172.
[9]. Masud, S., Dutta, S., Makkar, S., Jain, C., Goyal, V., Das, A., & Chakraborty, T. (2020, October 9). Hate is the new Infodemic: A topic-aware modeling of hate speech diffusion on Twitter. arXiv.org. https://arxiv.org/abs/2010.04377
[10]. Kwak, H., Lee, C., Park, H., & Moon, S. (2010, April 1). What is Twitter, a social network or a news media?: Proceedings of the 19th International Conference on World Wide Web. ACM Other conferences. https://dl.acm.org/doi/10.1145/1772690.1772751
[11]. Bild, D. R., Liu, Y., Dick, R. P., Mao, Z. M., & Wallach, D. S. (2014, February 11). Aggregate characterization of user behavior in Twitter and analysis of the retweet graph. arXiv.org. https://arxiv.org/abs/1402.2671
[12]. Efstathiades, H., Antoniades, D., Pallis, G., Dikaiakos, M. D., Szlávik, Z., & Sips, R.-J. (2016). Online social network evolution: Revisiting the Twitter graph. 2016 IEEE International Conference on Big Data (Big Data). https://ieeexplore.ieee.org/document/7840655/
[13]. Thij, M. ten, Ouboter, T., Worm, D., Litvak, N., Berg, H. van den, & Bhulai, S. (2015, January 31). Modelling of trends in Twitter using Retweet Graph Dynamics. arXiv.org. https://arxiv.org/abs/1502.00166v1
[14]. Watts, D. J., & Strogatz, S. H. (1998). Collective dynamics of “small-world” networks.
[15]. Das, M., Saha, P., Dutt, R., Goyal, P., Mukherjee, A., & Mathew, B. (2021, August 1). You too brutus! trapping hateful users in social media: Challenges, Solutions & Insights. arXiv.org. https://doi.org/10.48550/arXiv.2108.00524