


1. Introduction
Subcutaneous fat CT image segmentation is an important research direction in the field of medical image processing. With the improvement of living standards, people pay more and more attention to body aesthetics and health, and subcutaneous fat is one of the most important fat storage areas in the human body, so its segmentation and quantitative analysis are of great clinical significance [1]. However, the similarity in density, complex texture and diverse morphology between subcutaneous adipose tissue and surrounding tissues make it very difficult to segment it [2].
In recent years, deep learning algorithms have been widely used in the field of medical image processing and have achieved remarkable results. Deep learning algorithms can automatically learn feature representations from a large amount of data and achieve efficient and accurate image segmentation by constructing a multilayer neural network model. In subcutaneous fat CT image segmentation, deep learning algorithms can use models such as convolutional neural networks (CNNs) to train and optimise the image end-to-end to achieve accurate segmentation of subcutaneous fat tissue [3,4].
The research significance of subcutaneous fat CT image segmentation is to provide a fast and accurate quantitative analysis tool for clinicians. By segmenting and quantitatively analysing subcutaneous adipose tissue, the body fat content, distribution and change trend of patients can be assessed, providing an important reference basis for clinical diagnosis and treatment [5]. In addition, subcutaneous fat CT image segmentation can also be applied in the fields of body shape assessment and fitness guidance to help people's health management [6]. Subcutaneous fat CT image segmentation is a challenging and widely applied research direction in the field of medical image processing. Deep learning algorithms, as one of the important technical means, play an important role in achieving efficient and accurate image segmentation [7]. In the future, with the continuous development of deep learning algorithms and medical image processing technology, subcutaneous fat CT image segmentation will be studied in a more refined and personalised way, and provide more useful information for people's health management.
In this paper, based on the subcutaneous fat CT image dataset, the improved Trans-Unet image segmentation model is applied to segment subcutaneous fat, which provides the basis for further research.
2. Introduction to the dataset
The dataset used in this paper is selected from the hospital clinical data, including a total of 9397 CT images of 131 patients and 9397 corresponding ground truth. each image is anonymised with the patient's personal information, and some of the CT images are shown in Fig. 1, and the corresponding ground truth is shown in Fig. 2.

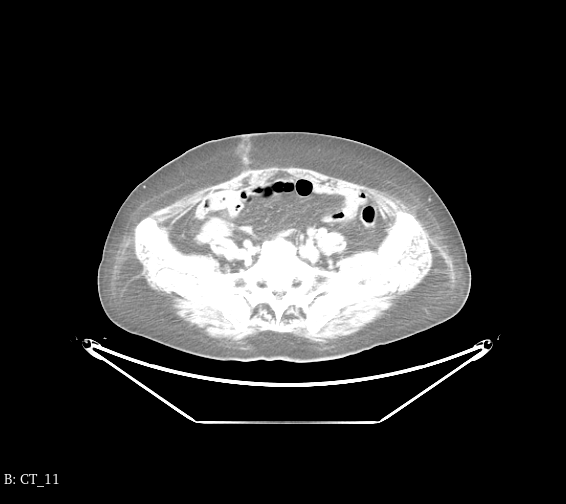
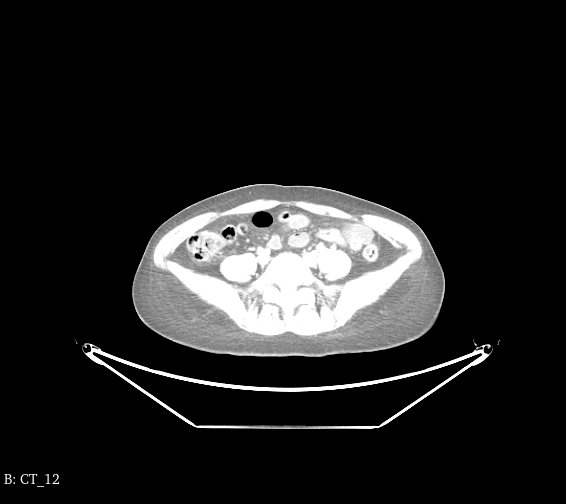
Figure 1. Selected data sets.
(Photo credit: Original)
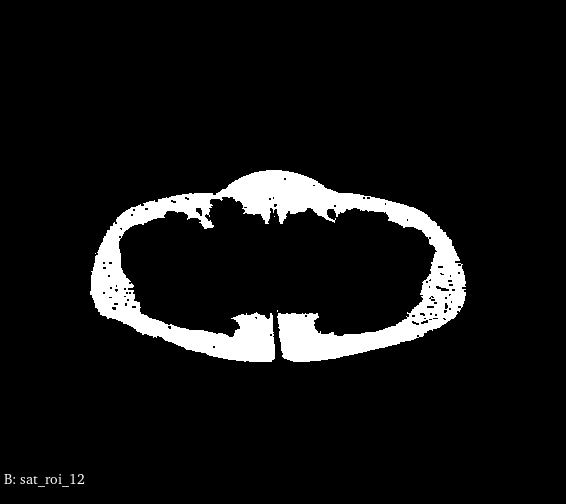
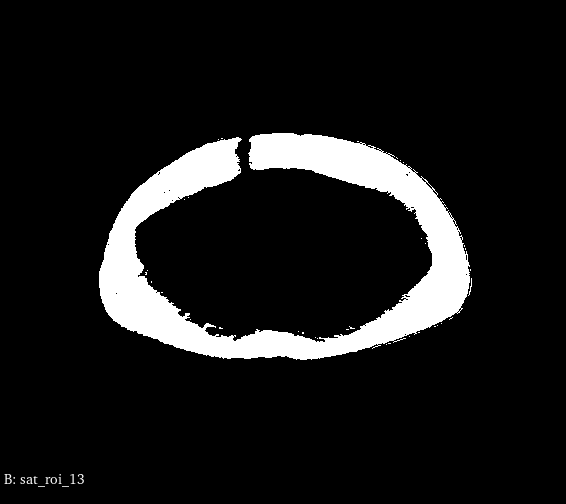
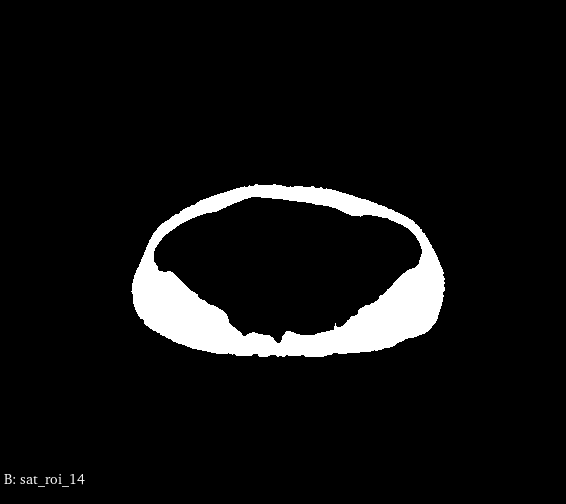
Figure 2. Ground truth.
(Photo credit: Original)
3. TransUNet
TransUNet is a novel medical image segmentation network proposed by the German Max Planck Society, which combines the advantages of two classical models, Transformer and UNet, and can effectively segment medical images [8]. It employs Transformer's self-attention mechanism to capture global information, while using UNet's encoder-decoder structure to preserve image detail information.
The model principle of TransUNet mainly consists of two parts: Encoder and Transformer-Decoder.The Encoder part adopts the encoder structure similar to that of UNet, which continuously downsamples the input image and extracts features. The difference is that TransUNet uses ResNet as the backbone network and adds an attention mechanism (SE-Block) after each downsampling layer to enhance feature representation [9].
The Transformer-Decoder part is the core component of TransUNet, which employs the self-attention mechanism in the Transformer model for global information interaction and feature fusion [10]. Specifically, the Transformer-Decoder consists of multiple Transformer Encoder layers and a simple decoder layer. Each Encoder layer consists of multi-head self-attention, forward propagation network, and residual connections, which can effectively capture global information and reduce information loss. The decoder layer, on the other hand, fuses the encoder outputs with the outputs of the Transformer Encoder layer through upsampling and convolution operations to improve the segmentation accuracy.The model structure of TransUNet is shown in Fig. 3.
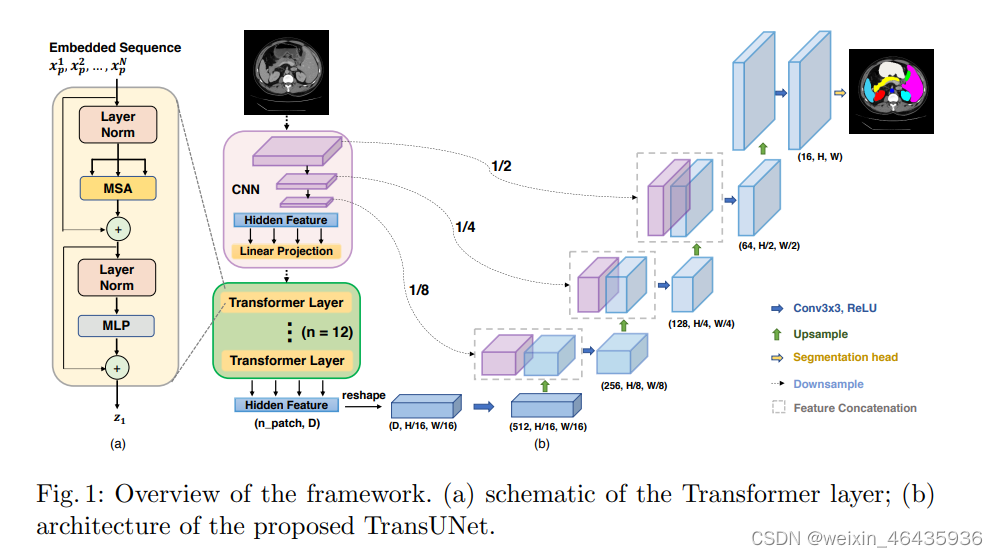
Figure 3. TransUNet structure.
(Photo credit: Original)
The advantage of TransUNet is that it can make full use of Transformer's self-attention mechanism, while retaining the encoder-decoder structure of UNet. This combination makes TransUNet not only able to capture global information, but also able to preserve image details. In addition, TransUNet can balance the model complexity and performance by adjusting the number of Transformer Encoder layers and heads. Therefore, TransUNet has a wide range of application prospects in the field of medical image segmentation.
4. Experiments and Results
The machine CPU used in this experiment is Intel(R) Core(TM) i7-7700 CPU @ 3.60GHz, GPU is NVIDIA GeForce GTX 1080 and 32G of RAM.
After importing the dataset, the dataset is divided into a training set and a test set, 9002 images are used for training and 395 images are used for testing. The loss changes during model training were recorded, and the models were evaluated using Accuracy, Recall, Precision, and IoU. Accuracy refers to the proportion of samples correctly predicted by the classification model; Recall refers to the proportion of samples correctly predicted as positive cases by the classification model; Precision refers to the proportion of samples predicted as positive cases by the classification model that are the proportion of true positive cases; IoU (Intersection over Union) is a commonly used evaluation metric in target detection, indicating the degree of overlap between the detection frame and the true frame.
Trans-Unet is used to train 50 epochs, the batch size is set to 16, and the learning rate is set to 0.0002.
Train 50 epochs, record the value of loss in each epoch and plot the loss curve, the result is shown in Fig. 4.
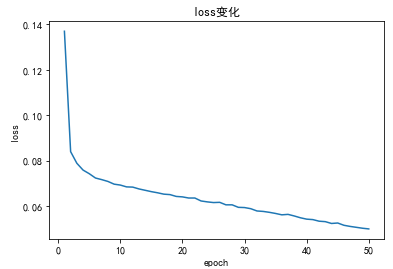
Figure 4. Loss.
(Photo credit: Original)
In machine learning, a loss curve is the trend of the loss function with the number of training sessions during model training. The loss function is an indicator used to measure the difference between the model's predicted results and the real results, and generally speaking, we hope that the model's loss function is as small as possible. Therefore, by observing the loss curve, we can understand how the model performs in different training stages. As can be seen from Fig. 4, the loss curve gradually decreases and converges, and the prediction error of the model is decreasing and is close to the optimal state. This means that the model has learnt the patterns and features in the dataset and can accurately predict new data.
The model was tested using a test set, where four subcutaneous fat CT images were input with their corresponding ground truth, and the model was evaluated using Accuracy, Recall, Precision and IoU, and the results are shown in Table 1.
Table 1. Model evaluation parameter.
Accuracy | Recall | Precision | IoU |
96.2 | 95.26 | 84.48 | 89.62 |
As can be seen from Table 1, the accuracy of the model reaches 96.2%, in addition, the IoU reaches 89.62, the model segmentation is very good, and it can segment the subcutaneous fat portion relatively accurately. The segmentation results of the test set are output and compared with the GROUND TRUTH, and the results are shown in Fig. 5.
|
|
|
|
|
|
|
|
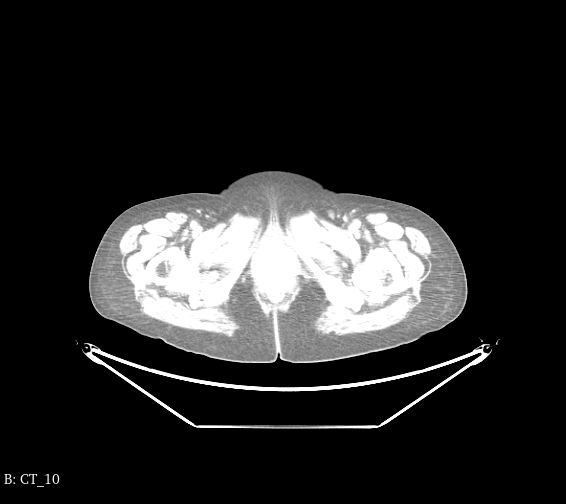


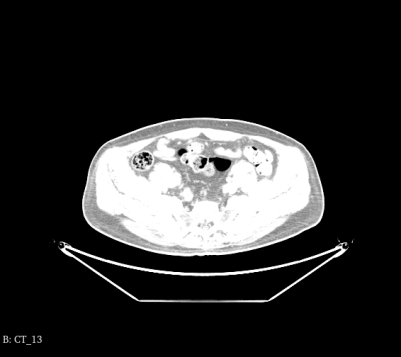

Figure 5. The segmentation results.
(Photo credit: Original)
5. Conclusion
Subcutaneous fat CT image segmentation is an important research direction in the field of medical image processing. With the improvement of living standards, people are paying more and more attention to body aesthetics and health, and subcutaneous fat is one of the most important fat storage areas in the human body, so its segmentation and quantitative analysis are of great clinical significance.
In this study, we imported a dataset containing 9002 images for training and 395 images for testing. We divided the dataset into a training set and a test set and used TransUNet for subcutaneous fat CT image segmentation. By adjusting the model parameters through continuous iteration, we obtained the loss curve and found that the loss curve gradually decreased and converged. This indicates that the prediction error of the model is decreasing and is close to the optimal state. This means that the model has learnt the patterns and features in the dataset and can accurately predict new data.
By testing the model, we found that the accuracy of the model reached 96.2%, in addition, the IoU reached 89.62. this shows that our proposed method can segment the subcutaneous fat portion relatively accurately. This result has important implications for clinical medicine. Firstly, it can help doctors to more accurately assess the body composition and health status of patients, and then develop more scientific and effective treatment plans. Second, it can also provide strong support for medical research, such as for exploring the differences in subcutaneous fat storage among different populations and the relationship with related diseases.
In conclusion, the subcutaneous fat CT image segmentation method proposed in this study has high accuracy and reliability, and is of great significance in both clinical applications and medical research. In the future, we will continue to optimise the algorithm to improve the model performance and apply it to a wider range of medical image processing fields.
References
[1]. Silva D S G, Casanova D, Oliva T J, et al.Cardiac fat segmentation using computed tomography and an image-to-image conditional generative adversarial neural network[J].Medical Engineering and Physics,2024,124104104-.
[2]. Tim B, Thomas B ,Nicola G , et al.MRI-derived fat segmentation using FatSegNet is associated with disease activity, function and metabolic indices in psoriasis and psoriatic arthritis[J].The Royal College of Radiologists Open,2023,1(S1):
[3]. Yuchun L,Yuanyuan W, Mengxing H, et al.Automatic prostate and peri-prostatic fat segmentation based on pyramid mechanism fusion network for T2-weighted MRI[J].Computer Methods and Programs in Biomedicine,2022,223106918-106918.
[4]. Filipa A R, M. A F, M. J F .Automatic epicardial fat segmentation and volume quantification on non-contrast cardiac Computed Tomography[J].Computer Methods and Programs in Biomedicine Update,2022,2
[5]. Kazemi A ,Ali K ,Ahmad K , et al.Segmentation of cardiac fats based on Gabor filters and relationship of adipose volume with coronary artery disease using FP-Growth algorithm in CT scans[J].Biomedical Physics Engineering Express,2020,6(5):055009-.
[6]. Zhang Q, Zhou J, Zhang B, et al.Automatic Epicardial Fat Segmentation and Quantification of CT Scans Using Dual U-Nets With a Morphological Processing Layer[J].IEEE Access,2020,8128032-128041.
[7]. Sara O, L C L, Fabio R, et al.Automatic muscle and fat segmentation in the thigh from T1-Weighted MRI.[J].Journal of magnetic resonance imaging : JMRI,2016,43(3):601-10.
[8]. J P, M A B, I C H, et al.Local noise estimation in low-dose chest CT images.[J].International journal of computer assisted radiology and surgery,2014,9(2):221-9.
[9]. Yuki K, Amir J, Frederic S, et al.Relationship between MDCT-imaged myocardial fat and ventricular tachycardia substrate in arrhythmogenic right ventricular cardiomyopathy.[J].Journal of the American Heart Association,2014,3(4):e000935-e000935.
[10]. Jung M P, Im J J ,Seog Y O , et al.Assessment of Epicardial Fat Volume With Threshold-Based 3-Dimensional Segmentation in CT: Comparison With the 2-Dimensional Short Axis-Based Method.[J].Korean circulation journal,2010,40(7):328-33.
Cite this article
Chen,R. (2024). Segmentation of subcutaneous fat CT images based on the TransUNet model. Applied and Computational Engineering,74,239-244.
Data availability
The datasets used and/or analyzed during the current study will be available from the authors upon reasonable request.
Disclaimer/Publisher's Note
The statements, opinions and data contained in all publications are solely those of the individual author(s) and contributor(s) and not of EWA Publishing and/or the editor(s). EWA Publishing and/or the editor(s) disclaim responsibility for any injury to people or property resulting from any ideas, methods, instructions or products referred to in the content.
About volume
Volume title: Proceedings of the 2nd International Conference on Software Engineering and Machine Learning
© 2024 by the author(s). Licensee EWA Publishing, Oxford, UK. This article is an open access article distributed under the terms and
conditions of the Creative Commons Attribution (CC BY) license. Authors who
publish this series agree to the following terms:
1. Authors retain copyright and grant the series right of first publication with the work simultaneously licensed under a Creative Commons
Attribution License that allows others to share the work with an acknowledgment of the work's authorship and initial publication in this
series.
2. Authors are able to enter into separate, additional contractual arrangements for the non-exclusive distribution of the series's published
version of the work (e.g., post it to an institutional repository or publish it in a book), with an acknowledgment of its initial
publication in this series.
3. Authors are permitted and encouraged to post their work online (e.g., in institutional repositories or on their website) prior to and
during the submission process, as it can lead to productive exchanges, as well as earlier and greater citation of published work (See
Open access policy for details).
References
[1]. Silva D S G, Casanova D, Oliva T J, et al.Cardiac fat segmentation using computed tomography and an image-to-image conditional generative adversarial neural network[J].Medical Engineering and Physics,2024,124104104-.
[2]. Tim B, Thomas B ,Nicola G , et al.MRI-derived fat segmentation using FatSegNet is associated with disease activity, function and metabolic indices in psoriasis and psoriatic arthritis[J].The Royal College of Radiologists Open,2023,1(S1):
[3]. Yuchun L,Yuanyuan W, Mengxing H, et al.Automatic prostate and peri-prostatic fat segmentation based on pyramid mechanism fusion network for T2-weighted MRI[J].Computer Methods and Programs in Biomedicine,2022,223106918-106918.
[4]. Filipa A R, M. A F, M. J F .Automatic epicardial fat segmentation and volume quantification on non-contrast cardiac Computed Tomography[J].Computer Methods and Programs in Biomedicine Update,2022,2
[5]. Kazemi A ,Ali K ,Ahmad K , et al.Segmentation of cardiac fats based on Gabor filters and relationship of adipose volume with coronary artery disease using FP-Growth algorithm in CT scans[J].Biomedical Physics Engineering Express,2020,6(5):055009-.
[6]. Zhang Q, Zhou J, Zhang B, et al.Automatic Epicardial Fat Segmentation and Quantification of CT Scans Using Dual U-Nets With a Morphological Processing Layer[J].IEEE Access,2020,8128032-128041.
[7]. Sara O, L C L, Fabio R, et al.Automatic muscle and fat segmentation in the thigh from T1-Weighted MRI.[J].Journal of magnetic resonance imaging : JMRI,2016,43(3):601-10.
[8]. J P, M A B, I C H, et al.Local noise estimation in low-dose chest CT images.[J].International journal of computer assisted radiology and surgery,2014,9(2):221-9.
[9]. Yuki K, Amir J, Frederic S, et al.Relationship between MDCT-imaged myocardial fat and ventricular tachycardia substrate in arrhythmogenic right ventricular cardiomyopathy.[J].Journal of the American Heart Association,2014,3(4):e000935-e000935.
[10]. Jung M P, Im J J ,Seog Y O , et al.Assessment of Epicardial Fat Volume With Threshold-Based 3-Dimensional Segmentation in CT: Comparison With the 2-Dimensional Short Axis-Based Method.[J].Korean circulation journal,2010,40(7):328-33.