


1. Introduction
The increasing volume of text data generated daily calls for effective methods to extract insights and classify text content. The Reuters news article data-set provides a rich source of information for analysis and classification tasks. The k-NN algorithm is a natural choice due to its simplicity and effectiveness in handling text data. When predicting the category or value of a new sample, the basic idea is to discover the nearest k training samples based on the sample points in the feature space, and then make a forecast based on the information of the k neighbors [1-3]. k-NN algorithms have undergone various upgrades and adaptations in order to adapt to diverse situations and data sets. Weighted k-NN: In order to improve the performance of the algorithm, weighted k-NN can be introduced, in which different neighbor samples have different weights according to their distance or other correlation scores [4]. In this way, the influence of neighbors farther away from target samples on prediction can be reduced. Kd-tree: In order to speed up the search speed of k-NN algorithm, KD-tree (k-dimensional tree) data structures are introduced [5]. Kd-trees can divide a feature space into multiple regions, thus reducing the complexity of searching, especially for high-dimensional data sets. The above methods provide useful information to deepen our understanding of the k-NN algorithm. However, this article is just an initial exploration of the k-NN algorithm. Therefore, the task of this article is to use the k-NN algorithm to classify the Reuters news dataset.
2. Data Pre-Processing
Before going into the field of text classification, the problem of data must be solved first. According to George Lawton Data is any sort of processing done on raw data to prepare it for another data processing action. It is a subset of data preparation. The Reuters News data-set is rich and diverse, containing a large number of news articles classified into different categories [6]. The first step is to load and clean the data to make sure it is ready for analysis. This includes dealing with missing values, converting data into a suitable format, and addressing sparsity issues. In addition, the data sets are divided into training sets and test sets to facilitate model development and evaluation.
3. Exploratory Data Analysis (EDA)
EDA is the compass that guides us through the data-set's uncharted. Exploratory data analysis is the critical procedure of doing preliminary investigations on data in order to discover patterns, identify anomalies, test hypotheses, and double-check assumptions using summary statistics and graphical representations [7]. In this phase, we aim to understand the data-set's characteristics and uncover hidden patterns. Our analysis reveals the distribution of news articles across classes, word frequency distributions, and relationships between features and the target variable. Word clouds, histograms, and bar charts visually represent these findings. Through EDA, we gain a deeper understanding of the data-set, which includes exploring the central tendency, dispersion, and shape of the data. By calculating aggregate statistics, such as mean, median, standard deviation, and checking the distribution of the data, the useful information can be provided for subsequent modeling decisions.
4. How k-NN Works
In his essay, Antony Christopher also discusses the k-NN operation mode. k-NN is a supervised learning technique that can be used for regression and classification. By computing the distance between the test data and all of the training points, k-NN attempts to predict the proper class for the test data [8]. Next, I will explain in detail how k-NN works in my data set with a labeled example (an instance with a known class), k-NN finds the new, unlabeled class of data points by looking at its k-nearest neighbors. The "k" represents the number of nearest neighbors to consider and is the hyper-parameter you need to select before applying the algorithm. The distance measure (often the Euclidean distance) is used to assess the similarity of data points. You can select alternative distance indicators based on your needs. The distance between the new data point and all of the data points in the training data set is calculated by the algorithm. The first k data points with the least distance (nearest neighbor) are then chosen.
5. Model Flittering
For model fitting, we applied k-NN to the training data and adjusted the value of k as needed. This process involves measuring the distance between data points, identifying the k nearest neighbors, and making predictions. Challenges may arise at this stage, such as choosing an optimal k value. According to my experimental analysis, if the value of k is set too large, the algorithm will take more consideration Surrounding data points and possibly overfitting training set data. This means the algorithm may not generalize well to new data, resulting in an increased probability error rate on the test dataset. Conversely, if the value of k is set too, the algorithm will only consider the labels of a few neighbors sort. This can cause the algorithm to fail to capture the whole Trends in the data, thus not being able to classify new data well. figure1 is about the error rate for training, and Figure2 is about the error rate for testing. When k was small the model has high variance and low bias, and conversely, when k is large, the model had low variance and high deviation. The right bias and variance are thought to be optimal, when k=40 is considered.
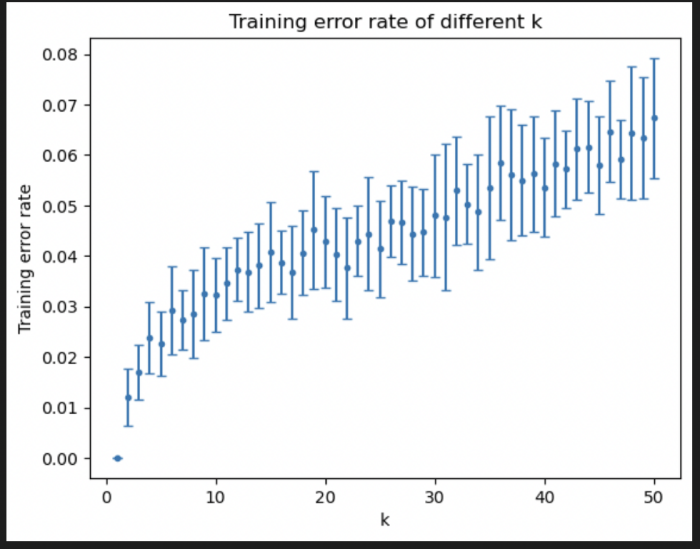
Figure 1. Training error rate of different k in k-NN
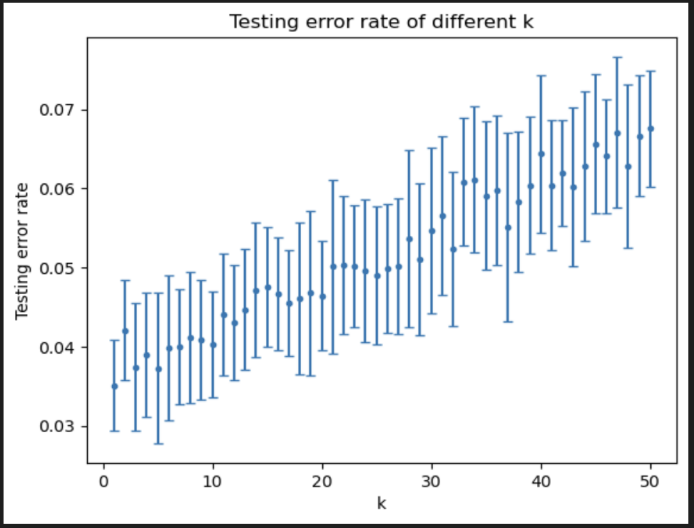
Figure 2. Testing error rate of different k in k-NN
6. Model Choose
P. Soucy and G.W. Mineau proposed that the algorithm had two sides and that positive feature selection can be used for text categorization. This feature selection strategy allows for the removal of features that do not offer new information because other characteristics are highly interacting with them, resulting in redundancy, as well as features with lower predictive potential. Redundancy and irrelevance may inject unwanted bias and complexity into the k-NN learning algorithm, undermining the k-NN learning algorithm [9]. Using k-NN as the selected method, the next step is model fitting. We apply k-NN to the training data, and the Euclidean distance and cosine distance are used to calculate whether the accuracy of the algorithm will be affected by the same k-NN algorithm. In my k-NN algorithm experiment, the mean and standard deviation using cosine distance and Euclidean distance are printed the mean and standard deviation output in the file. Comparing cosine distance and Euclidean distance, it can easily find that cosine has a larger mean accuracy and a smaller standard deviation. The specific reason is that the dimension increases and the distance also increases, which affects the Euclidean distance because cosine looks at the Angle, the Angle does not change, and cosine distance is not affected, so cosine distance is better here.
7. Model Diagnostics
In terms of model diagnosis, the code has calculated the average accuracy and standard deviation of k-NN method. In the article data of Reuters, it can be seen from the obtained data that 80 articles are randomly selected and classified by k-NN algorithm, and the average accuracy is greater than 85%. When using cosine distance, its accuracy can be improved to more than 96 percent and the mean standard deviation is greatly. We also tested the error rate of the test set and the training set. According to the chart data, it is not difficult to find that the higher the value of k, the higher the error rate will be. In order to further explore whether k will affect the error rate in the future, a Z-test is conducted to test it. In this experiment, James Chen explains that when the variances are known and the sample size is large, a z-test is used to assess whether two population means differ [10]. The k=1 and k=45 is set for comparison with a good cosine distance, it is not difficult to find that the average error of 45-NN is greater than the average error of 1-NN. In order to verify whether this result is correct, I conducted a Z-test on the result. According to Z-test’s formula, \( d=|mean1-mean45| \) is used in the code. This line of code calculates the absolute difference between the two mean error rates \( d \) and \( \sum _{k=1,45}\sqrt[]{mean(k)×(1-mean(k))/(200-80)} \) . The formula calculates sigma, which is an estimate of one standard deviation. The z value according to the formula is d divided by sigma. Next, we use the Get_p_value(zp) function, p_value= \( 1-2×p(z \gt |zp|) \) , \( p(z \gt |zp|) \) is the probability that the Z-score is greater than \( |zp| \) the normal distribution, which calculates the p-value of a two-tailed hypothesis test to measure whether the difference between two samples is significant. The null hypothesis assumes that there is no significant difference in the average error rate between the two k-NN algorithms. The main steps of this function are as follows:
1) \( p(z \gt |zp|) \) calculates the normal cumulative distribution probability for a given standardized difference measure \( |zp| \) . This value represents the probability of being greater than \( |zp| \) in a standard normal distribution.
2) \( 2×p(z \gt |zp|) \) calculates the p-value of the two-tailed hypothesis test.
3) \( 1-2×p(z \gt |zp|) \) is used to round p-values and return the result. If the null hypothesis is true, the P-value shows the probability of the observed difference or more extreme difference. The null hypothesis can be rejected as significant if the p-value is modest (typically less than the significance level, such as 0.05).
According to the results, p = 0.78: p-value is calculated by the double-tail hypothesis test, which is used to measure whether the average error rate between the two algorithms is significant. In this case, the p-value is about 0.78, which means the difference is less significant. Next, the formula c = 1-((1-p)/2) can be used to calculate the confidence level, which represents the confidence of the difference in the average error rate between the two algorithms. Here, the confidence level is about 0.89, indicating a relatively low degree of variability. It also represents the probability that the second k-NN algorithm (45-NN) will perform better on the true error rate. In this case, the probability is about 0.89, which means there is a relatively high probability that the second algorithm will perform better on the true error rate. In summary, based on these outputs, the first k-NN algorithm (1-NN) has a lower average error rate, but statistical analysis shows that this difference is less significant compared to the second k-NN algorithm (45-NN). A confidence level of 0.86 indicates a From the above analysis. We can overturn the null hypothesis that there is a significant difference in the average error rate between the two k-NN algorithms. There is a relatively high level of confidence in this variance.
8. The Plots /Tables with Descriptions and Discussion
The Confusion Matrix is a valuable tool utilized for assessing the performance of classification models, providing essential information regarding the correspondence between predicted and actual labels. Our analysis work heavily relies on this pivotal component.
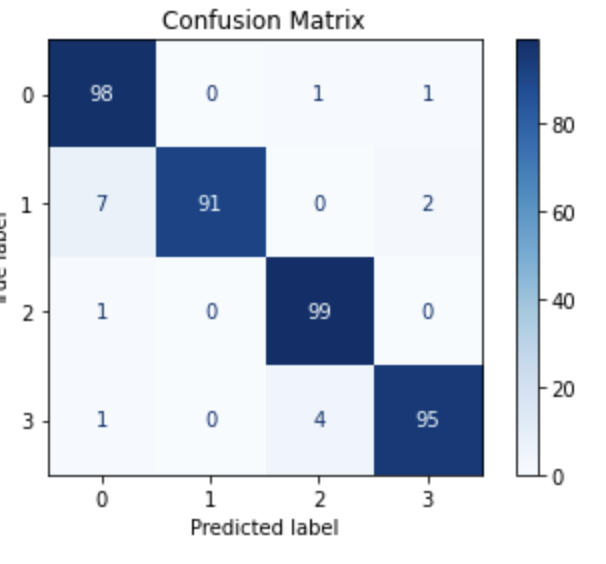
Figure 3. Confusion matrix of dataset
Figure 3 visually shows the satisfactory accuracy of classification. From a quantitative perspective, the accuracy, precision, recall and F1-score is selected for evaluation.
Accuracy quantifies the model's accuracy in a sample that is anticipated to be in a positive category, i.e. the number of samples that are properly predicted to be in a positive category as a fraction of all samples that are predicted to be in a positive category. The accuracy is 0.958.
\( Accuracy=\frac{TP+TN}{TP+TN+FP+FN} \)
The precision is around 0.968, showing that the model's accuracy is quite high in the sample projected as a positive class.
\( Precision=\frac{TP}{TP+FP} \)
The recall rate is the proportion of samples accurately predicted to be in a positive category as a percentage of all actual positive categories in positive categories. The recall is approximately 0.9675, meaning that the model correctly predicted the majority of the actual positive class samples, and the coverage is similarly excellent.
\( Recall=\frac{TP}{TP+FP} \)
The F1-score is a harmonic average of accuracy and recall that considers the model's correctness and comprehensiveness. The F1-Score is approximately 0.9675, which is the harmonic average of accuracy and recall after accounting for the model's accuracy and comprehensiveness.
\( F1=\frac{2∙Precision∙Recall}{Precision∙Recall} \)
9. Conclusion
The present study utilizes the Reuters news dataset to investigate the application of the k-NN algorithm, focusing on two crucial aspects: hyperparameter selection and result evaluation. Specifically, we employ the cross-validation method to determine optimal hyperparameters and achieve an effective parameter configuration. To evaluate the algorithm's effectiveness, we utilize a confusion matrix and related performance metrics. The results demonstrate that by selecting an appropriate k value, we can successfully classify the news dataset as intended. For future research, we want to explore adaptive hyperparameter selection methods in order to eliminate manual pre-specification requirements. Additionally, we aim to incorporate manifold learning concepts into our approach, enhance the clustering algorithm's capabilities, and adapt it for datasets with more complex features.
References
[1]. Zhang, M. L., & Zhou, Z. H. (2007). Ml-knn: a lazy learning approach to multi-label learning. Pattern Recognition, 40(7), 2038-2048.
[2]. Yong, Z., Youwen, L., & Shixiong, X. (2009). An improved knn text classification algorithm based on clustering. Journal of Computers, 4(3).
[3]. Liu, Z., Wang, C., & Wang, F. (2019). An improved knn text classification method. International Journal of Computational Science and Engineering, 20(3), 397.
[4]. Tang, Y., Jing, L., Li, H., & Atkinson, P. M. (2016). A multiple-point spatially weighted k-nn method for object-based classification. International Journal of Applied Earth Observation and Geoinformation, 52, 263-274.
[5]. Tao, Y. B., Lin, H., & Bao, H. J. (2008). Kd-tree based fast ray tracing for rcs prediction. ,81,(2008), 81, 329-341.
[6]. Lawton, G. (2022). Data preprocessing: Definition, key steps and concepts. Data Management. https://www.techtarget.com/searchdatamanagement/definition/data-preprocessing.
[7]. Patil, P. (2022). What is exploratory data analysis? Medium. https://towardsdatascience.com/exploratory-data-analysis-8fc1cb20fd15.
[8]. Christopher, A. (2021). K-Nearest Neighbor. Medium. https://medium.com/swlh/k-nearest-neighbor-ca2593d7a3c4.
[9]. Soucy, P., & Mineau, G. W. (2001). A simple KNN algorithm for text categorization. In Proceedings 2001 IEEE International Conference on Data Mining (pp. 647-648). San Jose, CA, USA. doi: 10.1109/ICDM.2001.989592.
[10]. Chen, J. (no date). Z-test definition: Its uses in statistics simply explained with example. Investopedia. https://www.investopedia.com/terms/z/z-test .
Cite this article
Yang,Q. (2024). Performance analysis of k-Nearest Neighbors classification on Reuters news article datasets. Applied and Computational Engineering,55,175-180.
Data availability
The datasets used and/or analyzed during the current study will be available from the authors upon reasonable request.
Disclaimer/Publisher's Note
The statements, opinions and data contained in all publications are solely those of the individual author(s) and contributor(s) and not of EWA Publishing and/or the editor(s). EWA Publishing and/or the editor(s) disclaim responsibility for any injury to people or property resulting from any ideas, methods, instructions or products referred to in the content.
About volume
Volume title: Proceedings of the 4th International Conference on Signal Processing and Machine Learning
© 2024 by the author(s). Licensee EWA Publishing, Oxford, UK. This article is an open access article distributed under the terms and
conditions of the Creative Commons Attribution (CC BY) license. Authors who
publish this series agree to the following terms:
1. Authors retain copyright and grant the series right of first publication with the work simultaneously licensed under a Creative Commons
Attribution License that allows others to share the work with an acknowledgment of the work's authorship and initial publication in this
series.
2. Authors are able to enter into separate, additional contractual arrangements for the non-exclusive distribution of the series's published
version of the work (e.g., post it to an institutional repository or publish it in a book), with an acknowledgment of its initial
publication in this series.
3. Authors are permitted and encouraged to post their work online (e.g., in institutional repositories or on their website) prior to and
during the submission process, as it can lead to productive exchanges, as well as earlier and greater citation of published work (See
Open access policy for details).
References
[1]. Zhang, M. L., & Zhou, Z. H. (2007). Ml-knn: a lazy learning approach to multi-label learning. Pattern Recognition, 40(7), 2038-2048.
[2]. Yong, Z., Youwen, L., & Shixiong, X. (2009). An improved knn text classification algorithm based on clustering. Journal of Computers, 4(3).
[3]. Liu, Z., Wang, C., & Wang, F. (2019). An improved knn text classification method. International Journal of Computational Science and Engineering, 20(3), 397.
[4]. Tang, Y., Jing, L., Li, H., & Atkinson, P. M. (2016). A multiple-point spatially weighted k-nn method for object-based classification. International Journal of Applied Earth Observation and Geoinformation, 52, 263-274.
[5]. Tao, Y. B., Lin, H., & Bao, H. J. (2008). Kd-tree based fast ray tracing for rcs prediction. ,81,(2008), 81, 329-341.
[6]. Lawton, G. (2022). Data preprocessing: Definition, key steps and concepts. Data Management. https://www.techtarget.com/searchdatamanagement/definition/data-preprocessing.
[7]. Patil, P. (2022). What is exploratory data analysis? Medium. https://towardsdatascience.com/exploratory-data-analysis-8fc1cb20fd15.
[8]. Christopher, A. (2021). K-Nearest Neighbor. Medium. https://medium.com/swlh/k-nearest-neighbor-ca2593d7a3c4.
[9]. Soucy, P., & Mineau, G. W. (2001). A simple KNN algorithm for text categorization. In Proceedings 2001 IEEE International Conference on Data Mining (pp. 647-648). San Jose, CA, USA. doi: 10.1109/ICDM.2001.989592.
[10]. Chen, J. (no date). Z-test definition: Its uses in statistics simply explained with example. Investopedia. https://www.investopedia.com/terms/z/z-test .