


1. Introduction
Taipei 101 building, one of the important indicators of Taiwan’s economic development, is one of the landmarks of Taipei City, where several multinational corporations are stationed to form the business circle of Taipei Xinyi District, which drives the financial trade of Taipei. The Taipei 101 building has a floor area of 398,000 square meters and a height of 508 meters, including 101 floors of office towers. Building design to the number 8 as a design unit, each 8-story building as a structural unit [1,2], the building face of the outward sloping 7 of the structure, every eight floors as a group, can both support the weight of the floor plate, and in order to cope with earthquakes and typhoons, the framework has the elasticity of each other successive, layer upon layer, to build a whole; the appearance of a multi-section structure, to dissolve the high-rise building caused by the airflow of the ground caused by the effect of the wind field, and the use of greenery [3]. The exterior is a multi-section structure, which solves the wind field effect on the ground caused by the airflow of the high-rise building, and is separated by green planting areas to ensure the safety and comfort of pedestrians; the walls are made of transparent heat-insulating curtain glass [4].
Modal analysis is the most basic and important analysis for all dynamics calculations [5]. We use modal analysis in ANSYS workbench to obtain data such as mode-specific intrinsic frequencies, damping ratios, and mode shapes, so that we can adjust the stiffness of some positions according to the frequencies, prevent resonance, and so on [6,7].
2. Modeling
We first simplified the building model to reduce errors and enhance the meshing and finite element calculation speed. Some detailed features were removed, such as facade decoration and gates. We simplify nonlinear taper cone structures to cones or lines and approximate complex geometries with simpler geometric shapes and disregard geometric details.
Then we created a relatively simple model and used basic geometric structures (trapeziums and cubes) to combine it into a simple entity based on the height, width, and length dimensions of this building.
We discovered that this building consists of three parts: the bottom trapezoid, eight small trapezoidal structures in the middle, and the upper structure. Therefore, we divided the construction process into three parts. First, we built a trapezoidal structure at the bottom based on the dimensions. Next, we constructed a small trapezoidal structure in the middle and replicated it seven times from bottom to top. Finally, at the top, we followed the blueprint and built the model by stacking blocks.
Regarding the construction of the trapezoidal structure, we established a vertical reference line along the central axis and drew the bottom and top surfaces at the same height based on dimension data. Then, we moved the top surface to its real-world height and finally combined the two surfaces to form the trapezoidal structure.
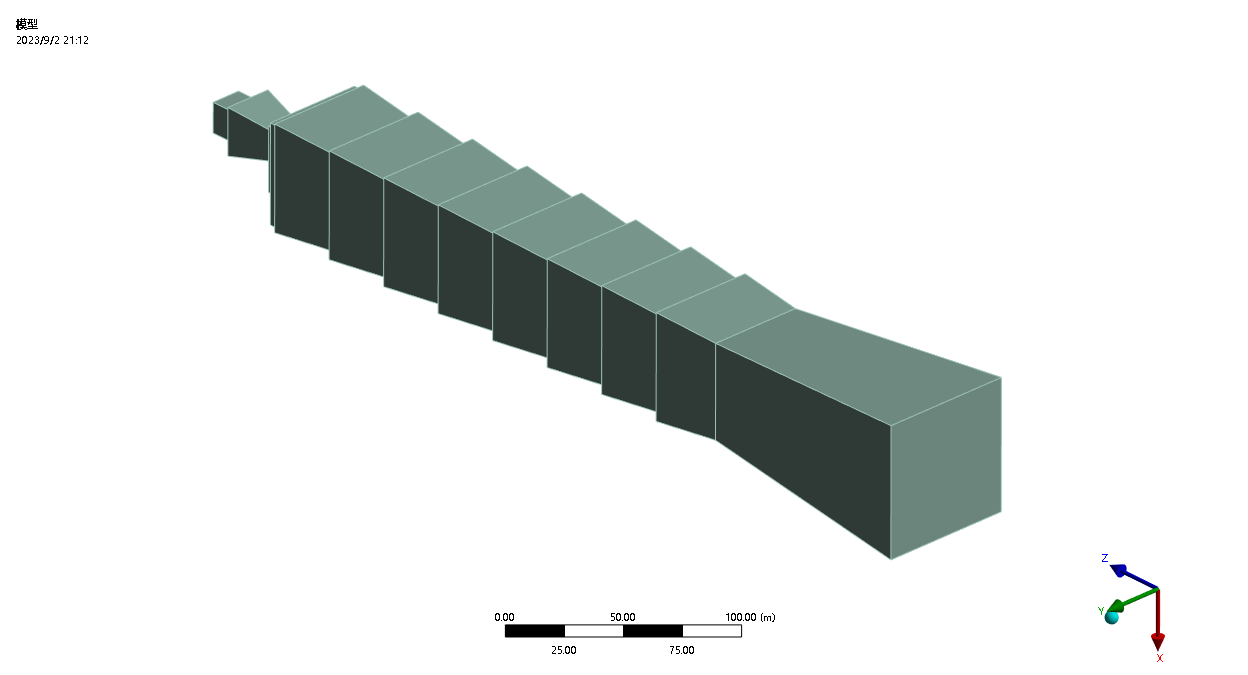
Figure 1. Phase 1 model
Clearly, when simulating with this version of the model, we treat this building as a solid, uniformly dense structure, which is clearly not consistent with reality.
To address this limitation, we decided to introduce a hollow area in the middle of the building model to make it closer to a real-world structure.
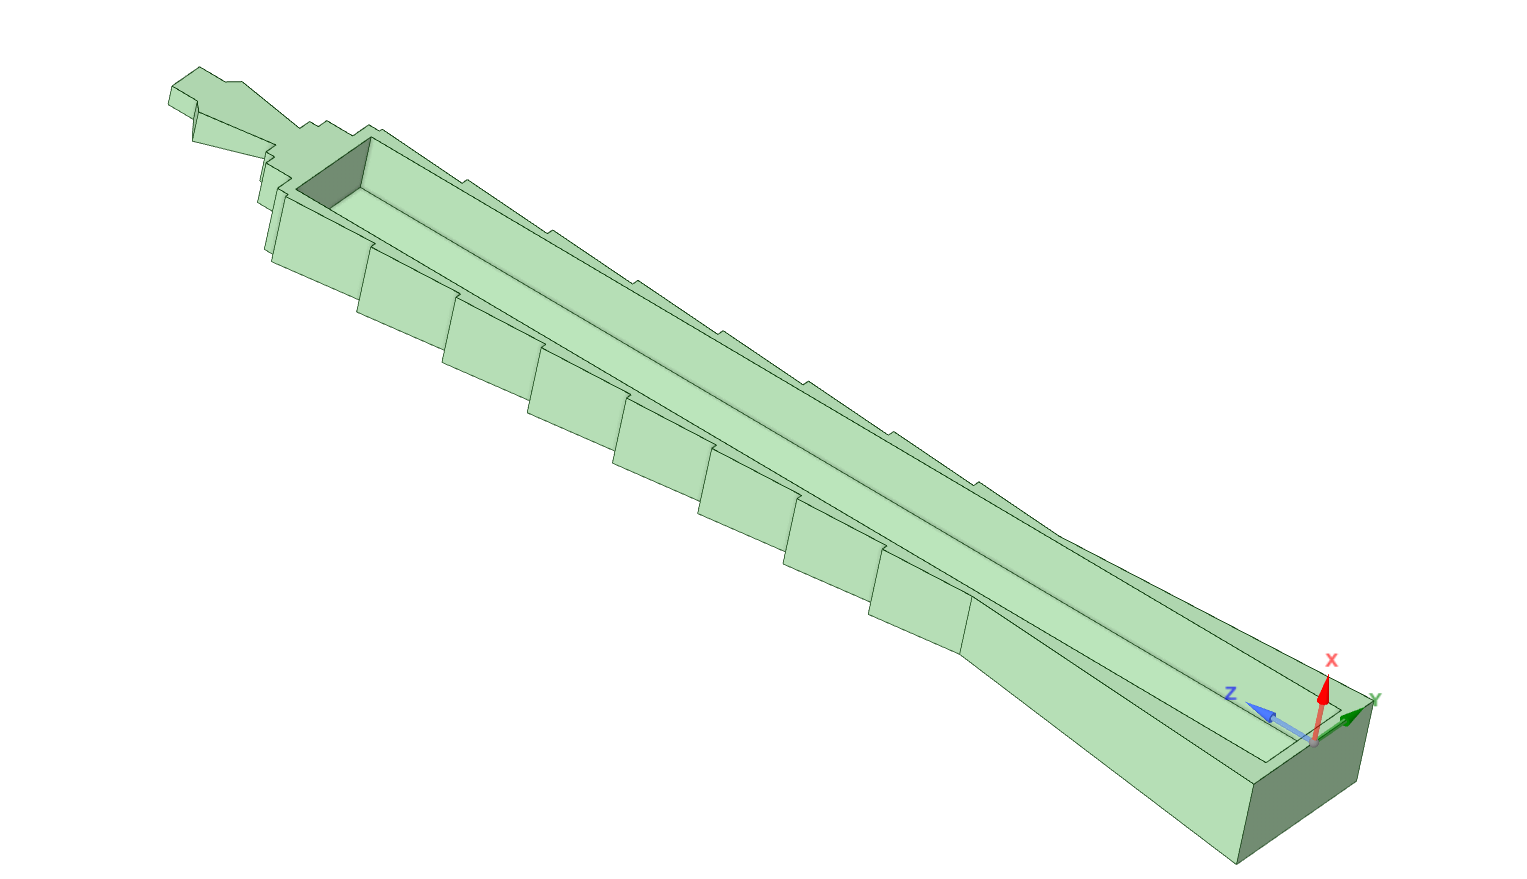
Figure 2. Phase 2 model
To maintain stable mass distribution in the upper and lower parts, we designed the hollow structure as a cubic construction. This version of the hollow structure closely mimics the density and mass distribution of real-life buildings, and the data analyzed from it can better approximate the conditions of actual buildings under various forces and deformations.
Moreover, since Taipei 101 Tower is located in the Pacific Ring of Fire earthquake zone and frequently faces strong typhoon impacts, a model structure that closely resembles reality can more accurately depict the building’s condition under various levels of natural disasters. This holds profound significance for disaster prevention, mitigation, and the protection of buildings.
3. ANSYS
ANSYS is a widely used engineering simulation software suite that enables engineers and designers to simulate and analyze the behavior of physical systems in a virtual environment. It offers a comprehensive range of tools for finite element analysis (FEA), computational fluid dynamics (CFD), electromagnetics, and more [8].
As a result, we use ANSYS for analysis, obtaining the condition of the building under different deformation scenarios by inputting parameters based on reality.
First, based on the real situation, we selected boundary conditions located at the bottom of the building (purple one in the image).
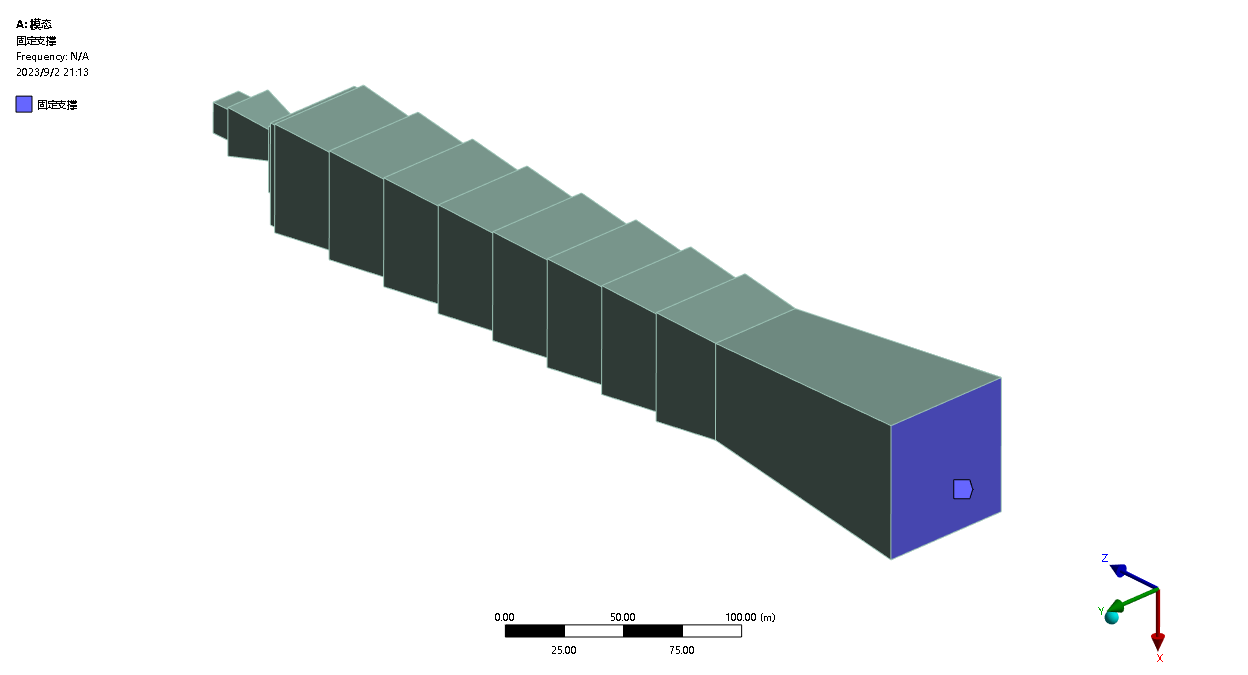
Figure 3. Boundary condition
4. Density
Second, to determine the equivalent density of the building model, we need to know the volume of the building model and the actual mass of the building.
To determine the equivalent density of the material and model of the building, we can use Ansys to calculate the volume of the model. Then, regarding the actual mass, we found out that it is 72,800 tons. Finally, we can approximate the building’s density to be around 69.839 kilograms per cubic meter by dividing the actual mass of the building by its volume.
5. Meshing
We attempted 11 different mesh scenarios, ranging from 1,715 nodes to 125,917 nodes, and plotted them on a line graph with the x-axis representing the number of nodes and the y-axis representing the frequency. We observed that the curve becomes relatively flat when the number of nodes exceeds 40,000, and the data we obtained showed minimal differences, which could be disregarded. Therefore, to reduce the computational burden of the analysis, we chose the mesh created of 24,391 elements and 42,939 nodes.
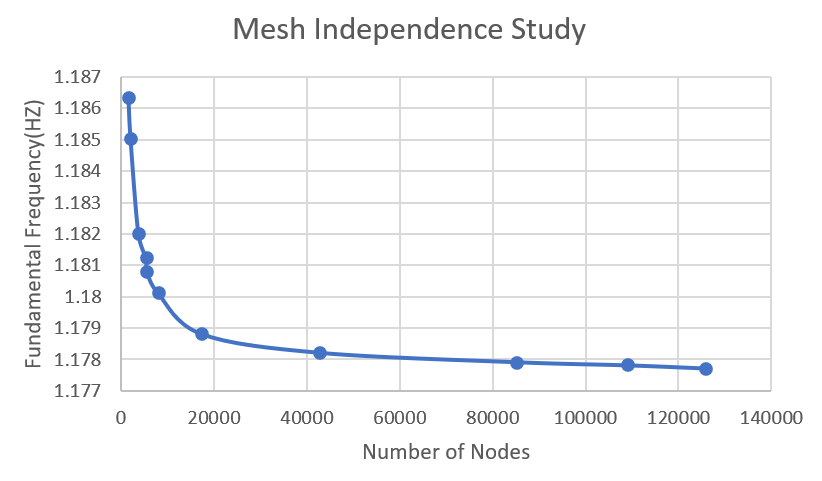
Figure 4. Mesh independence study
. 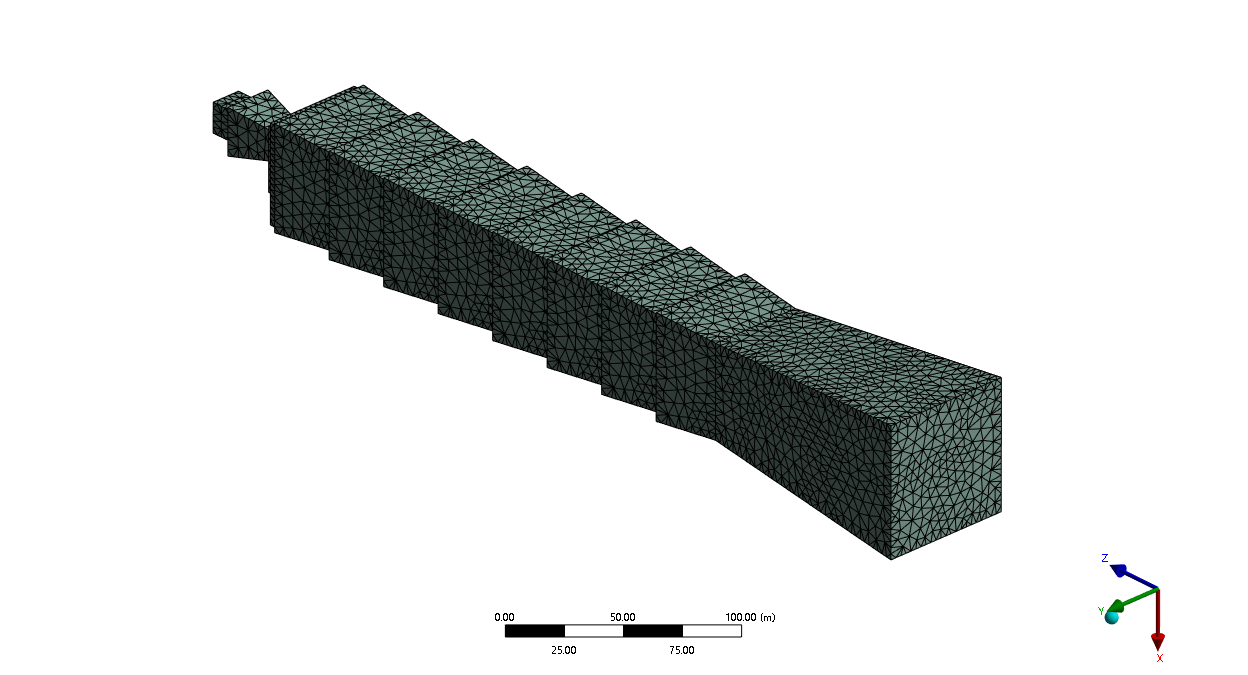
Figure 5. Meshing
6. Analysis of results
After completing the modal analysis, we can obtain the modal shape diagram and the corresponding natural frequency values. Below is a modal description of the building Through the investigation of the top 6 modes, it is found that the vibration of the Taipei 101building is primarily characterized by rigid motion and bending of the building. (a) and (b) are dislocations along the x axis, (c) and (d) are bending around the y axis, (e) are torsion around the z axis, and (f) are dislocations in the direction of the z axis [9].
|
|
(a) | (b) |
|
|
(c) | (d) |
|
|
(e) | (f) |
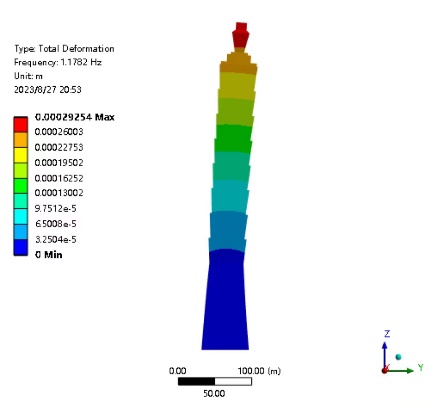
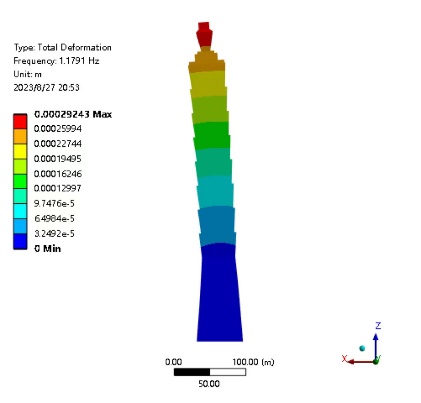
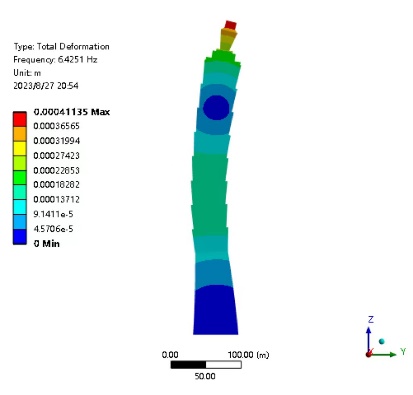
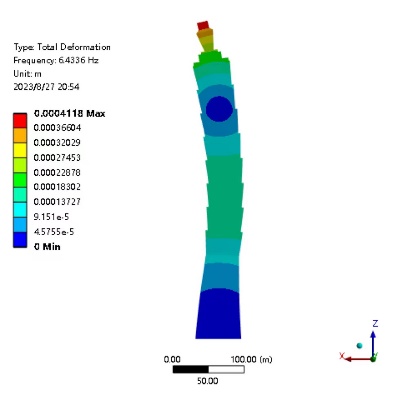
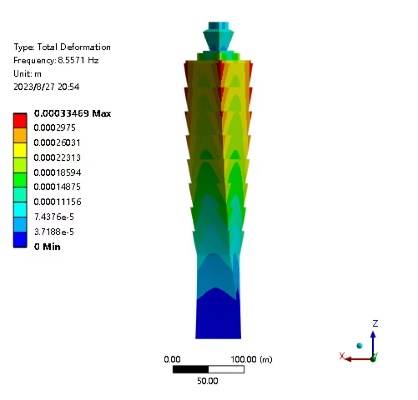
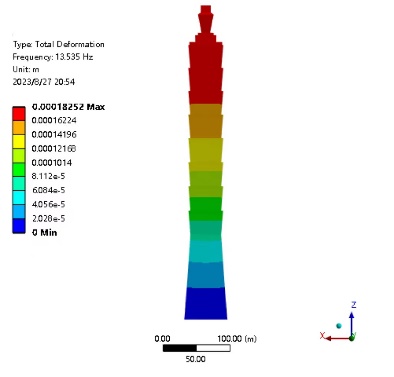
Figure 6. Modal analysis mode shape diagram of Taipei 101building (a) First-order mode (b) Second-order mode (c) Third-order mode (d) Fourth-order mode (e) Fifth-order mode (f) Sixth-order mode
The first 6 natural frequencies are got through the modal analysis of the building.
Table 1. Modal Analysis Results of Taipei 101 Building
Order | Frequency/Hz |
1 | 1.178 |
2 | 1.179 |
3 | 6.425 |
4 | 6.433 |
5 | 8.557 |
6 | 13.53 |
From the data presented in Table 1, it is evident that there are two modes at a frequency of 1.179Hz, two modes at 6.4Hz, and two modes within the range of 8.5Hz to 13.5Hz. The lower modes play a significant role in determining the dynamic behavior of the structure. The impact on the dynamic characteristics of the building is more pronounced for mode shapes beyond the fourth order. The frequency distribution of the modes is densely concentrated between 6Hz and 13Hz. Due to the susceptibility of the spindle to resonance, it is crucial to design it with utmost care. Additionally, the actual speed of the spindle should be adjusted to avoid reaching critical speeds that could induce resonance.
7. Conclusion
With the simplification of the building, we empty the middle of the model to approach reality. And we chose the mesh created of 24,391 elements and 42,939 nodes to decrease differences. The approximate density of the building is calculated to be approximately 69.839 kg per cubic meter. Through modal analysis of the Taipei 101 building, we identified two modes at 1.79Hz, two modes at 6.4Hz, and two modes at 8.5Hz to 13.5Hz. The modal density is highest between 6Hz and 13Hz, making the structure susceptible to resonance. Additionally, we obtained the corresponding frequencies. Between 6 and 13hz, we need to focus on construction.
References
[1]. Kourakis I. Structural Systems and Tuned Mass Dampers of Super-Tall Buildings: Case Study of Taipei 101[J]. Massachusetts institute of technology, 2007, p22
[2]. Chun-Hung C, Shaw-Song S, Shi-Ying K. The Structural Steel Construction and Supervision of TAIPEI 101 (Ⅰ)[J].Progress in Steal Building Structures, 2005.
[3]. Dzeng R J, Wen K S. Evaluating project teaming strategies for construction of Taipei 101 using resource-based theory[J]. International Journal of Project Management, 2005, 23(6):483-491.DOI:10.1016/j.ijproman.2005.02.004.
[4]. Dennis C. K. Poon, PE, M.S., Shaw-song Shieh, PE, SE, M.S. Leonard M. Joseph, PE, SE, M.S.3, Ching-Chang Chang, PE, SE, MS, “Structural Design of Taipei 101, the World’s Tallest Building” CTBUH 2004 October 10-13, Seoul, Korea, p271-273
[5]. Yong-hai Wu; Feng Wang,, “Modal Analysis of a Semi-trailer Frame Based on Ansys Workbench”, 2011 Fourth International Conference on Information and Computing
[6]. Zhang L, Brincker R. An Overview of Operational Modal Analysis: Major Development and Issues[J]. Aalborg Universitet, 2004.
[7]. Ramon C, Önder T. Modal analysis of elastic vibrations of incompressible materials using a pressure-stabilized finite element method[J]. Finite Elements in Analysis & Design,2022,206.
[8]. Heylen, W., S. Lammens, and P. Sas. “Modal Analysis Theory and Testing.” communications magazine IEEE (1997).
[9]. Parisa F, Mojtaba M, Mehrdad F, et al. Modal reduction-based finite element method for nonlinear FG piezoelectric energy harvesters[J]. Journal of Vibration and Control,2023,29(1-2).
Cite this article
Wang,H.;Sun,K.;Cao,J.;Zhang,Q.;Liang,M. (2024). Modal analysis of taipei 101 building . Applied and Computational Engineering,78,76-81.
Data availability
The datasets used and/or analyzed during the current study will be available from the authors upon reasonable request.
Disclaimer/Publisher's Note
The statements, opinions and data contained in all publications are solely those of the individual author(s) and contributor(s) and not of EWA Publishing and/or the editor(s). EWA Publishing and/or the editor(s) disclaim responsibility for any injury to people or property resulting from any ideas, methods, instructions or products referred to in the content.
About volume
Volume title: Proceedings of the 2nd International Conference on Mechatronics and Smart Systems
© 2024 by the author(s). Licensee EWA Publishing, Oxford, UK. This article is an open access article distributed under the terms and
conditions of the Creative Commons Attribution (CC BY) license. Authors who
publish this series agree to the following terms:
1. Authors retain copyright and grant the series right of first publication with the work simultaneously licensed under a Creative Commons
Attribution License that allows others to share the work with an acknowledgment of the work's authorship and initial publication in this
series.
2. Authors are able to enter into separate, additional contractual arrangements for the non-exclusive distribution of the series's published
version of the work (e.g., post it to an institutional repository or publish it in a book), with an acknowledgment of its initial
publication in this series.
3. Authors are permitted and encouraged to post their work online (e.g., in institutional repositories or on their website) prior to and
during the submission process, as it can lead to productive exchanges, as well as earlier and greater citation of published work (See
Open access policy for details).
References
[1]. Kourakis I. Structural Systems and Tuned Mass Dampers of Super-Tall Buildings: Case Study of Taipei 101[J]. Massachusetts institute of technology, 2007, p22
[2]. Chun-Hung C, Shaw-Song S, Shi-Ying K. The Structural Steel Construction and Supervision of TAIPEI 101 (Ⅰ)[J].Progress in Steal Building Structures, 2005.
[3]. Dzeng R J, Wen K S. Evaluating project teaming strategies for construction of Taipei 101 using resource-based theory[J]. International Journal of Project Management, 2005, 23(6):483-491.DOI:10.1016/j.ijproman.2005.02.004.
[4]. Dennis C. K. Poon, PE, M.S., Shaw-song Shieh, PE, SE, M.S. Leonard M. Joseph, PE, SE, M.S.3, Ching-Chang Chang, PE, SE, MS, “Structural Design of Taipei 101, the World’s Tallest Building” CTBUH 2004 October 10-13, Seoul, Korea, p271-273
[5]. Yong-hai Wu; Feng Wang,, “Modal Analysis of a Semi-trailer Frame Based on Ansys Workbench”, 2011 Fourth International Conference on Information and Computing
[6]. Zhang L, Brincker R. An Overview of Operational Modal Analysis: Major Development and Issues[J]. Aalborg Universitet, 2004.
[7]. Ramon C, Önder T. Modal analysis of elastic vibrations of incompressible materials using a pressure-stabilized finite element method[J]. Finite Elements in Analysis & Design,2022,206.
[8]. Heylen, W., S. Lammens, and P. Sas. “Modal Analysis Theory and Testing.” communications magazine IEEE (1997).
[9]. Parisa F, Mojtaba M, Mehrdad F, et al. Modal reduction-based finite element method for nonlinear FG piezoelectric energy harvesters[J]. Journal of Vibration and Control,2023,29(1-2).