


1. Problem Restatement
1.1. Background
Single-beam bathymetry [2] is a technique that determines water depth by utilizing the propagation characteristics of sound waves in water. Building upon this, the multi-beam bathymetric system was developed: it emits several beams simultaneously in a plane perpendicular to the ship’s track, and the receiving transducers capture the sound waves reflected from the seabed to calculate the water depth. In an ideal seabed, it can measure a continuous water depth swath centered on the survey line of the survey vessel. In a real seabed, however, significant topographical variations can lead to gaps or excessive overlap in the measurements, affecting the quality and efficiency of the survey.
1.2. Problem Statement
Based on the above background, the following four problems need to be addressed:
(1) Establish a mathematical model for the coverage width and overlap rate between adjacent swaths in multi-beam bathymetry, and solve the relevant indicators under known conditions of beam angle, slope, and central water depth.
(2) Develop a mathematical model for the coverage width of multi-beam bathymetry in a rectangular survey area when the survey line direction and the seabed slope’s normal have a known angle projection on the horizontal plane, and solve for the coverage width at different positions and angles.
(3) Design a survey line plan for a given range of unidirectional inclined seabed that covers the entire area and meets overlap rate requirements while minimizing the survey line length.
(4) Based on actual marine data obtained from single-beam bathymetry, design a multi-beam survey line plan that meets the conditions and solve for the relevant evaluation indicators.
2. Problem Analysis
2.1. Problem One: Calculation and Analysis of Coverage Width and Overlap Rate Between Adjacent Swaths in Multi-Beam Bathymetry
Combining the working principles of multi-beam bathymetry, geometric figures are abstracted from the problem. Using the relationships of the angles and sides of these figures, a calculation model for coverage width is established. On this basis, an overlap rate calculation model for the swaths is constructed. Using the known conditions provided in the problem, the indicators such as water depth, coverage width, and survey line overlap rate for the marine area are calculated based on the established models.
2.2. Problem Two: Calculation of Bathymetric Coverage Width in Three-Dimensional Space
Analytic geometry is used to solve for the actual depth and slope angles in three-dimensional space. Combining the model established in Problem One, a calculation model for coverage width and overlap rate in three-dimensional space is developed. Based on this model, the bathymetric coverage width at different positions and angles is solved.
2.3. Problem Three: Design of the Optimal Survey Line Plan for a Rectangular Marine Area
Using the model established in section 2.2, a dynamic programming algorithm is applied to find the shortest survey line length that meets the problem’s requirements. Backtracking is then performed to restore the path and obtain the optimal survey line plan that meets the problem’s requirements.
2.4. Problem Four: Design of Survey Lines Based on Sea Depth Data
Cubic spline interpolation is applied to the bathymetric data to obtain an approximate sea depth profile. Using the model established in Problem Three, the optimal plan that meets the requirements is determined.
3. Model Assumptions
To construct a more accurate mathematical model, the following reasonable assumptions are made based on the actual situation:
Assumption One: It is assumed that weather conditions are stable during the measurement process, and the influence of sea wind on the course of the survey vessel is not considered.
Assumption Two: It is assumed that the concentration of seawater is uniform throughout, and the effect of seawater impurities on the propagation of sound waves is ignored.
Assumption Three: It is assumed that the seabed topography remains unchanged throughout the year, and the impact of crustal movements on sea depth is not considered.
4. Notation Explanation
Symbol | Meaning |
D | Depth of the marine area |
W | Coverage width of multi-beam bathymetry |
\( α \) | Slope angle |
\( θ \) | Beam angle of the transducer |
\( η \) | Overlap rate between adjacent swaths |
\( β \) | Angle between the survey line direction and the seabed slope’s normal projection on the horizontal plane |
5. Model Establishment and Solution
5.1. Solution to Problem One
To solve Problem One, for establishing a coverage width calculation model for multi-beam bathymetry, the following geometric figures can be abstracted from the problem:
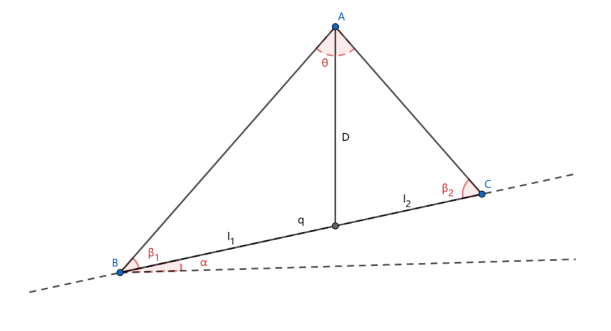
Figure 1. Schematic Diagram of Geometric Relationships
A is the position of the survey vessel. θ is the beam angle of the transducer. l1 and l2 are the coverage widths to be solved.
From the diagram, according to the law of sines, the following angle and side relationships exist:
\( \begin{cases} \begin{array}{c} \frac{D}{sin{{β_{1}}}}=\frac{{l_{1}}}{sin{\frac{θ}{2}}} \\ \frac{D}{sin{{β_{2}}}}=\frac{{l_{2}}}{sin{\frac{θ}{2}}} \end{array} \end{cases} \) | (1) |
Using the angle relationships in the figure, the coverage width can be derived as:
\( w={l_{1}}+{l_{2}}=Dsin{\frac{θ}{2}(\frac{1}{cos{(\frac{θ}{2}+α)}}+\frac{1}{cos{(\frac{θ}{2}-α)}})} \) | (2) |
Simplifying, we get:
\( w=\frac{2Dsinθcosα}{cosθ+cos2α} \) | (3) |
The depth D calculation formula is:
\( D=h-xtanα \) | (4) |
Where h is the depth of the seawater at the central point, and x is the distance from the survey line to the central point.
In summary, the coverage width calculation model is:
\( w=\frac{2(h-xtanα)sinθcosα}{cosθ+cos2α} \) | (5) |
With the coverage width known, according to the definition of overlap rate in the problem, the formula is:
\( η=1-\frac{d}{w}=1-\frac{d(cosθ+cos2α)}{2(h-xtanα)sinθcosα} \) | (6) |
This is the overlap rate calculation model.
When the beam angle of the multi-beam transducer is 120°, the slope is 1.5°, and the seawater depth at the central point of the marine area is 70 m, based on the indicator values listed in Table 1, the calculated results for seawater depth, coverage width, and other indicators are as follows:
Table 1. Calculation Results for Problem One
Distance from the Center Point of the Survey Line (m) | -800 | -600 | -400 | -200 | 0 | 200 | 400 | 600 | 800 |
Sea Water Depth (m) | 91 | 86 | 86 | 75 | 70 | 65 | 60 | 54 | 49 |
Coverage Width (m) | 316 | 298 | 298 | 261 | 243 | 225 | 207 | 189 | 170 |
Overlap Rate with Previous Survey Line (%) | —— | 32.80 | 32.79 | 23.45 | 17.72 | 11.07 | -4.24 | -6.09 | -17.42 |
5.2. Solution to Problem Two
To solve Problem Two, based on the problem description, we first need to determine the actual slope angle and depth when the angle between the survey line direction and the seabed slope’s normal projection on the horizontal plane is β. Then, using the model established in Problem One, we develop a coverage width calculation model in three-dimensional space.
The following method is used to calculate the actual slope and depth:
Establish a right-handed coordinate system with the projection direction of the slope normal on the horizontal plane, the direction perpendicular to this projection and parallel to the horizontal plane, and the vertical upward direction. The schematic diagram is as follows:
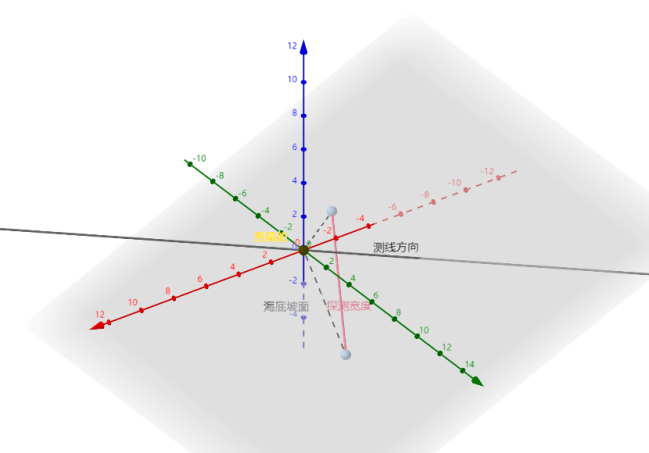
Figure 2. Right-Handed Coordinate System Schematic
When the angle between the survey line direction and the seabed slope’s normal projection on the horizontal plane is β, the line representing the survey line direction can be expressed as:
\( \begin{cases} \begin{array}{c} z=0 \\ xtanβ-y=0 \end{array} \end{cases} \) | (7) |
The direction vector of the line is:
\( {v_{1}}=(1,tanβ,0) \) | (8) |
Given the known slope α, the slope normal vector can be expressed as:
\( {v_{2}}=(tanα,0,1) \) | (9) |
Using the vectors obtained above, the direction vector of the line for calculating the coverage width can be determined as:
\( u={v_{1}}×{v_{2}} \) | (10) |
That is:
\( u=(-tanβ,1,tanαtanβ) \) | (11) |
Thus, the cosine of the actual slope angle is:
\( cos{α_{r}}=\sqrt[]{\frac{{tan^{2}}β+1}{{tan^{2}}β+1+{tan^{2}}β{tan^{2}}α}} \) | (12) |
Similarly, using analytic geometry, the actual depth can be calculated as:
\( ω=h-xtanαcosβ \) | (13) |
In summary, after determining the actual slope angle and depth, and combining with the model established in Problem One, the coverage width calculation model in three-dimensional space is as follows:
\( w=\frac{2(h-xtanαcosβ)cos{α_{r}}sinθ}{cosθ+2{cos^{2}}{α_{r}}-1} \) | (14) |
When the beam angle of the multi-beam transducer is 120°, the slope is 1.5°, and the seawater depth at the central point of the marine area is 120 m, the calculated coverage width of the survey line is as follows:
Table 2. Calculation Results for Problem Two
Coverage Width (m) | Distance from Measurement Ship to the Center of the Sea Area (nautical miles) | ||||||||
0 | 0.3 | 0.6 | 0.9 | 1.2 | 1.5 | 1.8 | 2.1 | ||
Survey Line Direction Angle (°) | 0 | 416 | 466 | 516 | 567 | 617 | 668 | 718 | 768 |
45 | 416 | 452 | 488 | 523 | 559 | 595 | 630 | 666 | |
90 | 417 | 417 | 417 | 417 | 417 | 417 | 417 | 417 | |
135 | 416 | 381 | 345 | 309 | 273 | 238 | 202 | 166 | |
180 | 416 | 365 | 315 | 264 | 214 | 164 | 113 | 63 | |
225 | 416 | 381 | 345 | 309 | 273 | 238 | 202 | 166 | |
270 | 417 | 417 | 417 | 417 | 417 | 417 | 417 | 417 | |
315 | 416 | 452 | 488 | 523 | 559 | 595 | 630 | 666 | |
5.3. Solution to Problem Three
To solve Problem Three, when the survey lines run in an east-west direction, the coverage widths at both ends are significantly different, making it impossible to meet the overlap rate requirements. Therefore, a survey line scheme along the north-south direction is designed. Each survey line can be uniquely determined by the positions at the north and south ends, and the position of each line is influenced by the position of the previous line. The occurrence position of the previous survey line is determined by the overlap rate indicator. Therefore, the optimal survey line scheme can be designed using a dynamic programming algorithm [3]. The schematic diagram is as follows:
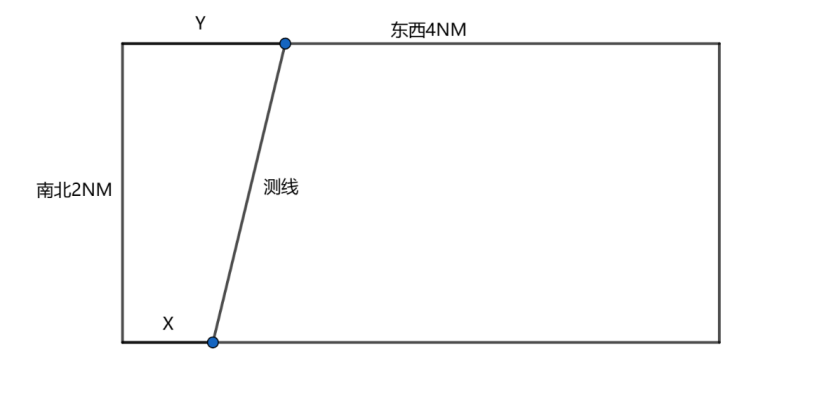
Figure 3. Survey Line Planning Schematic
The dynamic transition equation is as follows:
\( dp(X,Y)=\underset{(x,y)∈Ω}{min} (dp(x,y))+l \) | (15) |
Where \( l \) represents the length of the survey line,
Ω is controlled by the overlap rate index, satisfying the following conditions:
\( 10\%≤1-\frac{d}{w}≤20\% \) | (16) |
Ω is determined as follows:
\( Ω=\lbrace (x,y)\rbrace \) | (17) |
x and y satisfy
\( \begin{cases} \begin{array}{c} X-0.9w≤x≤X-0.8w \\ Y-0.9w≤y≤Y-0.8w \end{array} \end{cases} \) | (18) |
Using the data provided in the problem, the shortest survey line length that can cover the entire marine area and meet the overlap rate requirements is calculated to be 114,824 meters.
The specific scheme is as follows:
Table 3. Coordinates of Start and End Points of Survey Lines in an Ideal Marine Area
Start Point (South) | End Point (North) | Start Point (South) | End Point (North) | Start Point (South) | End Point (North) | Start Point (South) | End Point (North) |
36 | 36 | 385 | 385 | 571 | 571 | 671 | 671 |
93 | 93 | 415 | 415 | 587 | 587 | 680 | 680 |
145 | 145 | 443 | 443 | 602 | 602 | 688 | 688 |
193 | 193 | 469 | 469 | 616 | 616 | 695 | 695 |
238 | 238 | 493 | 493 | 629 | 629 | 702 | 702 |
279 | 279 | 515 | 515 | 641 | 641 | 708 | 708 |
317 | 317 | 535 | 535 | 652 | 652 | 714 | 714 |
352 | 352 | 554 | 554 | 662 | 662 | —— | —— |
5.4. Solution to Problem Four
For Problem Four, the seabed depth conditions provided in the problem are as follows:
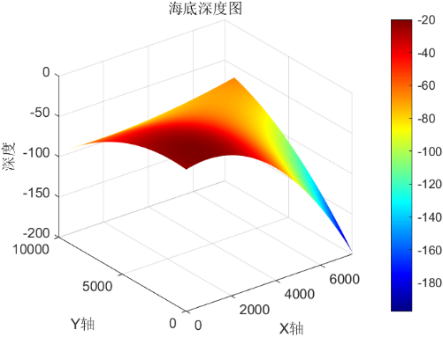
Figure 4. Seabed Depth Condition Heatmap
From the image, it is observed that the depth variation in this marine area is relatively smooth. Therefore, cubic spline interpolation [4] is used to complete this discrete plane.
Using the above method, approximate seabed depths at any position in this marine area can be obtained.
For a survey vessel located at any position, approximate width [5] is constructed based on the vessel’s inclination at the projection point, as shown in the following figure:
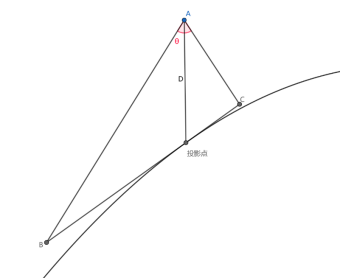
Figure 5. Approximate Width Schematic
Where A represents the survey vessel, BC represents the approximate width, and the slope angle is determined by:
\( α=arctan(\frac{∂f}{∂u}) \) | (19) |
Where f represents the interpolation plane, and u is a unit vector perpendicular to the survey line and parallel to the horizontal plane direction. Since the first derivative of cubic spline interpolation is continuous, this derivative certainly exists.
In conclusion, specific slope angles and depths at particular locations can be determined. Utilizing the algorithm designed in Problem Three, the overlap rate constraint can be relaxed to 5% to 30%, resulting in the shortest survey line length of 398,059 meters.
The specific scheme is as follows:
Table 4. Coordinates of Start and End Points of Survey Lines in the Actual Marine Area
Start Point (West) | End Point (East) | Start Point (West) | End Point (East) | Start Point (West) | End Point (East) | Start Point (West) | End Point (East) |
4 | 4 | 154 | 332 | 315 | 574 | 526 | 759 |
16 | 16 | 166 | 354 | 329 | 590 | 547 | 772 |
28 | 43 | 178 | 375 | 343 | 606 | 568 | 784 |
40 | 74 | 190 | 395 | 357 | 621 | 590 | 796 |
52 | 104 | 202 | 415 | 372 | 636 | 614 | 808 |
64 | 133 | 214 | 434 | 387 | 651 | 639 | 820 |
76 | 161 | 226 | 453 | 402 | 665 | 665 | 832 |
87 | 188 | 238 | 471 | 418 | 679 | 693 | 844 |
98 | 214 | 250 | 489 | 434 | 693 | 722 | 856 |
109 | 239 | 263 | 507 | 451 | 707 | 753 | 867 |
120 | 263 | 276 | 524 | 469 | 720 | 786 | 878 |
131 | 287 | 289 | 541 | 487 | 733 | 822 | 889 |
The overall alignment of the survey lines in this plan runs east to west. As the plan does not allow for overlap rates below 0%, there are no areas left unmeasured. Using a discrete method, the length where overlap rates exceed 20% was found to be 25,759 meters, accounting for 6.4% of the total length.
6. Evaluation and Improvement of the Model
6.1. Advantages of the Model
(1) The use of dynamic programming algorithm to compute the optimal survey line scheme, ensuring it is globally optimal with high efficiency and innovative approach.
(2) Throughout the modeling process, there is a consistent and coherent approach to problem-solving, enhancing the model’s ability to integrate relationships and mutual influences among different issues, thereby achieving comprehensive results.
(3) Employing cubic spline interpolation to supplement the discrete points of the seabed depth plane ensures continuity in derivatives, perfectly adapting to the model’s requirements for approximating slope direction, thus achieving high precision.
6.2. Limitations of the Model
(1) Despite performing well in the given case study, the model still requires enhancement in adaptability. Changes in marine conditions (e.g., depth, slope) or survey line requirements (e.g., overlap rates) may necessitate adjustments to the model.
(2) The use of dynamic programming algorithm to find the shortest survey lines involves considerations of computational scale, potentially leading to lower overall precision. Increasing precision may lead to unpredictable computation times, indicating room for further optimization.
6.3. Model Improvement and Extension
(1) Enhance the dynamic programming part by designing more efficient dynamic transition equations to reduce time complexity.
(2) Improve efficiency in spline interpolation, possibly by employing more efficient interpolation methods to handle scenarios with a larger number of discrete points on the seabed.
7. Conclusion
In summary, this study primarily investigates the following four issues, and the conclusions are summarized as follows:
Establishment of Coverage Width Calculation Model: \( w=\frac{2(h-xtanα)sinθcosα}{cosθ+cos2α} \) . Based on this, a model for calculating overlap rate \( η=1-\frac{d(cosθ+cos2α)}{2(h-xtanα)sinθcosα} \) , enabling the determination of coverage width and overlap rate at respective positions.
Establishment of Three-Dimensional Coverage Width Calculation Model from the Origin of the Measurement Ship: \( w=\frac{2(h-xtanαcosβ)cos{α_{r}}sinθ}{cosθ+2{cos^{2}}{α_{r}}-1} \) denotes the actual slope angle. Where \( {α_{r}} \) represents the actual slope angle. Combining known information about the marine area, the coverage width of survey lines at various positions in the sea is determined under different beta angles.
Finding the Shortest Survey Line Scheme: Using dynamic programming algorithm with the dynamic transition equation \( dp(X,Y)=\underset{(x,y)∈Ω}{min} (dp(x,y))+l \) , where \( Ω \) is determined by overlap rate indicators. The total length of measurement under this scheme is calculated as 114,824 meters, leading to the identification of the optimal survey line scheme.
Design of Specific Survey Line Scheme: Integrating sea depth data, cubic spline interpolation is employed to complete the seabed’s discrete point plane, enabling approximate depth determination at any location. Approximate slope is constructed based on the tilt at the seabed projection point of the measurement ship. Using the designed algorithm, under the condition of relaxing overlap rate to 5%-30%, the shortest lateral line length is found to be 398,059 meters. Consequently, a specific survey line scheme is derived. Under this scheme, the percentage of missed sea areas is 0%, and the total length of areas with overlap exceeding 20% is 25,759 meters, accounting for 6.4%.
In conclusion, this study establishes a model for calculating coverage width and overlap rate in multi-beam survey systems, designs a reasonable measurement scheme, and optimizes it. These solutions will contribute to addressing more complex marine measurement issues and advance the development of marine science research.
References
[1]. Yu, Q. Y. (2022). Seabed terrain measurement based on multi- beam depth sounding technology. Surveying and Spatial Geoinformation, 45(09), 262- 264.
[2]. Guo, Z. J. , He, W. , & Luo, Y. (2021). Analysis and practice of precise single- beam depth sounding. Hydropower and Water Resources Quick Report, 42(05), 19- 22. https: / / doi. org/ 10. 15974/ j. cnki. slsdkb. 2021. 05. 005
[3]. He, Y. Q. (2020). Application of dynamic programming algorithm in engineering. Electronic Technology and Software Engineering, 12, 121- 122.
[4]. Li, G. Q. (2001). Formation of smooth curves from sampled data based on cubic spline interpolation. Computing Technology and Automation, 01, 59- 62.
[5]. Wang, N. , Huang, J. , & Rao, T. T. (2023). Optimization model of survey lines under multi- beam depth sounding system. Audio Engineering, 47(06), 61- 64. https: / / doi. org/ 10. 16311/ j. audioe. 2023. 06. 018
Cite this article
Chen,X.;Chen,X. (2024). Research on multi-beam survey line system based on dynamic programming algorithm. Applied and Computational Engineering,86,42-50.
Data availability
The datasets used and/or analyzed during the current study will be available from the authors upon reasonable request.
Disclaimer/Publisher's Note
The statements, opinions and data contained in all publications are solely those of the individual author(s) and contributor(s) and not of EWA Publishing and/or the editor(s). EWA Publishing and/or the editor(s) disclaim responsibility for any injury to people or property resulting from any ideas, methods, instructions or products referred to in the content.
About volume
Volume title: Proceedings of the 6th International Conference on Computing and Data Science
© 2024 by the author(s). Licensee EWA Publishing, Oxford, UK. This article is an open access article distributed under the terms and
conditions of the Creative Commons Attribution (CC BY) license. Authors who
publish this series agree to the following terms:
1. Authors retain copyright and grant the series right of first publication with the work simultaneously licensed under a Creative Commons
Attribution License that allows others to share the work with an acknowledgment of the work's authorship and initial publication in this
series.
2. Authors are able to enter into separate, additional contractual arrangements for the non-exclusive distribution of the series's published
version of the work (e.g., post it to an institutional repository or publish it in a book), with an acknowledgment of its initial
publication in this series.
3. Authors are permitted and encouraged to post their work online (e.g., in institutional repositories or on their website) prior to and
during the submission process, as it can lead to productive exchanges, as well as earlier and greater citation of published work (See
Open access policy for details).
References
[1]. Yu, Q. Y. (2022). Seabed terrain measurement based on multi- beam depth sounding technology. Surveying and Spatial Geoinformation, 45(09), 262- 264.
[2]. Guo, Z. J. , He, W. , & Luo, Y. (2021). Analysis and practice of precise single- beam depth sounding. Hydropower and Water Resources Quick Report, 42(05), 19- 22. https: / / doi. org/ 10. 15974/ j. cnki. slsdkb. 2021. 05. 005
[3]. He, Y. Q. (2020). Application of dynamic programming algorithm in engineering. Electronic Technology and Software Engineering, 12, 121- 122.
[4]. Li, G. Q. (2001). Formation of smooth curves from sampled data based on cubic spline interpolation. Computing Technology and Automation, 01, 59- 62.
[5]. Wang, N. , Huang, J. , & Rao, T. T. (2023). Optimization model of survey lines under multi- beam depth sounding system. Audio Engineering, 47(06), 61- 64. https: / / doi. org/ 10. 16311/ j. audioe. 2023. 06. 018