


1. Introduction
The analysis of emotions is a valuable tool that can provide insights into an individual’s personality traits, behavioral patterns, and psychological well-being. Emotions are expressed through modalities, such as speech, text, and facial expressions, with each channel offering unique cues about one’s emotional state. With the widespread use of social media, people started to share their thoughts and feelings more frequently through posts and comments in the form of text.
Text-based emotion analysis plays an important role in real-life situations. It can be applied to movie reviews [1], where people’s attitudes and evaluations can be detected. After knowing whether most viewers like or dislike the movie, streaming platforms can make decisions on the purchase of display rights. It is also necessary for business market research [2] [3] [4]. Designers can extract users’ emotions and opinions towards existing products from the feedback, which can be useful for further modifications and future product design. Also, it can help to detect abnormal depression and potential suicide from people’s posts and comments [5]. As a result, it is necessary to have a model that can classify emotions detected from texts, and any enhancement of model performance can offer much convenience and benefits. This paper aims to develop a model that can have improved classification performance. To achieve this intended result, a new ensemble model that uses the stacking of deep learning models and a traditional machine learning model is proposed. This process is done with the dataset from the Kaggle website, which is a collection of texts and emotions with the six most common emotion categories, including joy, sadness, surprise, fear, love, and anger.
The main contributions of this paper are as follows:
examine the performance of traditional machine learning models and deep learning models;
develop and evaluate the performance of new models using the ensemble learning method.
The rest of this paper is organized as follows. Section 2 surveys previous works and research related to emotion analysis. Section 3 explains the techniques that are utilized in this study. Section 4 states the experimental procedures and results. Section 5 analyzes the results and discusses the advantages and limitations. Section 6 concludes the experiment and proposes possible future work.
2. Related Work
This section surveys and outlines related works and previous research on emotion models and text-based classification methods.
2.1. Emotion Model
There are two types of emotion models, categorical model and dimensional model. Ekman Paul proposed a categorical model with six basic emotions, which are sadness, anger, fear, disgust, joy, and surprise [6]. Tomkins and McCarter proposed a nine-level categorical model with disgust, surprise-startle, anger-rage, anxiety, fear-terror, contempt, joy, shame, and interest-excitement [7]. The dominant dimensional model, proposed by Russell, characterized emotions by arousal and valence, which quantify the excitement of feeling and the polarity (positive, negative, neutral), respectively [8].
2.2. Emotion Classification Model
Most previous studies are based on the categorical emotion model. Multiple methods have been used by researchers to perform emotion detection and classification, which can be categorized into three approaches: knowledge-based method, machine learning based method, and hybrid method.
2.2.1. Knowledge-based Method
For the knowledge-based method, linguistic resources are used to assign emotion categories to the text inputs, which are based on the patterns and the pre-defined rules. The typical resources include lexicons, ontologies, and dictionaries.
Rahman, Islam, and Ahmed used a keyword-based method to classify text into twenty-five emotion categories on the sentence level, which obtained 80% accuracy. They utilized various factors to determine keyword class, such as negation, proverbs, and emoticons [9]. Seal, Roy, and Basak designed a rule-based model. They considered additional factors, modifiers and domain specific terms, and it has shown that the average accuracy for analyzing online reviews has been improved [10].
2.2.2. Machine Learning Based Method
For supervised learning, Mohammad and Saif used hashtags as emotion labels for Twitter posts, since there is limited labeled Twitter data, and it is time-consuming and difficult to annotate. It is shown that the self-labeled hashtag annotations are consistent with real emotion labels [11]. Hasan, Rundensteiner, and Agu also employed Twitter hashtags as labels, and they additionally used emoticons to train the classifiers [12]. Go, Bhayani and Huang extracted emoticons and found that the classifier could effectively learn from the remaining non-emoticon features [13].
To further resolve the problem of lacking labeled data, some researchers proposed unsupervised learning models. Agrawal and An developed a model that depends only on semantic relatedness between words and emotional concepts, and the results proved that the model is as effective as other supervised methods [14]. Yasmina, Hajar, and Hassan calculated the relatedness of word input and representative words, which is quantified by PMI, and they used the average PMI of the text to do classification. The model achieved a high accuracy of 92.75% [15].
The semi-supervised learning method is also widely used to solve the problem of limited labeled data. Some researchers developed a classification model that split each review into subjective and objective segments, and the model achieved an accuracy of more than 80% [16]. Zhou, Chen, and Wang identified the reviews that should be labeled as the training data, and they used both labeled and unlabeled data to build the final AND model [17].
Recently, there have been lots of works on text-based emotion classification using deep learning models, which achieved a higher accuracy and obtained a better model performance. Xu and some researchers proposed a CNN-based model to classify microblogs [18]. They used the Word2vec network, and the model had 7.0% higher accuracy than traditional machine learning models. Zahiri and Choi proposed four types of sequence-based CNN models to perform classification task on the TV show transcript, which has achieved promising accuracy [19].
2.2.3. Hybrid Method
The hybrid method is an approach that combines knowledge-based method and machine learning based method. Tiwari, Raju, Phonsa, and Deepu proposed a hybrid approach using keyword method to extract semantic information and a supervised learning model to extract features [20]. It has been proven to be effective with 80.2% precision and 83.5% recall. Grover and Verma used a rule-based engine to detect if there is emotion in regional language text input and trained the machine learning models SVM and Naive Bayes to classify text into six emotion classes [21].
3. Methodology
3.1. Introduction of Dataset
The dataset used for this experiment is a collection of texts and emotions, which is a public dataset on the Kaggle website. There are 20,000 observations and two variables, text and emotion. Emotion is classified into six classes, which are joy, sadness, anger, fear, love, and surprise. The number of samples in each emotion class is shown in Table 1.
Table 1. Number of samples in each emotion category
Emotion category | Number of Samples |
joy | 6761 |
sadness | 5797 |
anger | 2709 |
fear | 2373 |
love | 1641 |
surprise | 719 |
3.2. Overview of Experiment
The objective of this experiment is to categorize a given text input into the most likely emotion class. The framework is shown in Figure 1. There are three main components: data pre-processing, the training of base models, and the development and comparison of new models using the ensemble method.
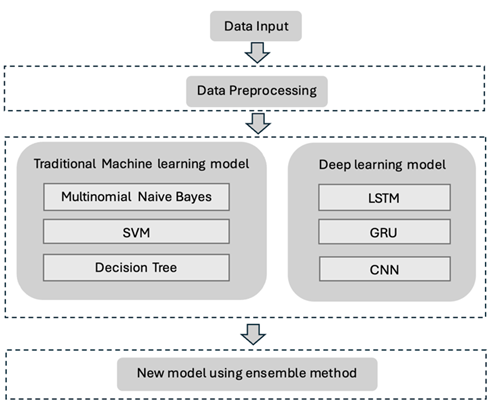
Figure 1. Framework of this experiment
3.3. Data Pre-processing
Data Pre-processing is a critical step before training machine learning models. It can help to increase data quality through cleaning and to make data consistent through standardization and normalization. This step also enables feature engineering, contributing to improved accuracy and faster convergence.
3.3.1. Natural Language Processing
Natural Language Processing (NLP) is a field of artificial intelligence that focuses on making computers understand human natural languages. It is essential to pre-process the dataset with NLP techniques to make models understand the textual data input. In this experiment, the techniques of stop word removal, lemmatization, and tokenization are used to pre-process the entire dataset. The Natural Language Toolkit (NLTK) package in Python is used for performing the NLP tasks.
Stop word removal is a process that can remove non-important words, such as articles and auxiliary verbs. Lemmatization can remove inflectional endings of words and transform them into the normalized form. The reason that lemmatization is used rather than steamming is that it is important to keep the meaning of words for this emotion classification task. Tokenization is a technique that splits text input into individual words or fragments. It produces a word index and tokenized text, where the word index can map the word to numerical identifiers, and the tokenized text replaces each word with its corresponding numerical token [22].
3.3.2. TF-IDF Vectorization
Term Frequency-Inverse Document Frequency(TF-IDF) vectorization is a technique that can transform text input into numerical vector input. It focuses on capturing the importance of terms in a document relative to a corpus of documents. Term Frequency(TF) measures the frequency of a term in a document. Terms that appear more frequently in a document are given with higher weights. Inverse document frequency(IDF) measures the importance of a term across multiple documents. It gives higher weights to the terms that occur less often across multiple documents [23]. TF-IDF can be calculated as follows:
\( TF-IDF=TF ×IDF \)
where \( TF=\frac{Number of times that a term appears in the document}{Total number of terms in the document} \)
\( IDF=log( \frac{Number of the documents in the corpus}{Number of documents in the corpus contain the term} ) \)
3.3.3. SMOTETomek
SMOTETomek is a resampling technique that can balance the imbalanced dataset. It can help to mitigate bias, and thus the classifiers can form clearer decision boundaries and obtain better generalization. It firstly performs over-sampling by SMOTE and subsequently performs under-sampling by Tomek link. SMOTE technique synthesizes a new data point utilizing k-nearest neighbours of a randomly selected data point in the minority class, it is better than direct duplication since it can reduce overfitting. Tomek link is a technique that constantly removes a pair of data points from different classes that are too close to each other. In this case, the two points removed are considered as noisy or broadline data points [24]. In this dataset, the differences between the number of samples in minority and majority classes are large, so the utilization of SMOTETomek is more reasonable compared with using either the over-sampling method or the under-sampling method.
3.4. Machine Learning Models
Machine learning models proved to be effective in classification tasks. For this experiment, Naive Bayes classifier, SVM, Decision Tree, CNN, GRU, and LSTM models were trained independently as base models. The new models are trained using the stacking ensemble learning method.
3.4.1. Naive Bayes Classifier
Naive Bayes classifier is a probability-based classifier that applies the Bayes Theorem, presented by the following formula. It is demonstrated that the probability of a data input \( B \) belonging to a certain category \( A \) can be known by observing the features of \( B \) .
\( P(A|B)= \frac{P(B|A) P(A)}{P(B)} \)
In this experiment, Multinational Naive Bayes classifier should be trained since it is a multi-class classification task. The probability of the text input \( B \) belongs to each emotion class \( {c_{j}} \) can be calculated by observing the sets of features \( {f_{1}} \) , \( {f_{2}},{f_{3}},{f_{1}}… {f_{m}} \) of \( B \) , shown by the following formula where \( {n_{i}}(B) \) is the frequency of feature \( {f_{i}} \) in \( B \) [25].
\( P({c_{j}}|B)= \frac{P({c_{j}})×\prod _{i=1}^{m}P({f_{i}}|{{c_{j}})^{{n_{i}}(B)}}}{P(B)} for j=0, 1, 2,…, 5 \)
With all probabilities of \( B \) belonging to each of the six classes calculated, the classifier will categorize \( B \) into the class \( {c_{j}} \) that has the highest probability,
\( c=\underset{ }{arg max}{ P({c_{j}} |B)} \)
3.4.2. Support Vector Machine
Support Vector Machine(SVM) is a classification method based on a max-margin model. It aims to find an optimal hyperplane \( w \) that can maximally separate data points from different classes, which means that the distance between this optimal hyperplane and data points from each class should be the largest one among all planes. This can be transformed to the following optimization problem for data points \( {(x_{i}} , {y_{i}}) \) , where \( i=1, 2, 3, …, m \) [26],
\( \underset{w,E,b}{min}{ \frac{1}{2}{w^{T}}∙w+C∙\sum _{i=1}^{m}{E_{i}}} , \)
\( {where y_{i}}({w^{T}}∅({x_{i}})+b)≥1-{E_{i}} \) \( {, and E_{i}} \gt 0 \)
In the above formula, \( C \) is the penalty parameter of error term \( {E_{i}} \) , and \( {E_{i}} \) is the error of \( {x_{i}} \) and \( { y_{i}} \) . The function \( ∅ \) can map \( {x_{i}} \) to a higher dimensional space.
3.4.3. Decision Tree
Decision tree has a hierarchical structure. A simple illustration of the tree structure is shown in Figure 2. Each node corresponds to a feature of the instance being classified, and each branch represents a possible value that the feature can take. The classification process begins at the root node of the tree, and instances are categorized into certain classes based on their feature values as they traverse down the branches [27].
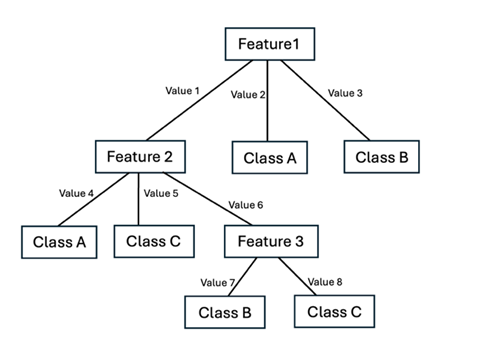
Figure 2. Structure of a Decision Tree
3.4.4. Convolutional Neural Network
Convolutional Neural Network(CNN) is a type of deep neural network, which is built by a sequence of layers. It takes some neurons as inputs, does the computation across the hidden layers, and produces the output. The most frequently used layers are input layer, convolution layer, pooling layer, fully connected layer, and output layer. Data is processed and transmitted to the input layer first. The convolution layer contains a collection of kernels that can generate the output feature map, and a bias is added. The pooling layer can contract large-size feature maps to smaller feature maps, while maintaining the majority of the dominant features. In a fully connected layer, each neuron is connected to every neuron in the previous layer, which indicates that every input to a fully connected layer is a weighted sum of all outputs from the preceding layer with a bias term. The activation function transforms the weighted sum of inputs into the output of each neuron [28, 29].
Suppose that there are two neurons input, \( {x_{1}} \) and \( {x_{2}} \) , after they have passed through some hidden layers, they will be sent to a fully connected layer. The output of fully connected layer \( k \) will be mapped to the output \( y \) through activation function \( f \) as follows:
\( k={w_{1}}*{x_{1}}+{w_{2}}*{x_{2}}+b \)
\( y=f(k) \)
where \( {w_{i}} \) is the weight of neuron \( {x_{i}} \) , and \( b \) is the bias.
3.4.5. Recurrent Neural Network
Long Short-Term Memory(LSTM) and Gated Recurrent Unit(GRU) are two types of Recurrent Neural Network architecture that are introduced to resolve the limitations of typical RNN. LSTM can capture long-range dependencies in sequences, so it is useful for solving tasks that involve understanding context over long sequences. It has three gates, an input gate, a forget gate, and an output gate, which control the flow of information [30].
GRU, in addition to getting long-range dependencies in sequences, it can also be used to address the limitations of RNN in vanishing gradient problems. It has two gates, an update gate, and a rest gate [30].
3.5. Ensemble Learning
Ensemble learning is a machine learning technique that trains multiple base models and combines them to construct an ensemble model. With this method, better model performance and generalization ability can be achieved [31]. This concept is based on the understanding that the individual model has limitations and may make mistakes. Therefore, ensemble learning tries to enhance performance by leveraging the strengths of multiple base models [32].
Ensemble methods can be classified into bagging, boosting, and stacking, where they all aim to improve the model performance by reducing variance and bias [33]. Bagging and boosting methods usually combine homogeneous models, and the stacking method combines heterogeneous models.
3.5.1. Bagging
For bagging, the learning algorithm is applied to each bootstrap sample from the training dataset, and results are combined through simple voting for classification tasks [34]. Random forest is a bagging of Decision Tree. Each tree is trained on a random subset of the training dataset, which is selected by bootstrap sampling. The output of the Decision Tree is voted to be the output of the Random Forest.
3.5.2. Boosting
Boosting is an iterative procedure [34]. It trains each model sequentially, where each subsequent model attempts to correct errors made by the previous model. The final output takes into consideration of weights when combining the results from each sample. Gradient Boosting is an ensemble of Decision Tree using the boosting method, which it optimizes the model by minimizing a loss function [35].
3.5.3. Stacking
The stacking method combines heterogeneous base models utilizing a meta-model. Each base model is trained on the entire training dataset and the meta-model is trained on the stacked dataset from the predictions of all base models [33].
In this experiment, new models are trained using the stacking method. The base models are CNN, GRU, and LSTM, which are deep learning models since they have generally better model performance than traditional machine learning models for this emotion classification task. The predictions from deep learning base models on the training dataset are aggregated to be the stacked dataset. The meta-model, which is one of Multinomial Naive Bayes, SVM, and Decision Tree, is trained on the stacked dataset. The classification performance of each ensemble model will be evaluated in the following section.
4. Experiment and Results
4.1. Experiment Setup
4.1.1. Data Pre-processing
In this experiment, the public data set from the Kaggle website is used. There are a total of 20000 observations with two variables, texts and emotion labels. There are six classes of emotion, which are sadness, joy, fear, surprise, love, and anger.
Following the workflow demonstrated in Figure 1, data pre-processing should be performed first. The entire dataset is cleaned by removing empty entries and fully duplicate entries. Then, for the text variable, irrelevant characters and numbers are removed, letters are standardized into uniform lower-case, and abbreviations are handled (i.e. changing “can't” into “cannot”). NLP techniques are used to further pre-process the cleaned dataset, including stop word removal, word lemmatization, and tokenization. Then, the pre-processed data is split into training dataset, validation dataset, and testing dataset with a ratio of 8:1:1, and the ratio of samples in each category will be kept the same as the ratio in the original dataset. TF-IDF vectorization technique is applied to the training dataset, validation dataset, and testing dataset. It is noticed that the training dataset is seriously imbalanced, so the SOMTETomek resampling technique is applied to it. The percentages of each emotion category in the training dataset before the resampling and after the resampling are shown in Figure 3, respectively.
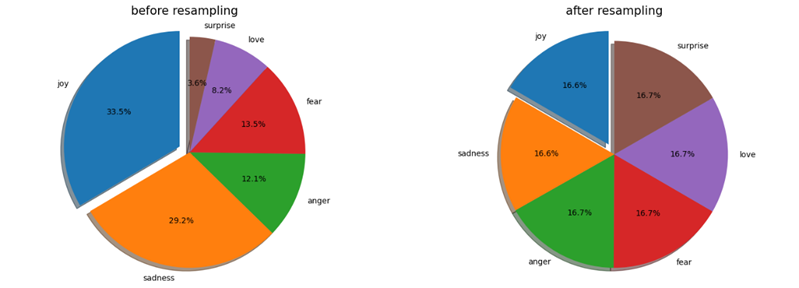
Figure 3. Percentage of each category in training dataset before and after resampling.
4.1.2. Model Training
Machine learning models and deep learning models are trained as base models, including Multinomial Naive Bayes, SVM, Decision Tree, CNN, GRU, and LSTM. Random Forest and Gradient Boosting models are also trained to prepare for the later comparison. For deep learning models, dropout layers and early stopping are used to avoid overfitting. Batch Normalization layers are used to improve the training speed and stability of the network.
During the training process, the best parameters are found through 5-cross validation and grid search. The cross-validation score with scoring parameters roc_auc and accuracy are utilized for comparison and selection of best parameters.
The ensemble model using the stacking method is then constructed by utilizing the stacked dataset of predictions from deep learning models to fit the meta-model, which is one of Multinomial Naive Bayes, SVM, and Decision Tree.
4.2. Results and Evaluation
The comparisons between models are made by evaluation metrics, including accuracy, precision, recall, and F1 score. Since this is a multi-class classification task and the resampling technique is applied to the imbalanced dataset, the macro-average is used to get the averaged evaluation metrics, which means that each class contributes equally to the metrics. Macro accuracy and macro F1 score will be emphasized for model comparison and selection in this experiment. Accuracy is a measure of the percentage of correctly classified data. F1 score is a reasonable metric when precision and recall should be both optimized. It is the harmonic mean of precision and recall, indicating that the classifier has a well-balanced performance for each class, which is defined as follows:
\( F1 score=2× \frac{precision ∙ recall}{precision+recall} \)
With the experiment procedures stated above, base models are trained at the first stage. The values of evaluation metrics are shown in Table 2, numerical values are in four decimal places.
Table 2. Evaluation metrics of base models.
Model | Accuracy | Precision | Recall | F1 score |
Multinomial Naive Bayes | 0.8400 | 0.7775 | 0.8303 | 0.7973 |
SVM | 0.8615 | 0.8513 | 0.7661 | 0.8004 |
Decision Tree | 0.8585 | 0.7959 | 0.8316 | 0.8117 |
CNN | 0.8715 | 0.8368 | 0.8189 | 0.8275 |
LSTM | 0.8705 | 0.8285 | 0.8235 | 0.8255 |
GRU | 0.8790 | 0.8280 | 0.8376 | 0.8324 |
Among all base models, the GRU model achieved the highest macro accuracy and macro F1 score, which are 0.8790 and 0.8324, respectively. The evaluation metrics indicate that deep learning base models have better classification performance than traditional machine learning base models due to higher macro accuracy and F1 score. The accuracy of CNN and LSTM are both around 0.8700, and the F1 scores, which are close to 0.83, suggest that the classifiers have balanced performance in this multi-class classification task. Among the traditional machine learning base models, SVM achieved the highest macro accuracy, which indicates that 86.15% of text input can be classified into the correct emotion class. For Multinomial Naive Bayes and Decision Tree, they achieved relatively lower macro accuracy, which are 84.00% and 85.85%, respectively. The three classifiers have approximate macro F1 score around 0.80, demonstrating that the classifiers are well-performed for each emotion class.
As the evaluation metrics shown in Table 2, deep learning base models are better at this emotion classification task. As a result, new models will use the stacking of deep learning models’ predictions to train a meta-model, which is one of the traditional machine learning models, attempting to improve classification performance.
The evaluation metrics of the new ensemble models are shown in Table 3, and the Random Forest model that uses the bagging method, and the Gradient Boosting model that uses the boosting method are also shown in Table 3 for comparison.
Table 3. Evaluation metrics of ensemble learning models.
Model | Accuracy | Precision | Recall | F1 score |
Deep learning + Multinomial Naive Bayes | 0.8870 | 0.8467 | 0.8398 | 0.8426 |
Deep learning + SVM | 0.8875 | 0.8507 | 0.8339 | 0.8410 |
Deep learning + Decision Tree | 0.8775 | 0.8393 | 0.8192 | 0.8279 |
Random Forest | 0.8675 | 0.8096 | 0.8350 | 0.8210 |
Gradient Boosting | 0.8520 | 0.8006 | 0.8645 | 0.8206 |
The new ensemble models using the stacking method show better classification performance than each base model except for Deep learning + Decision Tree, which has relatively lower macro accuracy and F1 score. When compared with the other two models which apply bagging and boosting on Decision Tree, the stacking models can produce classification results that are more accurate and balanced.
Among the new models using the stacking method, the classifier that utilizes SVM as a meta-model can correctly classify 88.75% of text data input on average with a macro F1 score of 0.8410, demonstrating that the good model performance is well-balanced for each emotion class. Though the deep learning + Multinomial Naive Bayes achieved relatively lower macro accuracy, 0.8870, it has the highest macro F1 score, which is 0.8426. For this experiment, the classifier with higher accuracy while the F1 score is reasonable should be considered as the model with the best performance, so Deep learning + SVM is the best-performed ensemble model.
5. Discussion
5.1. Results Analysis
The results demonstrate that the ensemble models using the stacking method generally can achieve better classification performance than each single machine learning model. The new models can produce more accurate classification output. For each emotion class, the classification performance is balanced. The evaluation metrics suggest that the ensemble model, Deep learning + SVM, is the best-performed model for solving this classification task of emotion detected from social media text.
The better classification performance may be due to several reasons. Firstly, the new ensemble models use the stacked dataset to train the meta-model, where the stacked dataset is obtained by aggregating results from deep learning base models. It allows the meta-model to explore solution space with different models, and it also helps the meta-model to learn from the strengths of base models, which are deep learning models that have better performance in this task. CNN can capture local patterns and hierarchical features of text data, and GRU and LSTM are efficient at capturing and learning long-range dependencies and context in sequential text data. Also, stacking can reduce overfitting by averaging out the biases and variance of individual models, leading to a more generalized performance on the testing dataset, whereas the individual model is prone to overfitting. Secondly, the meta-model learns the best way to combine the predictions from base models, rather than simply using defined methods, such as averaging or voting, which can contribute to the improved performance.
5.2. Limitation
The dataset is seriously imbalanced. Though the re-sampling technique is applied, overfitting issues are unavoidable. So, a more balanced dataset with an approximately equal number of samples in each class may obtain a better-performed model. Meanwhile, another limitation might be the frequent usage of cyber words and cyber abbreviations in social media texts. They are difficult for models to learn from features since they have different interpretations from daily use language, and new cyber-words are created rapidly, so it is challenging to have a cyber-language specific corpus that includes all cyber-words and can be updated timely. In addition, applying the model to different languages is one of the challenges that is difficult to overcome, especially for some languages used by only a limited number of people. Languages have different structures and systems, and obtaining a corpus for languages that are not widely used is hard.
6. Conclusion and Future Work
In this paper, the initial attempt is achieved by proposing an ensemble model using the stacking method, Deep learning + SVM. It can achieve 0.8875 for accuracy and 0.8140 for F1 score, which has better classification performance than the single machine learning model or deep learning model. Though the new model only increases the accuracy by 0.2 and F1 score around 0.4, it can contribute to the emotion classification task a lot. As a result, the experiment proves that the stacking ensemble method provides a way to combine deep learning models and traditional machine learning models, and it is useful for text-related classification tasks.
For future work, according to the finding that the combination of neural networks and traditional machine learning models can be more effective, more hybrid models can be developed and designed to further improve model performance and generalization ability. In addition, since there is limited labeled data and the difficulty of annotation, hybrid models with semi-supervised learning methods should be considered as a potential way to achieve better results more efficiently. Meanwhile, a model will be more useful and widely applied if it can maintain the same or even achieve a higher accuracy when performing an emotion classification task on other languages in the same language family.
References
[1]. Moolthaisong, Kamoltep, and Wararat Songpan. “Emotion Analysis and classification of movie reviews using Data Mining.” 2020 International Conference on Data Science, Artificial Intelligence, and Business Analytics (DATABIA), July 2020, https://doi.org/10.1109/databia50434.2020.9190363.
[2]. Ahmad, Shimi Naurin, and Michel Laroche. “How do expressed emotions affect the helpfulness of a product review? evidence from reviews using latent semantic analysis.” International Journal of Electronic Commerce, vol. 20, no. 1, 31 Aug. 2015, pp. 76–111, https://doi.org/10.1080/10864415.2016.1061471.
[3]. Gates, Kelly. “Designing effective consumers: Emotion Analysis in Market Research.” The Routledge Companion to Global Popular Culture, 5 Dec. 2014, pp. 99–114, https://doi.org/10.4324/9780203081846-16.
[4]. Zamani, H., A. Abas, and M. K. M.Amin. “Eye Tracking Application on Emotion Analysis for Marketing Strategy”. Journal of Telecommunication, Electronic and Computer Engineering (JTEC), vol. 8, no. 11, Dec. 2016, pp. 87-91, https://jtec.utem.edu.my/jtec/article/view/1415.
[5]. Cherry, Colin, et al. “Binary classifiers and latent sequence models for emotion detection in suicide notes.” Biomedical Informatics Insights, vol. 5s1, Jan. 2012, https://doi.org/10.4137/bii.s8933.
[6]. Ekman, Paul. “An argument for basic emotions.” Cognition and Emotion, vol. 6, no. 3–4, May 1992, pp. 169–200, https://doi.org/10.1080/02699939208411068.
[7]. Tomkins, Silvan S., and Robert McCarter. “What and where are the primary affects? some evidence for a theory.” Perceptual and Motor Skills, vol. 18, no. 1, Feb. 1964, pp. 119–158, https://doi.org/10.2466/pms.1964.18.1.119.
[8]. Russell, James A. “A circumplex model of affect.” Journal of Personality and Social Psychology, vol. 39, no. 6, Dec. 1980, pp. 1161–1178, https://doi.org/10.1037/h0077714.
[9]. Rahman, Romana, et al. Detecting Emotion from Text and Emoticon, 2017, www.researchgate.net/publication/328174790_Detecting_Emotion_from_Text_and_Emoticon.
[10]. Seal, Dibyendu, et al. “Sentence-level emotion detection from text based on Semantic Rules.” Information and Communication Technology for Sustainable Development, 26 June 2019, pp. 423–430, https://doi.org/10.1007/978-981-13-7166-0_42.
[11]. Mohammad, Saif M., and Svetlana Kiritchenko. “Using hashtags to capture fine emotion categories from tweets.” Computational Intelligence, vol. 31, no. 2, 10 Jan. 2014, pp. 301–326, https://doi.org/10.1111/coin.12024.
[12]. Hasan, Maryam, et al. EMOTEX: Detecting Emotions in Twitter Messages, 27 May 2014, www.sciencedirect.com/science/article/pii/S1877750318311037.
[13]. Go, Alec, et al. Twitter Sentiment Classification Using Distant Supervision, 4 Sept. 2014, www.academia.edu/8202882/Twitter_Sentiment_Classification_using_Distant_Supervision.
[14]. Agrawal, Ameeta, and Aijun An. “Unsupervised emotion detection from text using semantic and syntactic relations.” 2012 IEEE/WIC/ACM International Conferences on Web Intelligence and Intelligent Agent Technology, Dec. 2012, https://doi.org/10.1109/wi-iat.2012.170.
[15]. Yasmina, Douiji, et al. “Using YouTube comments for text-based emotion recognition.” Procedia Computer Science, vol. 83, 2016, pp. 292–299, https://doi.org/10.1016/j.procs.2016.04.128.
[16]. Li, Shoushan, et al. Employing Personal/Impersonal Views in Supervised and Semi-Supervised Sentiment Classification, 2010, www.researchgate.net/publication/220875008_Employing_Person alImpersonal_Views_in_Supervised_and_Semi-Supervised_Sentiment_Classification.
[17]. Zhou, Shusen, et al. “Active deep learning method for semi-supervised sentiment classification.” Neurocomputing, vol. 120, Nov. 2013, pp. 536–546, https://doi.org/10.1016/j.neucom.2013.04.017.
[18]. Xu, Dongliang, et al. “Deep Learning Based Emotion Analysis of Microblog texts.” Information fusion, vol. 64, Dec. 2020, pp. 1–11, https://doi.org/10.1016/j.inffus.2020.06.002.
[19]. Zahiri, Sayyed M., and Jinho D. Choi. “Emotion Detection on TV Show Transcripts with Sequence-Based Convolutional Neural Networks.” arXiv.Org, 14 Aug. 2017, arxiv.org/abs/1708.04299.
[20]. Prakash Tiwari, Sudhanshu, et al. “A novel approach for detecting emotion in text.” Indian Journal of Science and Technology, vol. 9, no. 29, 22 Aug. 2016, https://doi.org/10.17485/ijst/2016/v9i29/88211.
[21]. Grover, Sheeba, and Amandeep Verma. “Design for emotion detection of Punjabi text using hybrid approach.” 2016 International Conference on Inventive Computation Technologies (ICICT), Aug. 2016, https://doi.org/10.1109/inventive.2016.7824823.
[22]. DeepLearning.AI. “Natural Language Processing (NLP) [a Complete Guide].” DeepLearning.AI, 11 Jan. 2023, www.deeplearning.ai/resources/natural-language-processing.
[23]. Singh, Anita Kumari, and Mogalla Shashi. “Vectorization of Text Documents for Identifying Unifiable News Articles.” International Journal of Advanced Computer Science and Applications/International Journal of Advanced Computer Science & Applications, vol. 10, no. 7, Jan. 2019, https://doi.org/10.14569/ijacsa.2019.0100742.
[24]. Batista, Gustavo E., et al. “A study of the behavior of several methods for balancing machine learning training data.” ACM SIGKDD Explorations Newsletter, vol. 6, no. 1, June 2004, pp. 20–29, https://doi.org/10.1145/1007730.1007735.
[25]. Jiang, Liangxiao, et al. “Structure Extended Multinomial Naive Bayes.” Information sciences, vol. 329, Feb. 2016, pp. 346–56. https://doi.org/10.1016/j.ins.2015.09.037.
[26]. Chang, Chih-Chung, et al. A Practical Guide to Support Vector Classification, May 2016, www.csie.ntu.edu.tw/~cjlin/papers/guide/guide.pdf.
[27]. Kotsiantis, Sotiris. “Supervised Machine Learning: A Review of Classification Techniques.” Informatica, vol. 31, July 2007, pp. 249–68.
[28]. Alzubaidi, L. et al. (2021) ‘Review of Deep Learning: Concepts, CNN Architectures, challenges, applications, Future Directions’, Journal of Big Data, 8(1). doi:10.1186/s40537-021-00444-8.
[29]. Sabri, Mohammed, and Mohammed El Hassouni. “A Novel Deep Learning Approach for Short Term Photovoltaic Power Forecasting Based on GRU-CNN Model.” E3S Web of Conferences, vol. 336, Jan. 2022, p. 00064. https://doi.org/10.1051/e3sconf/202233600064.
[30]. Dey, Rahul, and Fathi M. Salem. “Gate-variants of gated recurrent unit (GRU) neural networks.” 2017 IEEE 60th International Midwest Symposium on Circuits and Systems (MWSCAS), Aug. 2017, https://doi.org/10.1109/mwscas.2017.8053243
[31]. Zhou, Zhi-Hua. “Ensemble Methods.” Chapman and Hall/CRC eBooks, 2012, https://doi.org/10.1201/b12207.
[32]. Mienye, Ibomoiye Domor, and Yanxia Sun. “A Survey of Ensemble Learning: Concepts, Algorithms, Applications, and Prospects.” IEEE Access, vol. 10, Jan. 2022, pp. 99129–49. https://doi.org/10.1109/access.2022.3207287.
[33]. Nguyen, Kieu Anh, et al. “Comparison of Ensemble Machine Learning Methods for Soil Erosion Pin Measurements.” ISPRS International Journal of Geo-information, vol. 10, no. 1, Jan. 2021, p. 42. https://doi.org/10.3390/ijgi10010042.
[34]. Sutton, Clifton D. “Classification and Regression Trees, Bagging, and Boosting.” Handbook of statistics, 2005, pp. 303–29. https://doi.org/10.1016/s0169-7161(04)24011-1.
[35]. Friedman, Jerome H. “Greedy function approximation: A gradient boosting machine.” The Annals of Statistics, vol. 29, no. 5, 1 Oct. 2001, https://doi.org/10.1214/aos/1013203451.
Cite this article
Jiang,X. (2024). A novel ensemble model for emotion classification in social media text. Applied and Computational Engineering,86,30-41.
Data availability
The datasets used and/or analyzed during the current study will be available from the authors upon reasonable request.
Disclaimer/Publisher's Note
The statements, opinions and data contained in all publications are solely those of the individual author(s) and contributor(s) and not of EWA Publishing and/or the editor(s). EWA Publishing and/or the editor(s) disclaim responsibility for any injury to people or property resulting from any ideas, methods, instructions or products referred to in the content.
About volume
Volume title: Proceedings of the 6th International Conference on Computing and Data Science
© 2024 by the author(s). Licensee EWA Publishing, Oxford, UK. This article is an open access article distributed under the terms and
conditions of the Creative Commons Attribution (CC BY) license. Authors who
publish this series agree to the following terms:
1. Authors retain copyright and grant the series right of first publication with the work simultaneously licensed under a Creative Commons
Attribution License that allows others to share the work with an acknowledgment of the work's authorship and initial publication in this
series.
2. Authors are able to enter into separate, additional contractual arrangements for the non-exclusive distribution of the series's published
version of the work (e.g., post it to an institutional repository or publish it in a book), with an acknowledgment of its initial
publication in this series.
3. Authors are permitted and encouraged to post their work online (e.g., in institutional repositories or on their website) prior to and
during the submission process, as it can lead to productive exchanges, as well as earlier and greater citation of published work (See
Open access policy for details).
References
[1]. Moolthaisong, Kamoltep, and Wararat Songpan. “Emotion Analysis and classification of movie reviews using Data Mining.” 2020 International Conference on Data Science, Artificial Intelligence, and Business Analytics (DATABIA), July 2020, https://doi.org/10.1109/databia50434.2020.9190363.
[2]. Ahmad, Shimi Naurin, and Michel Laroche. “How do expressed emotions affect the helpfulness of a product review? evidence from reviews using latent semantic analysis.” International Journal of Electronic Commerce, vol. 20, no. 1, 31 Aug. 2015, pp. 76–111, https://doi.org/10.1080/10864415.2016.1061471.
[3]. Gates, Kelly. “Designing effective consumers: Emotion Analysis in Market Research.” The Routledge Companion to Global Popular Culture, 5 Dec. 2014, pp. 99–114, https://doi.org/10.4324/9780203081846-16.
[4]. Zamani, H., A. Abas, and M. K. M.Amin. “Eye Tracking Application on Emotion Analysis for Marketing Strategy”. Journal of Telecommunication, Electronic and Computer Engineering (JTEC), vol. 8, no. 11, Dec. 2016, pp. 87-91, https://jtec.utem.edu.my/jtec/article/view/1415.
[5]. Cherry, Colin, et al. “Binary classifiers and latent sequence models for emotion detection in suicide notes.” Biomedical Informatics Insights, vol. 5s1, Jan. 2012, https://doi.org/10.4137/bii.s8933.
[6]. Ekman, Paul. “An argument for basic emotions.” Cognition and Emotion, vol. 6, no. 3–4, May 1992, pp. 169–200, https://doi.org/10.1080/02699939208411068.
[7]. Tomkins, Silvan S., and Robert McCarter. “What and where are the primary affects? some evidence for a theory.” Perceptual and Motor Skills, vol. 18, no. 1, Feb. 1964, pp. 119–158, https://doi.org/10.2466/pms.1964.18.1.119.
[8]. Russell, James A. “A circumplex model of affect.” Journal of Personality and Social Psychology, vol. 39, no. 6, Dec. 1980, pp. 1161–1178, https://doi.org/10.1037/h0077714.
[9]. Rahman, Romana, et al. Detecting Emotion from Text and Emoticon, 2017, www.researchgate.net/publication/328174790_Detecting_Emotion_from_Text_and_Emoticon.
[10]. Seal, Dibyendu, et al. “Sentence-level emotion detection from text based on Semantic Rules.” Information and Communication Technology for Sustainable Development, 26 June 2019, pp. 423–430, https://doi.org/10.1007/978-981-13-7166-0_42.
[11]. Mohammad, Saif M., and Svetlana Kiritchenko. “Using hashtags to capture fine emotion categories from tweets.” Computational Intelligence, vol. 31, no. 2, 10 Jan. 2014, pp. 301–326, https://doi.org/10.1111/coin.12024.
[12]. Hasan, Maryam, et al. EMOTEX: Detecting Emotions in Twitter Messages, 27 May 2014, www.sciencedirect.com/science/article/pii/S1877750318311037.
[13]. Go, Alec, et al. Twitter Sentiment Classification Using Distant Supervision, 4 Sept. 2014, www.academia.edu/8202882/Twitter_Sentiment_Classification_using_Distant_Supervision.
[14]. Agrawal, Ameeta, and Aijun An. “Unsupervised emotion detection from text using semantic and syntactic relations.” 2012 IEEE/WIC/ACM International Conferences on Web Intelligence and Intelligent Agent Technology, Dec. 2012, https://doi.org/10.1109/wi-iat.2012.170.
[15]. Yasmina, Douiji, et al. “Using YouTube comments for text-based emotion recognition.” Procedia Computer Science, vol. 83, 2016, pp. 292–299, https://doi.org/10.1016/j.procs.2016.04.128.
[16]. Li, Shoushan, et al. Employing Personal/Impersonal Views in Supervised and Semi-Supervised Sentiment Classification, 2010, www.researchgate.net/publication/220875008_Employing_Person alImpersonal_Views_in_Supervised_and_Semi-Supervised_Sentiment_Classification.
[17]. Zhou, Shusen, et al. “Active deep learning method for semi-supervised sentiment classification.” Neurocomputing, vol. 120, Nov. 2013, pp. 536–546, https://doi.org/10.1016/j.neucom.2013.04.017.
[18]. Xu, Dongliang, et al. “Deep Learning Based Emotion Analysis of Microblog texts.” Information fusion, vol. 64, Dec. 2020, pp. 1–11, https://doi.org/10.1016/j.inffus.2020.06.002.
[19]. Zahiri, Sayyed M., and Jinho D. Choi. “Emotion Detection on TV Show Transcripts with Sequence-Based Convolutional Neural Networks.” arXiv.Org, 14 Aug. 2017, arxiv.org/abs/1708.04299.
[20]. Prakash Tiwari, Sudhanshu, et al. “A novel approach for detecting emotion in text.” Indian Journal of Science and Technology, vol. 9, no. 29, 22 Aug. 2016, https://doi.org/10.17485/ijst/2016/v9i29/88211.
[21]. Grover, Sheeba, and Amandeep Verma. “Design for emotion detection of Punjabi text using hybrid approach.” 2016 International Conference on Inventive Computation Technologies (ICICT), Aug. 2016, https://doi.org/10.1109/inventive.2016.7824823.
[22]. DeepLearning.AI. “Natural Language Processing (NLP) [a Complete Guide].” DeepLearning.AI, 11 Jan. 2023, www.deeplearning.ai/resources/natural-language-processing.
[23]. Singh, Anita Kumari, and Mogalla Shashi. “Vectorization of Text Documents for Identifying Unifiable News Articles.” International Journal of Advanced Computer Science and Applications/International Journal of Advanced Computer Science & Applications, vol. 10, no. 7, Jan. 2019, https://doi.org/10.14569/ijacsa.2019.0100742.
[24]. Batista, Gustavo E., et al. “A study of the behavior of several methods for balancing machine learning training data.” ACM SIGKDD Explorations Newsletter, vol. 6, no. 1, June 2004, pp. 20–29, https://doi.org/10.1145/1007730.1007735.
[25]. Jiang, Liangxiao, et al. “Structure Extended Multinomial Naive Bayes.” Information sciences, vol. 329, Feb. 2016, pp. 346–56. https://doi.org/10.1016/j.ins.2015.09.037.
[26]. Chang, Chih-Chung, et al. A Practical Guide to Support Vector Classification, May 2016, www.csie.ntu.edu.tw/~cjlin/papers/guide/guide.pdf.
[27]. Kotsiantis, Sotiris. “Supervised Machine Learning: A Review of Classification Techniques.” Informatica, vol. 31, July 2007, pp. 249–68.
[28]. Alzubaidi, L. et al. (2021) ‘Review of Deep Learning: Concepts, CNN Architectures, challenges, applications, Future Directions’, Journal of Big Data, 8(1). doi:10.1186/s40537-021-00444-8.
[29]. Sabri, Mohammed, and Mohammed El Hassouni. “A Novel Deep Learning Approach for Short Term Photovoltaic Power Forecasting Based on GRU-CNN Model.” E3S Web of Conferences, vol. 336, Jan. 2022, p. 00064. https://doi.org/10.1051/e3sconf/202233600064.
[30]. Dey, Rahul, and Fathi M. Salem. “Gate-variants of gated recurrent unit (GRU) neural networks.” 2017 IEEE 60th International Midwest Symposium on Circuits and Systems (MWSCAS), Aug. 2017, https://doi.org/10.1109/mwscas.2017.8053243
[31]. Zhou, Zhi-Hua. “Ensemble Methods.” Chapman and Hall/CRC eBooks, 2012, https://doi.org/10.1201/b12207.
[32]. Mienye, Ibomoiye Domor, and Yanxia Sun. “A Survey of Ensemble Learning: Concepts, Algorithms, Applications, and Prospects.” IEEE Access, vol. 10, Jan. 2022, pp. 99129–49. https://doi.org/10.1109/access.2022.3207287.
[33]. Nguyen, Kieu Anh, et al. “Comparison of Ensemble Machine Learning Methods for Soil Erosion Pin Measurements.” ISPRS International Journal of Geo-information, vol. 10, no. 1, Jan. 2021, p. 42. https://doi.org/10.3390/ijgi10010042.
[34]. Sutton, Clifton D. “Classification and Regression Trees, Bagging, and Boosting.” Handbook of statistics, 2005, pp. 303–29. https://doi.org/10.1016/s0169-7161(04)24011-1.
[35]. Friedman, Jerome H. “Greedy function approximation: A gradient boosting machine.” The Annals of Statistics, vol. 29, no. 5, 1 Oct. 2001, https://doi.org/10.1214/aos/1013203451.