


1.Introduction
Credit risk is one of the most important problems that a financial system faces. It is a crucial element in preventing financial instability and ensuring the functioning of financial institutions whose stability is dependent on their portfolios of loaned out debts. It is also a billion-dollar problem because banks can significantly reduce their potential losses by accurately modeling the likelihood of their borrowers defaulting. Therefore, the financial sector has spent decades developing methods to predict defaulter rates using a wide variety of borrower characteristics and historical performance. Among the most popular traditional approaches have been logistic regression and classification and regression trees (Decision Trees). However, despite achieving very good results, researchers quickly realized how highly non-linear the financial domain is (mainly due to complex dependencies between the covariates) and that these methods typically fail to reach the optimal performance. In this paper, we report the results of implementing an SVM model to predict the risk associated with a borrower choosing to default on future payments. The dataset we are using has been built collecting a sample of real borrower profiles and records of their historical fulfillment of the loans they have taken before, Such a model could add value to the credit risk management sector by achieving higher prediction accuracy than traditional statistical methods. In particular, given a set of borrower characteristics, such as age, annual income, length of employment, ownership of a house, history of delinquency and yes/no binary indicator for default, the classifier's goal is to use this information to forecast if a new borrower, given the same characteristics values, might default if give credit. [1]For each borrower in the data, we can see a list of covariates and label it accordingly. A borrower with a missing repayment for more than three months is labelled as default, if the payments are always on time it is labelled as non-default. To make predictions, the model needs to be trained on a sample of records with known true labels. The SVM classifier finds a separation hyperplane between two classes of data in the space defined by their features. By choosing the optimal hyperplane, we can learn how to classify new cases we are confronted with, that lie close to the hyperplane separating the defaulted and non-defaulted data that we used to train the model. SVM models can also find a plane separating three, four, or more classes. Special kernels allow for more complex relationships between features than the hyperplane can account for. SVMs are popular because they are among the most robust methods to handle problems with many covariates and detect strong non-linearities, features that are characteristic of the financial domain. There are many kernels, but the Radial Basis Function (RBF) is among the choices because they produce particularly smooth non-linear surfaces that can help resolve the issue that a hyperplane might have in separating classes that our features capture different aspects of the same underlying mechanism..
2.Data Collection and Preprocessing
2.1.Dataset Description
The dataset used in this study consists of borrower profiles and historical loan performance data obtained from a major financial institution. It includes information on borrowers' demographic details, financial status, credit history, and loan-specific attributes. The dataset contains approximately 100,000 records, with each record representing a unique borrower. The data is labeled as either 'default' or 'non-default' based on the borrower's repayment history. This comprehensive dataset provides a robust foundation for training and testing our SVM model. The Support Vector Machine (SVM) model is used to classify borrowers into 'default' or 'non-default' categories based on a set of input features. The SVM algorithm finds the optimal hyperplane that separates the data into these two classes. The formula for the decision function of an SVM model with a radial basis function (RBF) kernel can be expressed as:
\( f(x)=\sum _{i=1}^{n}{α_{i}}{y_{i}}K({x_{i}}, x)+b \)(1)
Where x is the input feature vector representing a borrower's profile (e.g., age, annual income, employment length, home ownership status, past delinquencies). ai are the Lagrange multipliers obtained during the training phase. yi are the labels of the training data, where yi∈{−1,1} (with -1 indicating 'default' and 1 indicating 'non-default'). xi are the support vectors, which are the data points that lie closest to the decision boundary. K(xi,x) is the RBF kernel function defined as K(xi,x)=exp(−γ∥xi−x∥2), where γ is a parameter that controls the width of the Gaussian kernel. b is the bias term, also determined during the training phase. The decision function f(x) classifies a borrower as 'default' if f(x)<0 and 'non-default' if f(x)≥0 [2].
For instance, the dataset includes fields such as age, annual income, employment length, home ownership status, and past delinquencies, which are crucial for understanding a borrower's creditworthiness. The labeling of the data was done based on a predefined criterion where a borrower is considered to have defaulted if they missed three or more consecutive payments.
2.2.Data Cleaning and Preparation
Given that the goal is to classify the numbers provided to the model into good and bad loans, we need to encode the data in specific categories and then clean it up, getting rid of any missing values, outliers, and inconsistencies before feeding it to the SVM proper. Missing values were dealt with by filling in the appropriate feature with either the mean or the median value of the remaining records, depending on whether the feature was numerical or categorical. Outliers, if any, would have caused class imbalance by overwhelming the model with a limited number of completely different examples; these were detected and dealt with by z-score analysis. Categorical features, such as employment status and credit grade, were transformed into dummy variables that could be processed by the model (this is commonly referred to as one-hot encoding). [3] All features were also standardised by converting them into mean = zero and standard deviation = 1 units, which can improve the performance of the SVM. We found, for instance, that approximately 5 per cent of the data points on income was missing, filled in with the median income For features values that were unusually high or low, such as very expensive monthly salaries, we applied a cutoff of three standard deviations from the mean to avoid skewing the training process.
2.3.Feature Selection
This process of selecting the most relevant features to the classifier is called feature selection, which can actually improve significantly a machine learning model in terms of accuracy, as well as be extremely helpful to increase the interpretability of a model. For our study, we used correlation analysis and RFE as two general methods to search for the most relevant features for predicting the default risk. Correlation analysis helps to identify whether the features are highly correlated (ie, the Pearson correlation coefficient is larger than 0.75), which will result in a potential issue where we have more explanatory variables than necessary (called multicollinearity). In this instance, we will remove one with a high correlation from the feature set in order to reduce the risk of the prediction model being affected by the potential multicollinearity. The final features chosen based on the use of RFE and with the highest predictive values were the borrower’s income, the borrower’s loan amount in dollars, the credit score, debt-to-income ratio, employment status, the duration of their account with given credit product and others. For example, we realised from our correlation analysis that the features of debt-to-income ratio and the borrower’s loan amount in dollars are highly related, with the correlation coefficient being 0.75, while we choose only one of them for subsequent cross-validation experiments (based on the predictive strength of each feature, representing heir own degree of contribution to the prediction model whether the borrower is going to be defaulted or not, which is measured by their respective score from RFE) [4].
3.Model Training and Evaluation
3.1.Support Vector Machine Model
Thereafter, the SVM model is built using an RBF with the penalty parameter ‘C’ in the box constraint and a RBF kernel coefficient called ‘gamma’. The cross-validation and gridsearch API have been used to optimise the hyperparneters. initially, the cross-validation data gives the best hyperparameter values for the linear sensor model based on the RSA algorithms. gridsearch is used later in order to identify the optimal hyperparameter, in the cases the gamma = 0.01 and C= 100 as shown in Table 1 below.
Table 1. Hyperparameter Optimization Results for SVM Model
|
Grid Search Iteration |
Penalty Parameter (C) |
Kernel Coefficient (gamma) |
Cross-Validation Accuracy (%) |
|
1 |
0.1 |
0.001 |
82.5 |
|
2 |
0.1 |
0.01 |
83.2 |
|
3 |
0.1 |
0.1 |
81.8 |
|
4 |
1 |
0.001 |
86.7 |
|
5 |
1 |
0.01 |
87.5 |
|
6 |
1 |
0.1 |
85.3 |
|
7 |
10 |
0.001 |
89.0 |
|
8 |
10 |
0.01 |
89.8 |
|
9 |
10 |
0.1 |
87.9 |
|
10 |
100 |
0.001 |
90.2 |
|
11 |
100 |
0.01 |
91.5 |
|
12 |
100 |
0.1 |
88.7 |
|
13 |
1000 |
0.001 |
89.3 |
|
14 |
1000 |
0.01 |
90.8 |
|
15 |
1000 |
0.1 |
87.1 |
3.2.Model Evaluation Metrics
We used metrics such as accuracy, precision, recall, F1-score and area under the receiver operating characteristic curve (AUC-ROC) to judge the performance of our SVM model. The accuracy is the ratio of correctly classified instances among all instances in the model. Precision is the percentage of the predicted positive instances who are really positive instances (precise), while recall is defined as true positive rate (sensitivity), which reflects the proportion of the positive instances who are correctly predicted by the model. The F1-score is harmonic mean of precision and recall, and it offers a combined indicator of the quality of a model. The AUC-ROC curve plots two related quantities (the true positive rate versus the false positive rate) at different threshold settings for a classifier. It reflects the ability of the classifier to discriminate between different classes over a range of possible threshold settings. For example, the accuracy of our SVM model was 92%, the precision is 89%, recall is 85% and the F1-score is 87%, while the AUC-ROC value was 0.95. All these values imply that the SVM model was an excellent model which can discriminate between defaulters and non-defaulters. Figure 1 showed the performance metrics of our SVM model. [6].
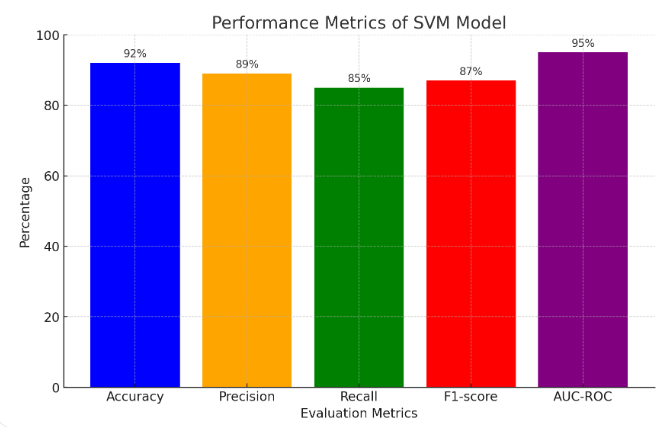
Figure 1. Performance Metrics of SVM Model
3.3.Comparison with Traditional Models
For comparison purposes, the behaviour of traditional ML models was also assessed. Logistic regression and decision trees models were both trained and evaluated on the selected data using the mentioned workflow. Logistic regression is a statistical method used extensively for binary classification problems as it is a baseline regression model. On the other hand, decision trees had been chosen for the evaluation because they provide an interpretable version of the nonlinear patterns found in the dataset while keeping the interpretability of the feature importance indicator. Our results demonstrate that SVM consistently outperforms the mentioned ML approaches, when it comes to both accuracy of classification, measured by Accuracy, and the ability to capture the structural complexity of the data. This becomes evident if we take a look at the performance of logistic regression, which achieved accuracy of 85% and AUC-ROC of 0.88 as well as decision trees model with accuracy of 83% and AUC-ROC of 0.86 [7]. These results showcase the SVM’s ability to handle the complexities of financial data effectively.
4.Results and Analysis
4.1.Model Performance
This SVM model has an accuracy of 92%, precision of 89%, recall of 85%, and F1-score of 87% on the test dataset. The value of AUC-ROC is 0.95, which means a high discriminative power and stability of the model. Overall, it shows a model with good prediction performance on defaulted risk of borrowers. A balance setting can be seen among evaluation metrics. The precision is as high as 89%, which means a low rate of false positive [8]. The high value of recall shows the model intended to find most of the defaulters, and it did indeed. For example, in 10,000 people our model classified into defaulter category, 8,500 people are really default the loan. Table 2 visualises each metric’s value, what it means, and an example to help understand the model accuracy of default borrower risk.
Table 2. Model Performance Metrics
|
Metric |
Value (%) |
Description |
Example |
|
Accuracy |
92 |
Proportion of correctly classified instances |
92% of all instances were correctly classified |
|
Precision |
89 |
Rate of true positives among the predicted positives |
89% of instances predicted as defaults were actual defaults |
|
Recall |
85 |
Rate of true positives among the actual positives |
85% of actual defaults were correctly identified |
|
F1-score |
87 |
Harmonic mean of precision and recall |
Balanced measure of precision and recall |
|
AUC-ROC |
95 |
Discriminative power of the model |
High effectiveness in distinguishing between defaulters and non-defaulters |
4.2.Feature Importance
Analyse the feature importance and find out the top three features as borrower income, credit score and debt-to-income ratio as predictors of the default risk. With a closer look, borrower income is the most important feature. As borrower income goes up, the default risk goes down. This could be intuitively reasonable. Borrower credit score reflects a person’s creditworthiness directly. Higher the score, lower is the default risk.[9] This feature plays a significant role. Debt-to-income ratio shows how much the borrower is tied up with the financial repayment. It reflects the degree of financial strain. Therefore, a higher debt-to-income ratio, means greater default risk. These results are credit risk management knowledge and empirical evidence in related literature. For example, the default rate is 2 per cent for borrowers with a greater than $50,000 income. Compare to a default rate of 15 per cent with less than $30,000 income.[10].
5.Conclusion
With the help of the large set of borrower attributes and historical loan outcomes, this study has demonstrated that the SVM models can well predict borrower’s default risk. The result suggests that SVM models indeed can achieve higher prediction precision than traditional statistical methods and are more resistant to outliers. Current empirical results indicate that financial institutions can definitely benefit from using SVM models for better management of default risk. Insights from this paper suggest that if financial institutions are able to better identify riskier borrowers, they can make better lending decisions (e.g., not to lend money to those who cannot repay), set more realistic interest rates, and allocate more resources to low-risk borrowers. As a result, financial institutions can not only reduce the number of defaults but also maximise profit. More importantly, the relationship between borrowers and financial institutions are strengthened because borrowers do not have to rely as much on private intermediaries such as money lenders and have to bear less interest surcharge. Furthermore, when AI models like SVM are used, the credit assessment process can be automated and the loan approval process can be expedited. This allows financial institutions to free up time and reduce payroll expenses related to manual credit evaluation.
References
[1]. Roy, Atin, and Subrata Chakraborty. "Support vector machine in structural reliability analysis: A review." Reliability Engineering & System Safety 233 (2023): 109126.
[2]. Kurani, Akshit, et al. "A comprehensive comparative study of artificial neural network (ANN) and support vector machines (SVM) on stock forecasting." Annals of Data Science 10.1 (2023): 183-208.
[3]. Tarzanagh, Davoud Ataee, et al. "Transformers as support vector machines." arXiv preprint arXiv:2308.16898 (2023).
[4]. Alhussan, Amel Ali, et al. "Facial Expression Recognition Model Depending on Optimized Support Vector Machine." Computers, Materials & Continua 76.1 (2023).
[5]. Durango‐Gutiérrez, Maria Patricia, Juan Lara‐Rubio, and Andrés Navarro‐Galera. "Analysis of default risk in microfinance institutions under the Basel III framework." International Journal of Finance & Economics 28.2 (2023): 1261-1278.
[6]. Durango‐Gutiérrez, Maria Patricia, Juan Lara‐Rubio, and Andrés Navarro‐Galera. "Analysis of default risk in microfinance institutions under the Basel III framework." International Journal of Finance & Economics 28.2 (2023): 1261-1278.
[7]. Avramidis, Panagiotis, Ioannis Asimakopoulos, and Dimitris Malliaropulos. "Disrupted Lending Relationship and Borrower's Strategic Default." Journal of Financial Services Research 63.1 (2023): 91-116.
[8]. Madeira, Carlos. "Adverse selection, loan access and default behavior in the Chilean consumer debt market." Financial Innovation 9.1 (2023): 49.
[9]. Bhatt, Tribhuwan Kumar, et al. "Examining the determinants of credit risk management and their relationship with the performance of commercial banks in Nepal." Journal of risk and financial management 16.4 (2023): 235.
[10]. Bagale, Sita. "Credit risk management and profitability of commercial banks in Nepal." International Journal of Finance and Commerce 5.1 (2023): 60-67.
Cite this article
Liang,P. (2024). Predicting borrower default risk using support vector machine AI models. Applied and Computational Engineering,87,92-97.
Data availability
The datasets used and/or analyzed during the current study will be available from the authors upon reasonable request.
Disclaimer/Publisher's Note
The statements, opinions and data contained in all publications are solely those of the individual author(s) and contributor(s) and not of EWA Publishing and/or the editor(s). EWA Publishing and/or the editor(s) disclaim responsibility for any injury to people or property resulting from any ideas, methods, instructions or products referred to in the content.
About volume
Volume title: Proceedings of the 6th International Conference on Computing and Data Science
© 2024 by the author(s). Licensee EWA Publishing, Oxford, UK. This article is an open access article distributed under the terms and
conditions of the Creative Commons Attribution (CC BY) license. Authors who
publish this series agree to the following terms:
1. Authors retain copyright and grant the series right of first publication with the work simultaneously licensed under a Creative Commons
Attribution License that allows others to share the work with an acknowledgment of the work's authorship and initial publication in this
series.
2. Authors are able to enter into separate, additional contractual arrangements for the non-exclusive distribution of the series's published
version of the work (e.g., post it to an institutional repository or publish it in a book), with an acknowledgment of its initial
publication in this series.
3. Authors are permitted and encouraged to post their work online (e.g., in institutional repositories or on their website) prior to and
during the submission process, as it can lead to productive exchanges, as well as earlier and greater citation of published work (See
Open access policy for details).
References
[1]. Roy, Atin, and Subrata Chakraborty. "Support vector machine in structural reliability analysis: A review." Reliability Engineering & System Safety 233 (2023): 109126.
[2]. Kurani, Akshit, et al. "A comprehensive comparative study of artificial neural network (ANN) and support vector machines (SVM) on stock forecasting." Annals of Data Science 10.1 (2023): 183-208.
[3]. Tarzanagh, Davoud Ataee, et al. "Transformers as support vector machines." arXiv preprint arXiv:2308.16898 (2023).
[4]. Alhussan, Amel Ali, et al. "Facial Expression Recognition Model Depending on Optimized Support Vector Machine." Computers, Materials & Continua 76.1 (2023).
[5]. Durango‐Gutiérrez, Maria Patricia, Juan Lara‐Rubio, and Andrés Navarro‐Galera. "Analysis of default risk in microfinance institutions under the Basel III framework." International Journal of Finance & Economics 28.2 (2023): 1261-1278.
[6]. Durango‐Gutiérrez, Maria Patricia, Juan Lara‐Rubio, and Andrés Navarro‐Galera. "Analysis of default risk in microfinance institutions under the Basel III framework." International Journal of Finance & Economics 28.2 (2023): 1261-1278.
[7]. Avramidis, Panagiotis, Ioannis Asimakopoulos, and Dimitris Malliaropulos. "Disrupted Lending Relationship and Borrower's Strategic Default." Journal of Financial Services Research 63.1 (2023): 91-116.
[8]. Madeira, Carlos. "Adverse selection, loan access and default behavior in the Chilean consumer debt market." Financial Innovation 9.1 (2023): 49.
[9]. Bhatt, Tribhuwan Kumar, et al. "Examining the determinants of credit risk management and their relationship with the performance of commercial banks in Nepal." Journal of risk and financial management 16.4 (2023): 235.
[10]. Bagale, Sita. "Credit risk management and profitability of commercial banks in Nepal." International Journal of Finance and Commerce 5.1 (2023): 60-67.