


1. Introduction
The film industry can impact global culture and the economy in a profound manner, with box office revenue (BOR) serving as a critical indicator that marks the commercial success of a film. As the film market rapidly expands and undergoes digital transformation, the need for accurate box office prediction has become increasingly urgent. Traditional prediction methods struggle to keep up with emerging market trends, such as the influence of social media and online reviews. To address this challenge, this study employs a combination of machine learning, deep learning, and statistical methods to develop a comprehensive box office prediction model that integrates multiple data sources. This model not only helps to improve prediction accuracy as well as practicality but also provides valuable support for the scientific formulation of film production and marketing strategies.
This paper will review significant research achievements in the realm of movie box office prediction and delve into the effectiveness and challenges of various methods in practical applications. A solid foundation has already been laid by the study on movie box office prediction. Since Litman employed a multiple linear regression model to analyze the impact of creative allocation and release timing on box office performance, research in this area has continued to deepen [1]. In 2000, Eliashberg and Jonker utilized Markov chains to explore box office factors, albeit with limitations due to the subjectivity of data [2]. By 2008, Dellarocasand Wood emphasized the influence on box office outcomes imposed by social media [3]. The impact of star actors and directors is also paramount in box office prediction. Yao and Hua confirmed the positive influence on box office results brought by film directors and star actors, with directors exerting a particularly significant effect [4, 5]. Zhou leveraged machine learning and data visualization tools to make complex data analysis more intuitive and efficient [6].
He and Hu constructed an efficient box office prediction model using Maoyan data and ensemble algorithms, enhancing prediction accuracy [7]. Dai and Chen explored the box office prediction of Chinese movies based on BP neural networks together with big data technology, demonstrating higher accuracy than traditional models [8]. Yan introduced new variables such as theme-based movies and pandemic impacts, utilizing the MSC-SVM model to improve prediction performance [9]. Lu employed ensemble learning methods to enhance model stability by optimizing XGBoost parameters [10]. Yao significantly improved the accuracy of domestic movie box office predictions with the XGB-CatBoost model combined with a minimum relative error weighting method [11]. Han integrated Stacking ensemble learning with hyperparameter optimization methods, significantly reducing prediction errors through the GWO optimization algorithm [12]. Fang innovatively incorporated sentiment analysis of movie reviews into box office models, enhancing prediction accuracy [13].
Madongo and Zhong achieved a 59.30% accuracy in predicting opening weekend box office by combining visual features of movie posters with metadata based on the DMFCNN model [14]. Chen proposed a weighted Stacking algorithm combined with deep learning to further enhance box office prediction performance [15]. Zha conducted a study to inspect the influence of directors' centrality on box office outcomes of Hollywood movies based on BP neural networks and complex network theory, optimizing prediction models [16]. The realm of prediction on movie box office continues to evolve, transitioning from basic statistical models to more sophisticated machine learning and data analysis techniques [17]. Researchers are exploring diverse methodologies, ranging from multiple linear regression and Markov chains to ensemble learning, neural networks, and multimodal feature classification, to predict the box office in more accurate ways with better efficiency. Notably, the introduction to machine learning technologies has significantly enhanced the capability to handle complex datasets, enabling the comprehensive consideration of factors such as social media influence, the impact of stars and directors, and market dynamics.
2. Methodology
2.1. Data sources and description
The database utilized in this study originates from the "TMDB Box Office Prediction" competition hosted on Kaggle, encompassing detailed information and box office data for films released between 1990 and 2018. This extensive dataset comprises data on 3000 films, each film entry including fundamental information (e.g., movie title, release date), film-specific attributes (such as genre, language, budget), and related metadata (like cast and crew, production companies). Notably, each record also incorporates the film's worldwide gross box office revenue, serving as the target variable for prediction in this research. Table 1 presents a comprehensive statistical summary of all fields extracted from the "TMDB Box Office Prediction" dataset.
Table 1. Detailed Field Statistics of Training Set
Field | Number | Unique Value | Frequency |
id | 3000 | - | - |
budget | 3000 | - | - |
genres | 2993 | 872 | 266 |
imdb_id | 3000 | 3000 | 1 |
original_language | 3000 | 36 | 2575 |
original_title | 3000 | 2975 | 2 |
overview | 2992 | 2992 | 1 |
popularity | 3000 | - | - |
poster_path | 2999 | 2999 | 1 |
production_companies | 2844 | 2383 | 51 |
production_countries | 2945 | 321 | 1752 |
release_date | 3000 | 2398 | 5 |
runtime | 2998 | - | - |
spoken_languages | 2980 | 401 | 1817 |
status | 3000 | 2 | 2996 |
tagline | 2403 | 2400 | 1 |
title | 3000 | 2969 | Multiple |
Keywords | 2724 | 2648 | 27 |
cast | 2987 | 2975 | 1 |
crew | 2984 | 2984 | 1 |
revenue | 3000 | - | - |
2.2. Machine learning
Figure 1 shows the data analysis workflow for predicting movie box office revenue. The process starts with data loading and cleaning to address inconsistencies and missing values.
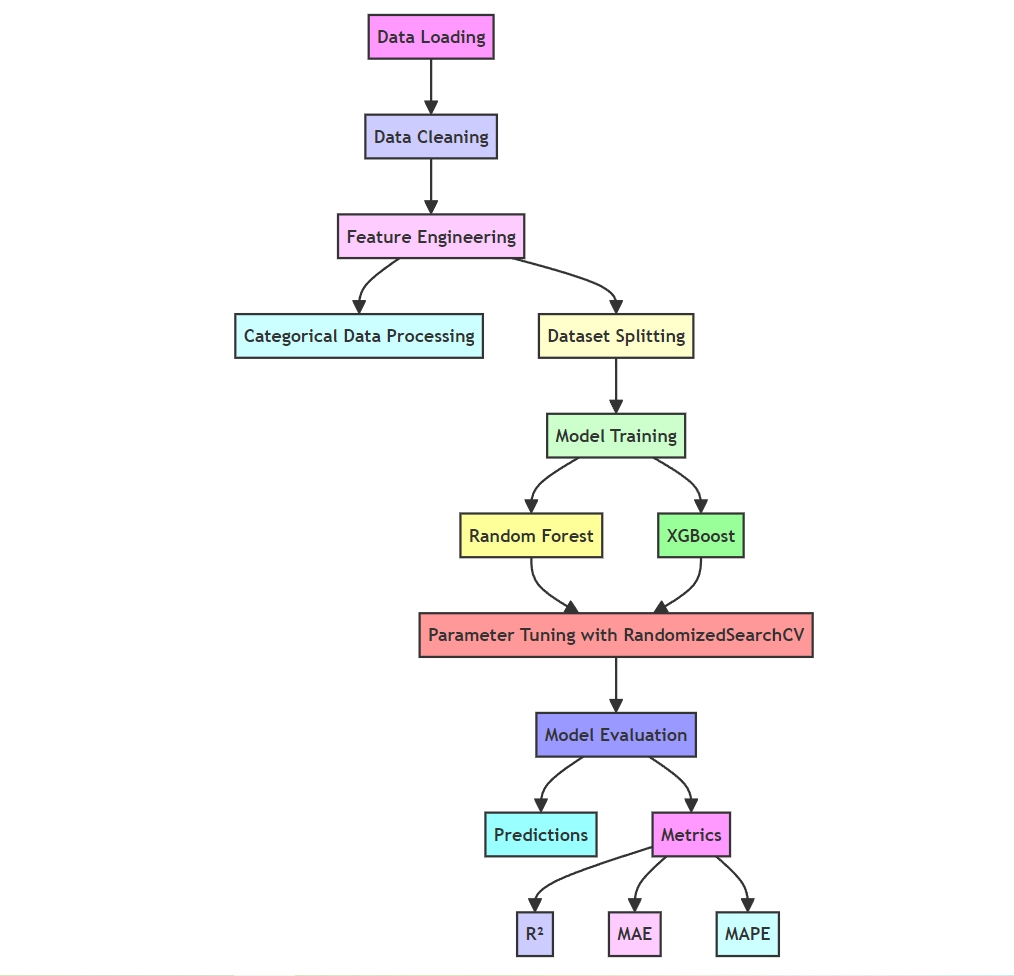
Figure 1. Data Analysis Workflow for Predicting Movie Box Office Revenue.
Next, feature engineering and categorical data processing prepare the dataset for model training. This paper uses Random Forest and XGBoost for training and optimize their parameters to improve performance. Finally, this paper evaluates the model’s prediction accuracy using metrics like R², MAE, and MAPE to ensure accurate global revenue predictions for movies.
The data was partitioned into an integration of a training set with a test set accounting for 80% and 20% respectively to ensure the model's generalization ability on unseen data. In this study, Random Forest and XGBoost (Extreme Gradient Boosting) were used in the prediction of movie box office revenue. Random Forest, known as an ensemble method using multiple decision trees and voting, reduces overfitting, improves generalization, and handles high-dimensional data well. It identifies important features, is less sensitive to hyperparameters, and provides reliable results quickly. Key parameters were defined such as n_estimators (i.e. the number of trees), max_depth (maximum depth), min_samples_split (minimum samples to split a node), and min_samples_leaf (minimum samples per leaf). Efficient parameter tuning, model training, and evaluation were performed using RandomizedSearchCV and three-fold cross-validation.
XGBoost, based on gradient boosting, is highly regarded for its efficiency and accuracy in machine learning competitions. It manages missing values, uses parallel processing, and trains quickly on large datasets. Key parameters include n_estimators (i.e. the number of trees), max_depth (tree depth), learning_rate (learning rate), subsample (subsample ratio), and colsample_bytree (feature subsampling ratio). These parameters impact training speed and performance. RandomizedSearchCV optimizes them through random sampling and cross-validation. Having found the optimal parameters, the XGBoost model is trained, and its performance is evaluated using metrics like R² (coefficient of determination), mean absolute error (MAE), and mean absolute percentage error (MAPE). To optimize model performance, the following parameter space was defined, as shown in Table 2.
Table 2. Parameter Space Settings for Random Forest and XGBoost Models
Type | Random Forest | XGBoost |
n_estimators | 100 to 500 | 100 to 500 |
max_depth | 10 to 40 and no limit | 3 to 8 |
min_samples_split | 2 to 10 | Not Applicable |
min_samples_leaf | 1 to 4 | Not Applicable |
learning_rate | Not Applicable | 0.01 to 0.2 |
subsample | Not Applicable | 0.6 to 1.0 |
colsample_bytree | Not Applicable | 0.6 to 1.0 |
During model training, RandomizedSearchCV is used for hyperparameter tuning. It efficiently explores a wide parameter space through random sampling, evaluating each combination with 100 iterations (n_iter=100) and 3-fold cross-validation (cv=3). After training, the best models are selected and used for predictions on the test set. Model performance is assessed using three metrics: R², mean absolute error (MAE), and mean absolute percentage error (MAPE).
2.3. Deep learning
2.3.1. Bidirectional LSTM model structure and principles. Bidirectional Long Short-Term Memory (Bidirectional LSTM) is an advanced LSTM model with both forward and backward layers. It processes data in both directions, allowing it to capture information from past and future sequences simultaneously. This makes Bidirectional LSTM ideal for time-series data, such as predicting movie box office revenue, as it better captures market trends and consumer behavior by analyzing sequences in both directions.
2.3.2. SimpleRNN model structure and principles. Simple Recurrent Neural Network (SimpleRNN) is a basic model designed for simple time-series problems. It maintains a hidden state at each step to capture dependencies within the sequence. However, SimpleRNN often struggles with the vanishing gradient problem in long sequences, resulting in lower performance compared to LSTM on complex data. Nevertheless, it can still deliver effective predictions for shorter or simpler time-series data.
2.3.3. Bidirectional LSTM model structure and principles. Custom Loss Function: In this model, the loss function is a combination of Mean Squared Error (MSE) with the Log-Cosh loss function. MSE focuses on reducing the difference between the predicted and actual values, while Log-Cosh can handle outliers better, thus improving the model's robustness. The loss function is defined as: \( Loss=MSE+log(cosh(predicted value-actual value)) \) . This combined loss function retains the accuracy of MSE while better handling deviations in nonlinear data.
3. Results and discussion
3.1. Model performance
An R² of 0.6724 was achieved by the Random Forest model, indicating that it explains a significant section of the data’s variability. Its MAE was 0.2844 and MAPE was 1.6010%, reflecting its accuracy in box office predictions (Table 3).
Table 3. Model performance comparison
Model | Optimal Parameters | R² | MAE | MAPE (%) |
Random Forest | n_estimators: 500 min_samples_split:2 min_samples_leaf:2 max_depth: 10 random_state: 42 | 0.67236 | 0.28439 | 1.601 |
XGBoost | subsample: 0.7 n_estimators: 400 max_depth:4 learning_rate: 0.01 colsample_bytree:0.8 random_state: 42 | 0.70841 | 0.28065 | 1.3643 |
Bidirectional LSTM | LSTM Layer 1: 128 neuronsLSTM Layer 2: 64 neuronslearning_rate: 0.001dropout: 0.2 | 0.7364 | 0.3319 | 1.3802 |
Simple RNN | RNN Layer 1: 128 neuronsRNN Layer 2: 64 neuronslearning_rate: 0.001dropout: 0.2 | 0.7027 | 0.3136 | 1.4840 |
XGBoost performed better, with an R² of 0.7084, and lower MAE and MAPE values of 0.2807 and 1.3643%, respectively, indicating higher precision and lower prediction errors.
The Bidirectional LSTM model, with an R² of 0.7364, captured complex patterns effectively. However, its MAE and MAPE were 0.3319 and 1.3802%, respectively, suggesting a trade-off between complexity and prediction error.
The SimpleRNN model had an R² of 0.7027, an MAE of 0.3136, and a MAPE of 1.4840%. It provided balanced performance but was less effective for complex data compared to Bidirectional LSTM.
Overall, the Bidirectional LSTM is selected as the best model for the prediction of movie box office due to its superior performance with complex time-series data.
3.2. Machine learning visualization
3.2.1. Feature correlation. This study explored the correlations between features in the movie dataset through a correlation matrix to identify key factors that may influence movie box office performance.
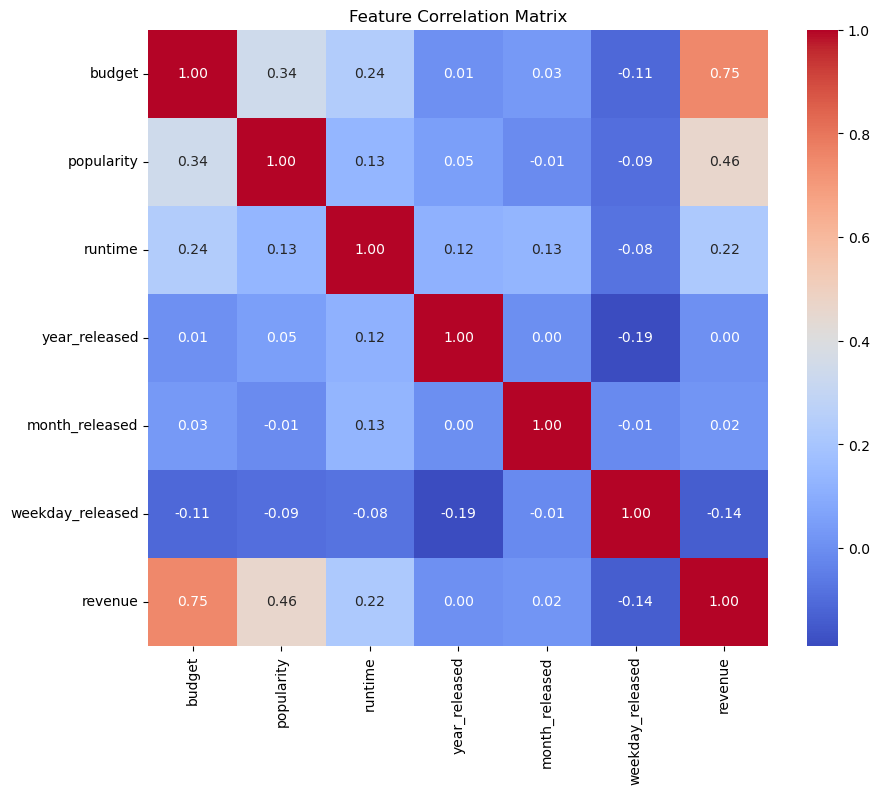
Figure 2. Film data feature correlation matrix
Figure 2 shows that budget has a strong positive correlation of 0.75 with box office revenue, indicating that higher budgets generally lead to higher revenue. Popularity has a moderate positive correlation of 0.46, suggesting that market appeal also affects revenue. Movie length has a weak positive correlation of 0.22, implying it has a minor impact on revenue. Factors like release month and day of the week have lower correlations, with the day of the week at -0.14, indicating possible cyclical effects. Overall, budget, popularity, and movie length are key factors influencing box office revenue.
3.2.2. Forecast results and error analysis. The relationship between predicted and actual values is depicted in Figure 3, with perfect predictions represented by the dashed line.
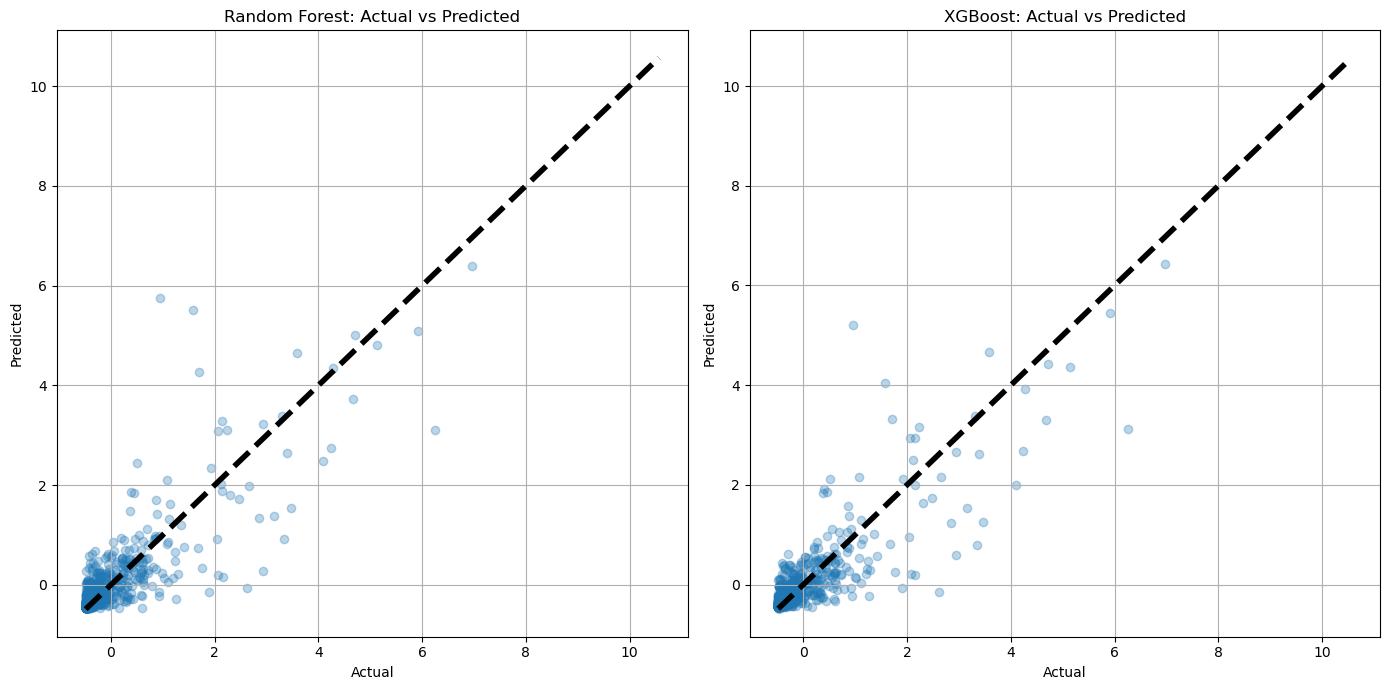
Figure 3. Scatter Plot Comparing Actual vs. Predicted Outcomes for Random Forest and XGBoost
For the Random Forest model, points are mainly concentrated in the lower range of actual values (0-2), indicating good prediction consistency for low revenues but sparse and variable predictions for high revenues.
The XGBoost model also shows concentration in the low revenue range but with less dispersion than Random Forest, suggesting better clustering. Predictions for high revenues are more concentrated than those of Random Forest, indicating that XGBoost may be more accurate and consistent for high revenues.
Both models perform well for low to medium box office revenues but struggle with predicting high revenues.
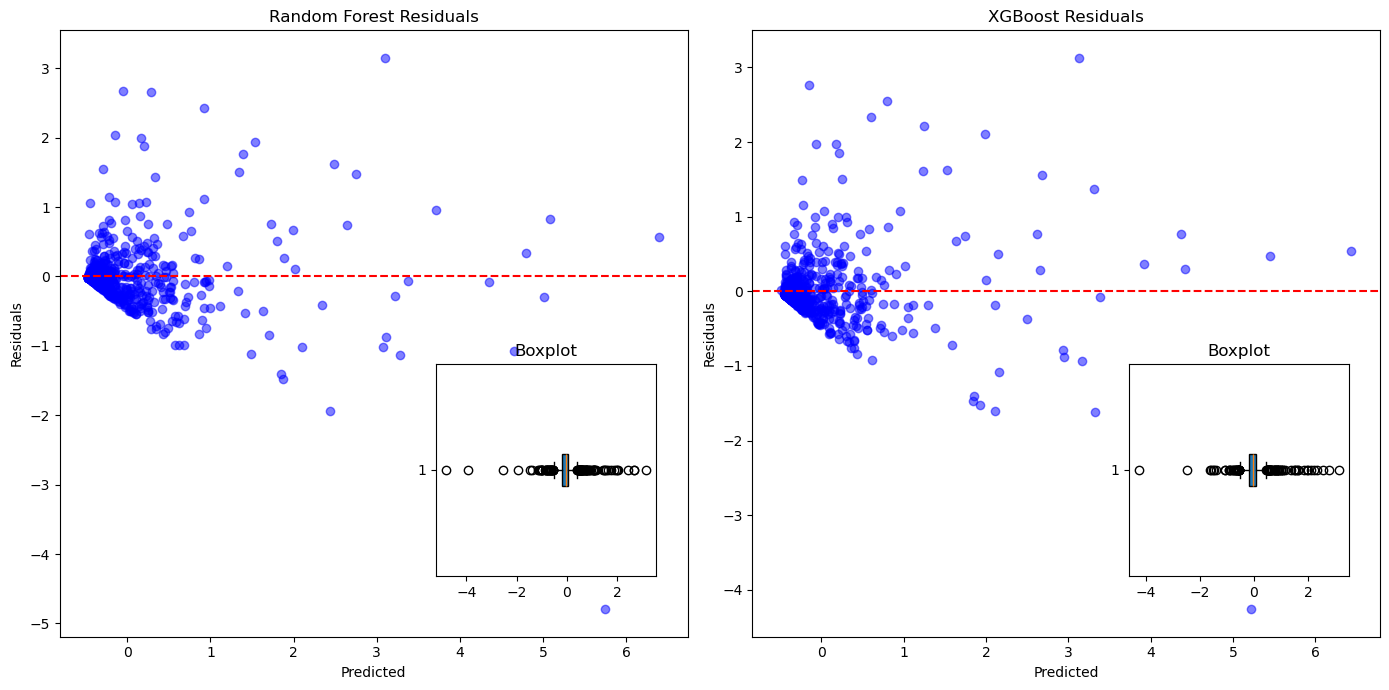
Figure 4. Distribution of Prediction Accuracy and Error for Two Predictive Models
The Random Forest model's residual plot, which is displayed in Figure 4, reveals that most forecasts are fairly close to the actual values, with residuals typically being close to zero. However, there is a wide residual range (from -2 to 2), indicating some significant prediction errors and noticeable outliers. The box plot confirms that while the median is close to zero, there are several larger errors.
In contrast, the residual plot for the XGBoost model shows data points more tightly clustered around zero, suggesting better error control and consistency. Residuals are mainly within -1 to 1, and although there are still outliers, the overall distribution is more compact. In comparison to Random Forest, the XGBoost box plot shows a shorter interquartile range and fewer outliers, indicating better accuracy and robustness. Overall, XGBoost shows better prediction accuracy and error management than Random Forest.
3.2.3. Feature importance analysis. Feature importance is shown in Figure 5 shows for utilizing the Random Forest model to predict movie box office revenues. The feature budget_year_ratio is the most important, indicating that the ratio of movie budget to release year is crucial. Other important features include inflationBudget and budget, which relate to financial investment, and log_budget and popularity_mean_year, reflecting the impact of popularity and adjusted budget on box office performance.
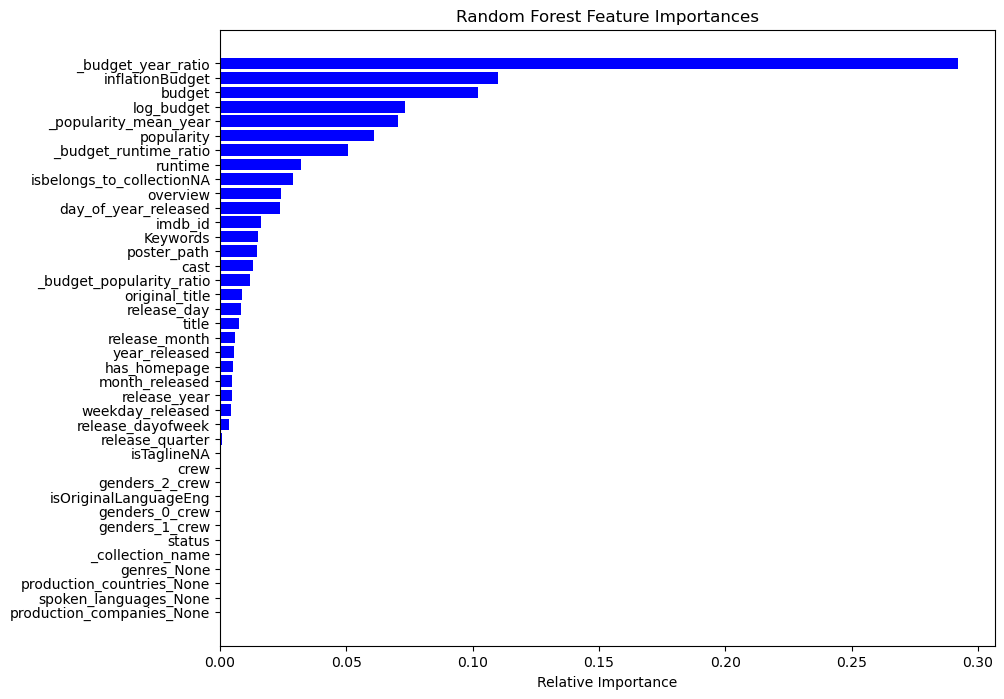
Figure 5. Random Forest Feature Importance Chart
These results highlight the significance of budget and marketing, as well as how popularity affects market appeal. Features like isTaglineNA and production_countries_None have low importance and contribute less to predictions, likely due to their weak correlation with revenues.
Figure 6 shows feature importance for movie box office prediction using XGBoost. Financial features like log_budget, budget_year_ratio, budget, and inflationBudget are the most critical, highlighting the significant impact of investment on a film’s success. budget_runtime_ratio and popularity_mean_year also play important roles, reflecting how movie popularity and appeal contribute to box office performance. Additionally, runtime and popularity directly affect box office results, emphasizing the influence of audience preferences.
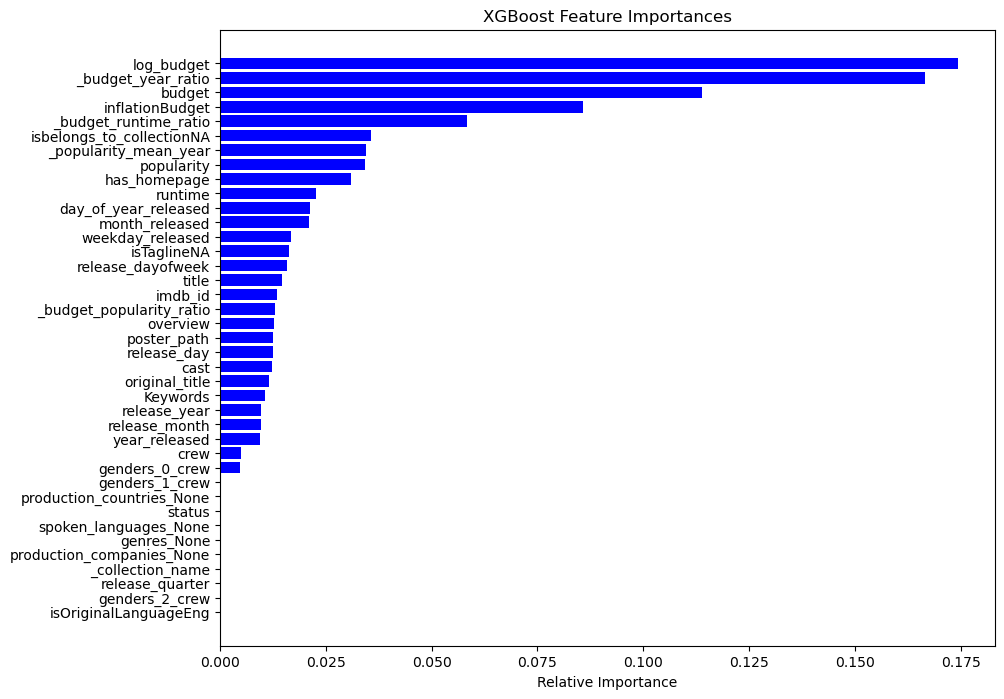
Figure 6. XGBoost Feature Importance Map
3.3. Deep learning visualization
Figure 7 illustrates how the training loss initially drops off quickly before stabilizing at roughly 10 epochs and then dropping to a low level. This indicates that the model's performance on the training set is gradually optimized and stabilized.
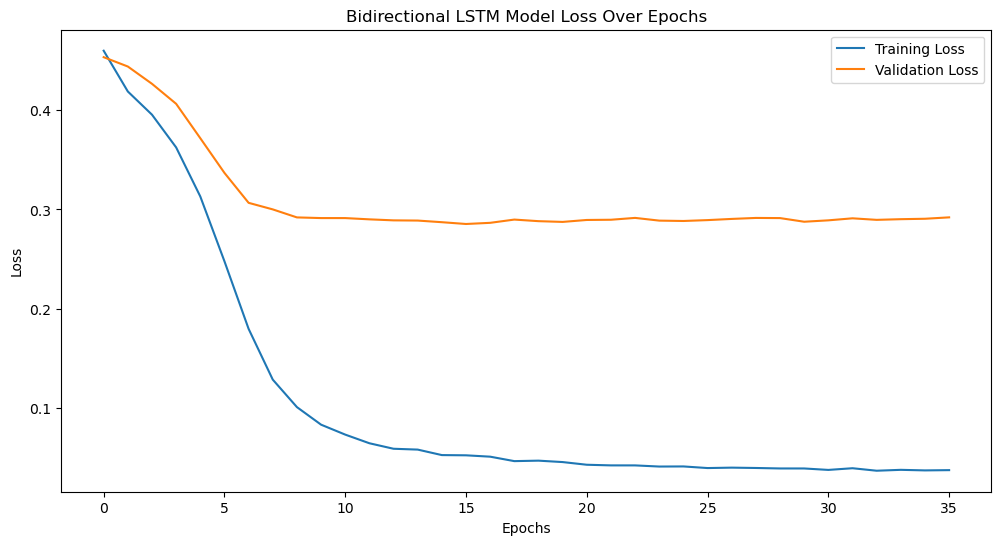
Figure 7. Bidirectional LSTM Model Loss Over Epochs
The validation loss decreases at a slightly slower rate than the training loss and begins to stabilize around 10 epochs. Although the validation loss is higher, the model does not show appreciable overfitting on the validation set, as evidenced by the rather constant gap between the training and validation losses.
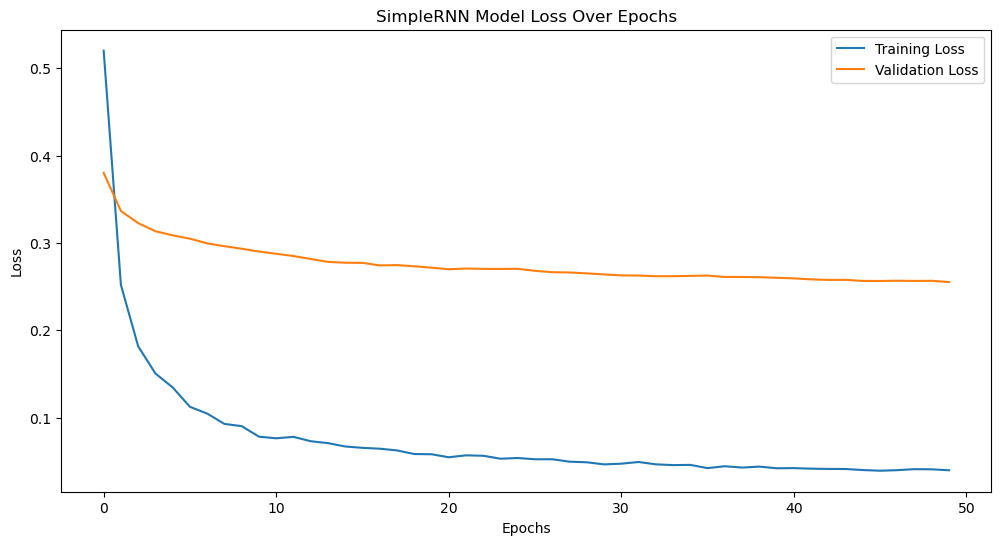
Figure 8. SimpleRNN Model Loss Over Epochs
Figure 8 illustrates how SimpleRNN's training loss likewise drops off quickly in the first few epochs before stabilizing at about 10 epochs, eventually reaching a low value, indicating that the model has gradually achieved a good fit on the training data.
The validation loss decreases at a slower pace and stabilizes after the first 10 epochs. Compared to Bidirectional LSTM, the validation loss curve for SimpleRNN shows some differences, with a slower decline and slight fluctuations later on, which may indicate some instability on the validation set and suggest the potential presence of slight overfitting.
Both models demonstrate a good downward trend in training and validation losses, indicating that they are learning and optimizing over time. However, the Bidirectional LSTM model shows more stable validation loss, while the SimpleRNN model's validation loss fluctuates somewhat in the later stages, possibly indicating that Bidirectional LSTM has better generalization ability on this task compared to SimpleRNN.
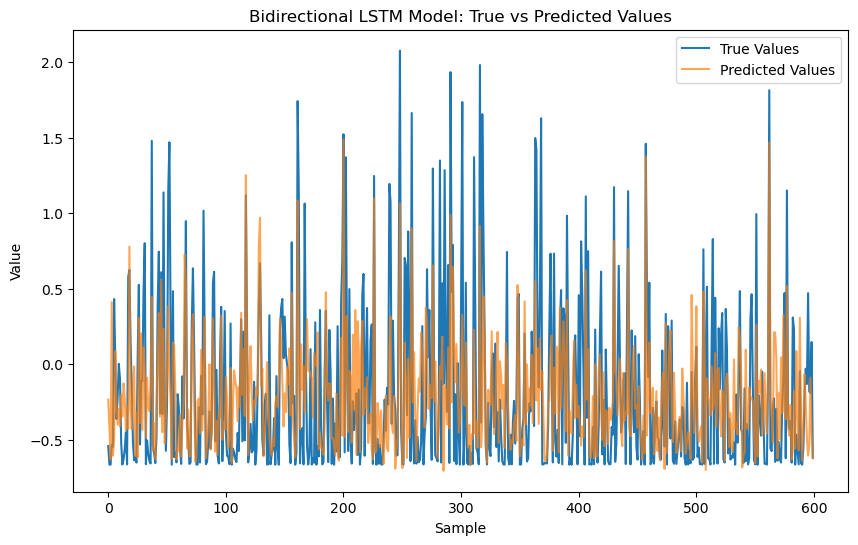
Figure 9. Bidirectional LSTM Model: True vs Predicted Values
Figure 9 shows a comparison between the predicted values and the actual values on the test set using the Bidirectional LSTM model. The actual values are represented by the blue line while the model's predictions by the orange line. As is displayed in the figure, the model's predictions generally follow similar trends and patterns to the actual values in most cases. However, there are certain data points where discrepancies exist between the predicted and actual values, particularly in regions with higher or lower peaks. Overall, the Bidirectional LSTM model is able to track the trends in the data well, but its prediction accuracy may decline in some extreme cases.
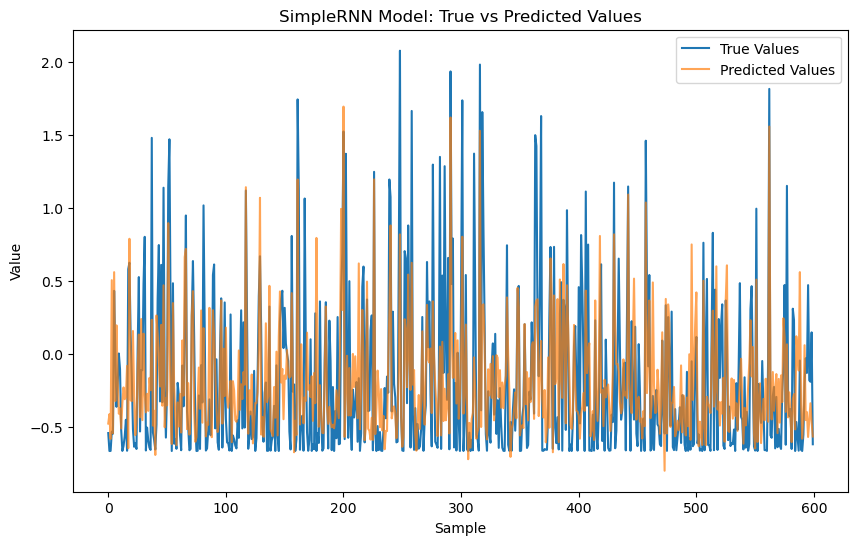
Figure 10. SimpleRNN Model: True vs Predicted Values
Figure 10 presents a comparison of the predicted and actual values on the test set using the SimpleRNN model. The actual values are marked by the blue line while the model's predictions by the orange line. Compared to the Bidirectional LSTM model, the SimpleRNN model also shows a good fit between the predicted and actual values. The overall trends are consistent, but the SimpleRNN model exhibits more noticeable discrepancies in some data points, especially in areas with rapid changes. This suggests that the SimpleRNN model may be less stable than the Bidirectional LSTM model in capturing complex data patterns.
Both models demonstrate a good fit between the predicted and actual values, but the Bidirectional LSTM model has a slight advantage in capturing data trends. The SimpleRNN model, on the other hand, may show larger discrepancies in certain cases, particularly when dealing with rapidly changing data.
3.4. Discussion
Through comparative analysis, this paper found that the Bidirectional LSTM performed exceptionally well in movie box office prediction, particularly in handling complex time-series data. With an R² value of 0.7364, higher than the other models, it demonstrated superior ability in capturing data trends and patterns, showcasing strong predictive power.
Feature importance analysis revealed that budget, budget-year ratio, and inflation-adjusted budget are key factors influencing box office revenue. These financial indicators have a direct impact on a movie’s commercial success, further validating the Bidirectional LSTM’s capability in managing complex financial and market data.
Compared to other models, the Bidirectional LSTM is better at capturing intricate patterns within the data, particularly when dealing with time-series data related to movie box office performance. As a result, the Bidirectional LSTM was selected as the best model for movie box office prediction.
The findings of this study hold practical value for decision-making in the film industry, aiding in the optimization of movie budgets and marketing strategies, and helping producers and distributors make more accurate business decisions. Future research could explore the integration of additional data sources, such as social media sentiment and audience reviews, to further enhance the model's predictive accuracy and applicability.
4. Conclusion
The effectiveness of several machine learning and deep learning models in predicting movie box office was methodically examined in this study whose results show that the Bidirectional LSTM model performed the best in handling complex time-series data, with a high R² value, demonstrating strong trend-capturing capabilities. The XGBoost model excelled in prediction accuracy and stability, making it particularly suitable for dealing with complex data and outliers.
Feature importance analysis further confirmed that financial indicators such as budget, budget-year ratio, and inflation-adjusted budget are critical factors influencing movie box office revenue. These factors directly determine a movie's commercial success.
The conclusions of the study offer insightful information to help the film business make decisions., aiding producers and distributors in optimizing budgets and marketing strategies. Future research could integrate additional dimensions of data, such as social media sentiment and audience reviews, to further enhance prediction accuracy and model applicability. Additionally, exploring more advanced algorithms could drive further advancements in the realm of predicting movie box office.
References
[1]. Litman B R and Kohl L S 1989 Predicting financial success of motion pictures: the '80s experience. Journal of Media Economics, 2(2), 35-50.
[2]. Jehoshua E, Jedid-Jah J, Mohanbir S S and Berend W 2000 MOVIEMOD: An Implementable Decision Support System for Prerelease Market Evaluation of Motion Pictures. Marketing Science, 19(3), 226-243.
[3]. Dellarocas C and Wood C A 2008 The sound of silence in online feedback: Estimating trading risks in the presence of reporting bias. Management Science, 54(3), 460-476.
[4]. Cheung C M and Thadani D R 2012 The impact of electronic word-of-mouth communication: A literature analysis and integrative model. Decision Support Systems, 54(1), 461-470.
[5]. Yao W 2018 A Study on the Box Office Characteristics of Domestic Films in the Chinese Mainland Market and Their Influencing Factors: An Empirical Analysis Based on the PLS Model. Price Theory and Practice, 2, 83-86.
[6]. Hua R, Wang S and Xu Y 2019 A Study on the Influencing Factors of Chinese Film Box Office. Statistics and Decision, 4, 97-100.
[7]. Zhou H 2021 Research and Implementation of Movie Box Office Analysis Based on Machine Learning. Beijing University of Posts and Telecommunications.
[8]. He Q and Hu B 2021 Research on the influencing factors of film consumption and box office forecast in the digital era: based on the perspective of machine learning and model integration. Wireless Communications and Mobile Computing, 1, 6094924.
[9]. Dai D and Chen J 2021 Research on mathematical model of box office forecast through BP neural network and big data technology. Journal of Physics: Conference Series, 1952(4), 042118.
[10]. Yan X 2022 Research on Movie Box Office Prediction Based on Machine Learning. University of International Business and Economics.
[11]. Lu H 2022 Research on Movie Box Office Prediction Based on Ensemble Learning. Anhui University.
[12]. Yao L 2022 Prediction of Domestic Film Box Office Based on XGB-CatBoost Combined Model. Zhongnan University of Economics and Law.
[13]. Han X 2023 Research on Movie Box Office Prediction Based on Stacking Ensemble and Hyperparameter Optimization. Shanxi University.
[14]. Fang L 2023 Movie Box Office Data Prediction Based on GBRT-Stacking Ensemble Learning Algorithm. Shanghai Normal University.
[15]. Madongo C T and Zhongjun T 2023 A movie box office revenue prediction model based on deep multimodal features. Multimedia Tools and Applications, 82(21), 31981-32009.
[16]. Chen X 2024 Movie Box Office Prediction Based on Machine Learning. North China University of Technology.
[17]. Cha C 2024 Research on Hollywood Movie Box Office Prediction Based on BP Neural Network. Inner Mongolia University of Finance and Economics.
Cite this article
Zheng,Y. (2024). Predicting Movie Box Office Based on Machine Learning, Deep Learning, and Statistical Methods. Applied and Computational Engineering,94,20-32.
Data availability
The datasets used and/or analyzed during the current study will be available from the authors upon reasonable request.
Disclaimer/Publisher's Note
The statements, opinions and data contained in all publications are solely those of the individual author(s) and contributor(s) and not of EWA Publishing and/or the editor(s). EWA Publishing and/or the editor(s) disclaim responsibility for any injury to people or property resulting from any ideas, methods, instructions or products referred to in the content.
About volume
Volume title: Proceedings of CONF-MLA 2024 Workshop: Securing the Future: Empowering Cyber Defense with Machine Learning and Deep Learning
© 2024 by the author(s). Licensee EWA Publishing, Oxford, UK. This article is an open access article distributed under the terms and
conditions of the Creative Commons Attribution (CC BY) license. Authors who
publish this series agree to the following terms:
1. Authors retain copyright and grant the series right of first publication with the work simultaneously licensed under a Creative Commons
Attribution License that allows others to share the work with an acknowledgment of the work's authorship and initial publication in this
series.
2. Authors are able to enter into separate, additional contractual arrangements for the non-exclusive distribution of the series's published
version of the work (e.g., post it to an institutional repository or publish it in a book), with an acknowledgment of its initial
publication in this series.
3. Authors are permitted and encouraged to post their work online (e.g., in institutional repositories or on their website) prior to and
during the submission process, as it can lead to productive exchanges, as well as earlier and greater citation of published work (See
Open access policy for details).
References
[1]. Litman B R and Kohl L S 1989 Predicting financial success of motion pictures: the '80s experience. Journal of Media Economics, 2(2), 35-50.
[2]. Jehoshua E, Jedid-Jah J, Mohanbir S S and Berend W 2000 MOVIEMOD: An Implementable Decision Support System for Prerelease Market Evaluation of Motion Pictures. Marketing Science, 19(3), 226-243.
[3]. Dellarocas C and Wood C A 2008 The sound of silence in online feedback: Estimating trading risks in the presence of reporting bias. Management Science, 54(3), 460-476.
[4]. Cheung C M and Thadani D R 2012 The impact of electronic word-of-mouth communication: A literature analysis and integrative model. Decision Support Systems, 54(1), 461-470.
[5]. Yao W 2018 A Study on the Box Office Characteristics of Domestic Films in the Chinese Mainland Market and Their Influencing Factors: An Empirical Analysis Based on the PLS Model. Price Theory and Practice, 2, 83-86.
[6]. Hua R, Wang S and Xu Y 2019 A Study on the Influencing Factors of Chinese Film Box Office. Statistics and Decision, 4, 97-100.
[7]. Zhou H 2021 Research and Implementation of Movie Box Office Analysis Based on Machine Learning. Beijing University of Posts and Telecommunications.
[8]. He Q and Hu B 2021 Research on the influencing factors of film consumption and box office forecast in the digital era: based on the perspective of machine learning and model integration. Wireless Communications and Mobile Computing, 1, 6094924.
[9]. Dai D and Chen J 2021 Research on mathematical model of box office forecast through BP neural network and big data technology. Journal of Physics: Conference Series, 1952(4), 042118.
[10]. Yan X 2022 Research on Movie Box Office Prediction Based on Machine Learning. University of International Business and Economics.
[11]. Lu H 2022 Research on Movie Box Office Prediction Based on Ensemble Learning. Anhui University.
[12]. Yao L 2022 Prediction of Domestic Film Box Office Based on XGB-CatBoost Combined Model. Zhongnan University of Economics and Law.
[13]. Han X 2023 Research on Movie Box Office Prediction Based on Stacking Ensemble and Hyperparameter Optimization. Shanxi University.
[14]. Fang L 2023 Movie Box Office Data Prediction Based on GBRT-Stacking Ensemble Learning Algorithm. Shanghai Normal University.
[15]. Madongo C T and Zhongjun T 2023 A movie box office revenue prediction model based on deep multimodal features. Multimedia Tools and Applications, 82(21), 31981-32009.
[16]. Chen X 2024 Movie Box Office Prediction Based on Machine Learning. North China University of Technology.
[17]. Cha C 2024 Research on Hollywood Movie Box Office Prediction Based on BP Neural Network. Inner Mongolia University of Finance and Economics.