


1. Introduction
Schizophrenia, as a severe mental disorder, impacts various aspects of a person's life. It profoundly affects one's thinking, emotions, behavior, and cognitive functions. Patients with schizophrenia may experience symptoms such as hallucinations, disorganized thinking, impairment in attention, memory, and decision-making abilities, delusions, and emotional blunting. They may also exhibit lower levels of motor activity, poor sleep quality and efficiency, and fragmented sleep [1]. These negative manifestations can cause significant functional impairments in a person's social relationships, work capabilities, and daily living skills. Therefore, the timely detection of schizophrenia is crucial. Historically, diagnosis relied heavily on clinical interviews, psychological testing, observation, and behavioral analysis. However, due to the over-reliance on symptom descriptions and the lack of objective biomarkers, these methods are highly subjective, which may lead to cognitive biases by doctors and result in inaccurate diagnoses. Thus, there is an urgent need for an objective diagnostic approach.
Electroencephalography (EEG) can record neural activity in the brain, providing objective biomarkers for the diagnosis of schizophrenia. This enhances the scientific rigor and objectivity of the diagnostic process. Moreover, EEG allows for the real-time recording and monitoring of dynamic changes in brain activity, contributing to a comprehensive understanding of the patient's brain function and laying the foundation for personalized diagnosis and treatment [2].
When collecting EEG data, high-quality equipment must be used to ensure that each electrode is positioned according to international standards. Additionally, it is essential to maintain low electrode impedance. During the experiment, interference factors such as head movement, eye movement, and muscle activity should be minimized. Schizophrenia patients often exhibit specific EEG abnormal patterns, such as increased theta and delta waves. Theta waves are particularly evident in brain regions like the frontal lobe and hippocampus, which are closely related to emotions, memory, attention, and cognition. Delta waves are more pronounced in the prefrontal cortex, parietal lobe, and deep brain structures (such as the thalamus) and are characterized by high amplitude and low frequency during deep sleep. In cognitive tasks, the power of theta waves increases in schizophrenia patients, while delta wave power increases during rest. Additionally, abnormalities in the gamma frequency band are also observed in the EEG of schizophrenia patients [3].
However, EEG signals are complex and challenging to process manually, leading to the exploration of machine learning as a solution to this problem.
Machine learning has the capability to analyze large-scale, multidimensional data. Through training, machine learning models can extract subtle but crucial features from vast datasets, thereby enhancing the importance of schizophrenia diagnosis. Additionally, when dealing with complex symptoms, machine learning models can provide a standardized diagnostic process, ensuring consistency across different hospitals and doctors.
To better process EEG data and derive statistically significant results, machine learning can be effectively applied. This paper proposes the design of a classifier based on machine learning to identify and distinguish EEG signals between schizophrenia patients and healthy individuals. The primary machine learning task in this study is to develop a more reliable data processing method. This approach helps identify differences in brain activity between schizophrenia patients and healthy individuals, supporting the diagnosis and research of schizophrenia. Ultimately, the findings from this study can be translated into more useful tools to assist doctors in making more accurate diagnoses.
2. Method
2.1. Dataset and preprocessing
This study utilized data measured from schizophrenia patients by researcher Brian Roach and his research team [4]. During data processing, the study primarily employed band-pass filtering and baseline correction for preprocessing. A band-pass filter of 0.1 Hz - 50 Hz was selected to remove low-frequency drifts and high-frequency noise from the EEG signals, retaining frequency components that are meaningful for analysis. Baseline correction was applied to eliminate global shifts caused by electrode drift or environmental factors, which helps improve the accuracy of subsequent training and application of the model.
They used a simple button-press task where participants either pressed a button to immediately generate a tone, passively listened to the same tone, or pressed the button without generating a tone to study the contingent discharge in schizophrenia patients and the control group. Participants wore 72 electrodes on their heads. During the training process, 90% of the data was used to train the model, and 10% was used to test the model. Due to the 10-fold cross-validation, each data point served as part of the test set once and as part of the training set nine times throughout the entire process. Thus, all data were used as both training and test sets, but with different roles in different iterations.
2.2. EEG-based feature extraction
This study utilized both time-domain and frequency-domain features, including N100 amplitude, N100 latency, P300 amplitude, P300 latency, as well as δ power, θ power, α power, β power, and γ power. δ power refers to the power in the 1-4 Hz frequency band, θ power refers to the power in the 4-8 Hz frequency band, α power refers to the power in the 8-13 Hz frequency band, β power refers to the power in the 13-30 Hz frequency band, γ power refers to the power in the 30-50 Hz frequency band.
N100 amplitude is the negative peak of the Event-Related Potential (ERP) averaged signal within the 80-120 ms time window following the stimulus. N100 latency is the time at which the brain responds to the stimulus when the N100 amplitude occurs. P300 amplitude is the positive peak of the ERP averaged signal within the 250-500 ms time window following the stimulus. P300 latency is the time when the brain recognizes and processes the stimulus during the P300 amplitude.
N100 typically presents as a negative deflection occurring approximately 100 milliseconds after the stimulus and is primarily associated with sensory processing, attention, and perceptual changes. P300, usually a positive deflection, occurs around 300 milliseconds after the stimulus and is primarily related to attention, information processing, and memory, serving as an important indicator of cognitive function. Frequency-domain features can highlight the differences in brain waves between schizophrenia patients and healthy individuals. Schizophrenia is associated with deficits in N1 and P3 components in amplitude and cortical source summation, indicating attentional deficits in both early and late sensory/cognitive gating inputs [5].
2.3. Models
This study employs a Support Vector Machine (SVM) classifier, using the Radial Basis Function (RBF) as the kernel function. SVM, as a learning model, can be used for classification and regression tasks. It distinguishes data points by finding the hyperplane that maximizes the margin between classes. Thus, when used as a classifier, SVM typically has a low generalization error [6].
In data processing, data augmentation was performed, including adding noise, time shifts, and amplitude scaling, which enhanced the variation in signals, thereby increasing data diversity and improving the robustness of the model.
Bayesian optimization is a global optimization method used to optimize complex objective functions. It improves classification by selecting the best-fit machine learning model with adjusted hyperparameters from existing models [7]. It first builds a probabilistic model to estimate the value of the objective function at untested points and then uses an acquisition function to choose the next point to evaluate. In training the model, this study used Bayesian optimization to select the best hyperparameters for SVM, including BoxConstraint and KernelScale, which optimize the performance of the SVM classifier. Compared to traditional optimization techniques, it does not require an explicit formula for the function. Therefore, Bayesian optimization is an ideal choice for hyperparameter tuning [8].
Recursive Feature Elimination (RFE) can reduce the number of features by selecting the most important ones, thereby improving model performance and interpretability while reducing the risk of overfitting. The combination of RFE, SVM, and RBF effectively enhances classification capability [9].
This study chose 10-fold cross-validation to evaluate model performance, which better assesses the generalization ability of the model since k-fold validation effectively improves the validity of the SVM [10].
In this study, to extract the above features, the data underwent baseline correction and filtering. Subsequently, ERP features were extracted, and the Welch method was used to estimate the power spectral density of the averaged ERP signal to extract the power in different frequency bands (δ, θ, α, β, γ bands). These frequency bands represent different brain wave activities and can reflect various brain functional states.
In this study, the extracted features were used to train an SVM model. For each feature, the SVM model assigns a weight. Using RFE, the least important features were eliminated. Bayesian optimization was employed to select the BoxConstraint and KernelScale parameters within a logarithmic range of [1e-3, 1e3]. In each iteration, Bayesian optimization selects new parameters to train the SVM model and calculates the corresponding cross-validation loss. Through multiple iterations, Bayesian optimization gradually approaches the optimal parameter combination, eventually finding the parameters that minimize the loss.
3. Experiments and Results
Algorithms was initially built and run on macOS 13.6.9, implemented in Matlab 2018a. This study analyzed the precision, recall, F1 score, and accuracy across different folds, effectively quantifying the classification performance of the model.
In the data augmentation step, Gaussian noise with a standard deviation of 10% is added to the signals. The maximum time shift is set to 10 milliseconds. The amplitude scaling factor is set to 5%. The selected frequency domain features include the δ, θ, α, β, and γ bands. These features are calculated through power spectral density (PSD) analysis, reflecting the energy distribution of the signal within different frequency bands. The ERP time window selection ranges from 100 milliseconds before the stimulus to 500 milliseconds after the stimulus. The time window for the N100 feature is selected as 80-120 milliseconds post-stimulus, while the P300 feature time window is chosen as 250-500 milliseconds post-stimulus.
During the Bayesian optimization of parameters, the optimization range for the BoxConstraint hyperparameter is set between 0.001 and 1000. The optimization range for the KernelScale hyperparameter is also set between 0.001 and 1000. The maximum number of iterations for Bayesian optimization is set to 30. In recursive feature elimination, the top 6 most important features are selected for the final SVM model training. During k-fold cross-validation, 10-fold cross-validation is used, with 90% of the dataset utilized for training and 10% for testing.
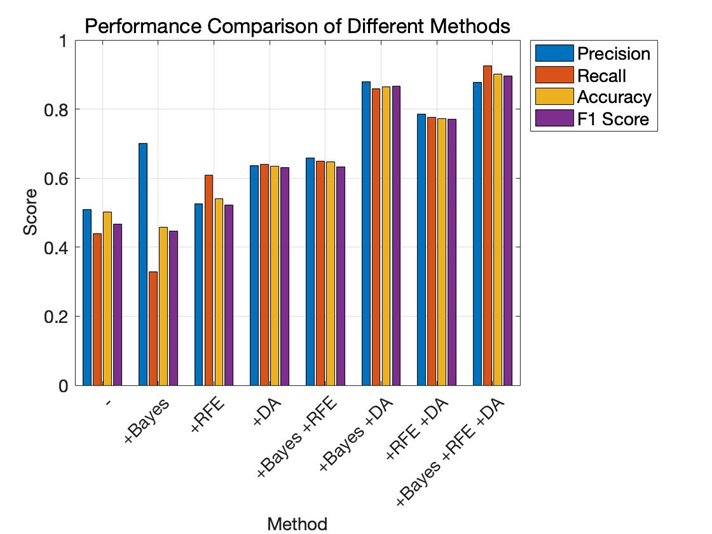
Figure 1. Performance comparison of different methods (Figure Credits: Original).
This study established an SVM model based on the frequency domain and time domain features of ERP in schizophrenia. Bayesian optimization, RFE, and data augmentation were applied to enhance the model's classification performance and accuracy. When this model was applied to the dataset, the classification error rate was 10%. The model demonstrated high classification capability and generalization ability. The small standard deviation and classification error indicate that the model can maintain good performance when facing new data, avoiding overfitting issues.
In the experiments, effectiveness of various approaches is validated, including RFE, Bayesian optimization (Bayes), data augmentation (DA). As shown in Figure 1 and Figure 2, “-” denotes the baseline model. With the addition of Bayesian optimization, RFE, and data augmentation, the classification error rate gradually decreases. At the same time, evaluation metrics such as precision, recall, accuracy, and F1 score increase with the addition of Bayesian optimization, RFE, and data augmentation. The precision is particularly high in the "+Bayesian" case, which suggests that some redundant features might have been used to train the model, and the model may have missed some actual positive samples.
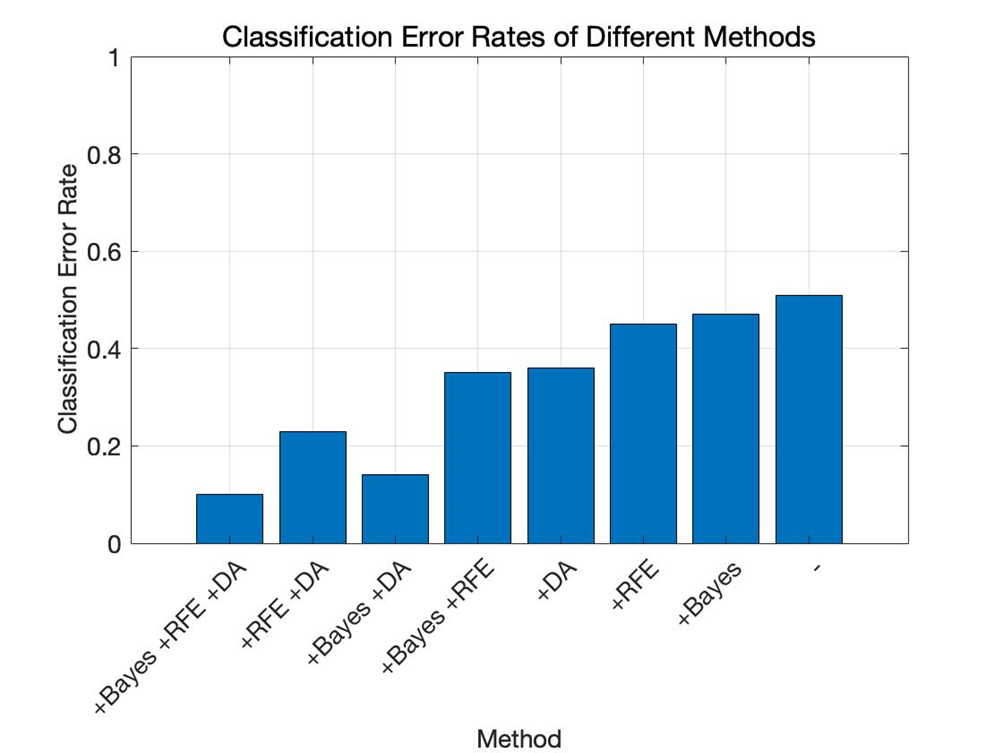
Figure 2. Classification error rate of different methods (Figure Credits: Original).
From Table 1 and Table 2, it is evident that applying Bayesian optimization, RFE, and data augmentation can significantly enhance the model's classification ability. Compared to traditional grid search or random search, Bayesian optimization can find better parameters in a shorter time. The use of RFE ensures that the model's performance is improved while reducing its complexity, making the model more efficient. Data augmentation helps the model capture more features in time series and noisy environments by adding noise, time shifts, and amplitude scaling to simulate different variations, thus improving the model's generalization ability and preventing overfitting, allowing the model to adapt better when facing new data.
Table 1. Quantitative performance comparison of different models.
Methods | Precision | Recall | Accuracy | F1 score |
Baseline | 0.5083±0.3524 | 0.4400± 0.2828 | 0.5018±0.2283 | 0.4667±0.3089 |
+Bayesian | 0.7000±0.4831 | 0.3286±0.2289 | 0.4571±0.0369 | 0.4467±0.3100 |
+RFE | 0.5250±0.2326 | 0.6079±0.2396 | 0.5411±0.1543 | 0.5214±0.1463 |
+DA | 0.6362±0.1372 | 0.6405±0.0835 | 0.6346±0.0826 | 0.6314±0.0900 |
+Bayesian + RFE | 0.6583±0.2619 | 0.6500±0.1873 | 0.6482±0.1522 | 0.6329±0.1898 |
+Bayesian + DA | 0.8791±0.0813 | 0.8582±0.0426 | 0.8651±0.0345 | 0.8656±0.0384 |
+RFE + DA | 0.7848±0.1392 | 0.7765±0.0751 | 0.7730±0.0647 | 0.7716±0.0804 |
+Bayesian + RFE + DA | 0.8767±0.1044 | 0.9247±0.0565 | 0.9020±0.0571 | 0.8966±0.0669 |
Table 2. Error rate comparison of different models.
Methods | Backbone | +Bayesian | +RFE | +DA | +Bayesian | +Bayesian +DA | +RFE +DA | +Bayesian +RFE +DA |
Error Rate | 0.51 | 0.47 | 0.45 | 0.36 | 0.35 | 0.14 | 0.23 | 0.10 |
4. Discussion
In this study, EEG data from schizophrenia patients were analyzed, and extracted certain features from the ERP, including power in the δ, θ, α, β, and γ bands, as well as the amplitude and latency of N100 and P300. RFE was used to select the six most important features, aiming to choose those that contribute most significantly to the model's performance. Bayesian optimization was then employed to minimize classification loss in k-fold cross-validation, allowing the model to perform better on new data, thus avoiding overfitting to a specific training set and enhancing the model's generalization ability. The application of Bayesian optimization, recursive feature elimination, and data augmentation significantly reduced the model's classification error rate while improving its generality and performance.
Due to the small dataset, the trained model may not be sufficiently accurate. However, the use of data augmentation significantly enhanced the model's capabilities and performance. The application of selected features resulted in a lower classification error rate, confirming that N100, P300, and the δ, θ, α, β, and γ frequency bands are effective features for distinguishing between schizophrenia patients and healthy individuals.
Despite the success of this algorithm, there are still some issues. Although Bayesian optimization is very effective in hyperparameter tuning, it requires more computational resources and considerable time when dealing with high-dimensional, large datasets. This time is spent searching for optimal parameters. The optimal values found by Bayesian optimization may differ on different datasets, meaning the model may need to be retuned for different application scenarios. RFE also shares this problem. While data augmentation can improve the model's generalization ability to some extent, it may also introduce unwanted samples, potentially leading to reduced performance when applying the model to different datasets, depending on the dataset type and application scenario. The model's performance may fluctuate significantly across different datasets, and if the characteristics of the dataset change, the model's performance may decline substantially, indicating potential robustness issues with the algorithm.
Future improvements to this study could include increasing the diversity of data by using different devices or collecting data under varying conditions to enhance the model's generalization ability. Additionally, different time-frequency analysis techniques or nonlinear feature extraction methods could be applied to capture more complex features within the signals. Other models, such as random forest, gradient boosting machine, or deep neural networks, could also be explored. In deep learning, optimized sparse Bayesian learning frameworks could further decode brain activity [11]. Furthermore, EEG microstate features, combined with traditional EEG features, have shown better classification performance than using traditional EEG features alone, making them a promising avenue for diagnosing and analyzing schizophrenia [12].
5. Conclusion
In this study, a SVM was employed to classify signals, extracting features such as the amplitude and latency of N100 and P300, as well as power features within the frequency domain. The data was augmented, and RFE along with Bayesian optimization were applied to optimize the SVM model’s feature set and hyperparameters. Bayesian optimization identified the best parameter combination by adjusting hyperparameters, while RFE reduced model complexity by selecting the most relevant features, thus enhancing interpretability and performance. Data augmentation increased the diversity of the data, preventing overfitting and improving the model's generalization capability. As a result, the full model demonstrated excellent performance in terms of precision, recall, accuracy, and F1 score, achieving an average accuracy of 0.90195±0.0571. Bayesian optimization and RFE significantly improved SVM model performance, while data augmentation enhanced its generalization ability. Future work could involve incorporating more features, using larger datasets, applying more suitable analysis techniques, and optimizing computational efficiency to further improve the model's performance and application scope.
References
[1]. Wee, Z. Y., Yong, S. W. L., Chew, Q. H., Guan, C., Lee, T. S., & Sim, K. (2019). Actigraphy studies and clinical and biobehavioural correlates in schizophrenia: a systematic review. Journal of Neural Transmission, 126, 531-558.
[2]. Barros, C., Silva, C. A., & Pinheiro, A. P. (2021). Advanced EEG-based learning approaches to predict schizophrenia: Promises and pitfalls. Artificial intelligence in medicine, 114, 102039.
[3]. Onitsuka, T., Hirano, Y., Nakazawa, T., Ichihashi, K., Miura, K., Inada, K., et, al. (2022). Toward recovery in schizophrenia: current concepts, findings, and future research directions. Psychiatry and clinical neurosciences, 76(7), 282-291.
[4]. Ford, J. M., Palzes, V. A., Roach, B. J., & Mathalon, D. H. (2014). Did I do that? Abnormal predictive processes in schizophrenia when button pressing to deliver a tone. Schizophrenia bulletin, 40(4), 804-812.
[5]. Jang, K. I., Kim, S., Kim, S. Y., Lee, C., & Chae, J. H. (2021). Machine learning-based electroencephalographic phenotypes of schizophrenia and major depressive disorder. Frontiers in Psychiatry, 12, 745458.
[6]. Hosseini, M. P., Hosseini, A., & Ahi, K. (2020). A review on machine learning for EEG signal processing in bioengineering. IEEE reviews in biomedical engineering, 14, 204-218.
[7]. Keihani, A., Sajadi, S. S., Hasani, M., & Ferrarelli, F. (2022). Bayesian optimization of machine learning classification of resting-state EEG microstates in schizophrenia: a proof-of-concept preliminary study based on secondary analysis. Brain Sciences, 12(11), 1497.
[8]. Elshewey, A. M., Shams, M. Y., El-Rashidy, N., Elhady, A. M., Shohieb, S. M., & Tarek, Z. (2023). Bayesian optimization with support vector machine model for parkinson disease classification. Sensors, 23(4), 2085.
[9]. Liu, Q., Chen, C., Zhang, Y., & Hu, Z. (2011). Feature selection for support vector machines with RBF kernel. Artificial Intelligence Review, 36(2), 99-115.
[10]. Yao, X. (2022). Application of Optimized SVM in Sample Classification. International Journal of Advanced Computer Science and Applications, 13(6), 540-547.
[11]. Wang, W., Qi, F., Wipf, D. P., Cai, C., Yu, T., et, al. (2023). Sparse Bayesian learning for end-to-end EEG decoding. IEEE Transactions on Pattern Analysis and Machine Intelligence, 45(12), 15632-15649.
[12]. Kim, K., Duc, N. T., Choi, M., & Lee, B. (2021). EEG microstate features for schizophrenia classification. PloS one, 16(5), e0251842.
Cite this article
Liu,X. (2024). Machine learning-based EEG analysis for enhanced schizophrenia classification and diagnosis. Applied and Computational Engineering,101,256-262.
Data availability
The datasets used and/or analyzed during the current study will be available from the authors upon reasonable request.
Disclaimer/Publisher's Note
The statements, opinions and data contained in all publications are solely those of the individual author(s) and contributor(s) and not of EWA Publishing and/or the editor(s). EWA Publishing and/or the editor(s) disclaim responsibility for any injury to people or property resulting from any ideas, methods, instructions or products referred to in the content.
About volume
Volume title: Proceedings of the 2nd International Conference on Machine Learning and Automation
© 2024 by the author(s). Licensee EWA Publishing, Oxford, UK. This article is an open access article distributed under the terms and
conditions of the Creative Commons Attribution (CC BY) license. Authors who
publish this series agree to the following terms:
1. Authors retain copyright and grant the series right of first publication with the work simultaneously licensed under a Creative Commons
Attribution License that allows others to share the work with an acknowledgment of the work's authorship and initial publication in this
series.
2. Authors are able to enter into separate, additional contractual arrangements for the non-exclusive distribution of the series's published
version of the work (e.g., post it to an institutional repository or publish it in a book), with an acknowledgment of its initial
publication in this series.
3. Authors are permitted and encouraged to post their work online (e.g., in institutional repositories or on their website) prior to and
during the submission process, as it can lead to productive exchanges, as well as earlier and greater citation of published work (See
Open access policy for details).
References
[1]. Wee, Z. Y., Yong, S. W. L., Chew, Q. H., Guan, C., Lee, T. S., & Sim, K. (2019). Actigraphy studies and clinical and biobehavioural correlates in schizophrenia: a systematic review. Journal of Neural Transmission, 126, 531-558.
[2]. Barros, C., Silva, C. A., & Pinheiro, A. P. (2021). Advanced EEG-based learning approaches to predict schizophrenia: Promises and pitfalls. Artificial intelligence in medicine, 114, 102039.
[3]. Onitsuka, T., Hirano, Y., Nakazawa, T., Ichihashi, K., Miura, K., Inada, K., et, al. (2022). Toward recovery in schizophrenia: current concepts, findings, and future research directions. Psychiatry and clinical neurosciences, 76(7), 282-291.
[4]. Ford, J. M., Palzes, V. A., Roach, B. J., & Mathalon, D. H. (2014). Did I do that? Abnormal predictive processes in schizophrenia when button pressing to deliver a tone. Schizophrenia bulletin, 40(4), 804-812.
[5]. Jang, K. I., Kim, S., Kim, S. Y., Lee, C., & Chae, J. H. (2021). Machine learning-based electroencephalographic phenotypes of schizophrenia and major depressive disorder. Frontiers in Psychiatry, 12, 745458.
[6]. Hosseini, M. P., Hosseini, A., & Ahi, K. (2020). A review on machine learning for EEG signal processing in bioengineering. IEEE reviews in biomedical engineering, 14, 204-218.
[7]. Keihani, A., Sajadi, S. S., Hasani, M., & Ferrarelli, F. (2022). Bayesian optimization of machine learning classification of resting-state EEG microstates in schizophrenia: a proof-of-concept preliminary study based on secondary analysis. Brain Sciences, 12(11), 1497.
[8]. Elshewey, A. M., Shams, M. Y., El-Rashidy, N., Elhady, A. M., Shohieb, S. M., & Tarek, Z. (2023). Bayesian optimization with support vector machine model for parkinson disease classification. Sensors, 23(4), 2085.
[9]. Liu, Q., Chen, C., Zhang, Y., & Hu, Z. (2011). Feature selection for support vector machines with RBF kernel. Artificial Intelligence Review, 36(2), 99-115.
[10]. Yao, X. (2022). Application of Optimized SVM in Sample Classification. International Journal of Advanced Computer Science and Applications, 13(6), 540-547.
[11]. Wang, W., Qi, F., Wipf, D. P., Cai, C., Yu, T., et, al. (2023). Sparse Bayesian learning for end-to-end EEG decoding. IEEE Transactions on Pattern Analysis and Machine Intelligence, 45(12), 15632-15649.
[12]. Kim, K., Duc, N. T., Choi, M., & Lee, B. (2021). EEG microstate features for schizophrenia classification. PloS one, 16(5), e0251842.