


1. Introduction
Lane line detection is an important basic module in automatic driving. Based on the influence of different road environment, vehicle occlusion, camera position and other objective factors, as well as the flat shape of the lane line itself, it brings challenges to the task of lane line detection. Based on the above characteristics, it is necessary to have strong recognition ability, running speed and context recognition ability to adapt to complex environmental needs. These methods often lack understanding of the overall structure and context of the lane, limiting their performance in complex scenarios.
In traditional lane detection techniques, the first step is to identify key areas through image processing techniques such as filtering and noise reduction. Custom-designed feature extraction algorithms are then used to capture the details of lane edges. By fitting these features with curves, the outline of the lane is reconstructed [1]. As proposed by Borkar A et al., a lane detection technique has been developed that accurately tracks lane markings and optimizes parameters through inverse perspective transformation, threshold segmentation, Hough transform, RANSAC fitting, and Kalman filtering [2]. However, such traditional methods perform poorly under conditions of changing light, adverse weather, or unclear road markings. Furthermore, they are typically computationally intensive, making it difficult to meet real-time requirements. To address the issue of poor performance in complex environments, Ke [3] utilizes the Sobel operator and sliding window to detect lane lines, transforming yellow and white lane lines in complex environment. Recently, Lucas Tabelini [4] and his team have introduced a new method that redefines the lane detection task through polynomial regression, enhancing processing efficiency. However, this method, due to its failure to fully consider the global contextual information, still has room for improvement in accuracy compared to other techniques.
To enhance the accuracy and efficiency of lane detection, this study proposes a novel hybrid model architecture that combines the strengths of Graph Neural Networks (GNNs) and Transformers. In the new architecture, the model takes structured road data as input. The framework defines the output of lane detection as parameters of the lane shape model, such as the camera pitch angle and the overall lane structure. It utilizes GNNs to process the input graph-structured data, capturing the connections between nodes and the geometric properties of the road. Introducing the Transformer architecture to process sequence data related to lane detection allows the model to learn more general feature representations by sharing parameters between GNNs and Transformers, thereby enhancing its generalization capabilities. End-to-end training is conducted with Hungarian loss. Experiments are conducted using samples from different weather environments to ensure the adaptability of the model for various scenarios.
2. Research Method
2.1. Overall Framework
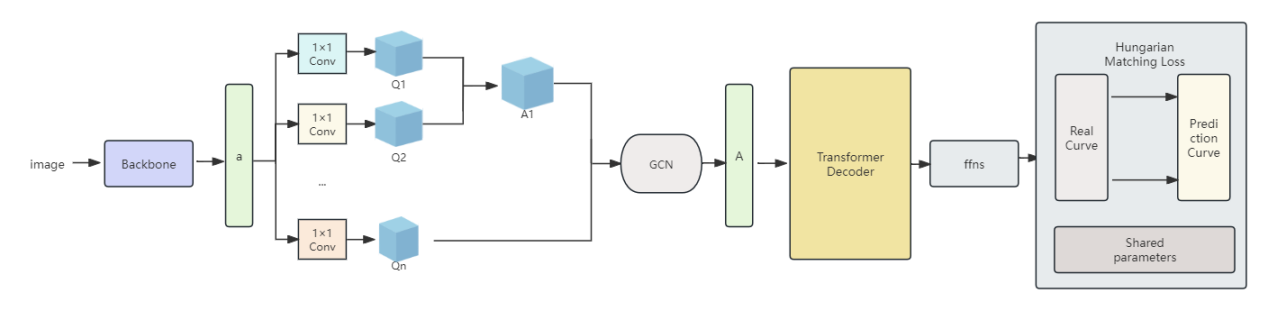
Figure 1. The basic framework diagram of the algorithm.
As shown in Figure 1, the basic framework of this algorithm is illustrated. Backbone: In constructing our network architecture, the paper adopted an optimized version of ResNet18 as our main feature extraction backbone [5]. To adapt to the lane detection task and reduce the risk of over-fitting, the paper adjusted this architecture by reducing the number of channels and the sampling rate. The aim is to preserve the key structural features of lanes while minimizing unnecessary details, thereby optimizing computational efficiency. Then, the subsequent constructed sequence is used as input to the encoder.
Encoder: Using the powerful ability of Graph Transformer Networks (GTNs) in processing structured data, integrate GTNs into the encoding layer to capture multi-dimensional relationships in data more effectively. This study uses the GCN [6]and HAN [7] as GNN based methods. GTNs learn meta-paths for given data and tasks and operate graph convolution on the learned meta-path graphs.
The first layer of this GTNs is the adjacency matrix in the set of gt layer softmax image matrix. A new meta-path graph A1 is obtained by matrix multiplication of the selected adjacency matrices Q1 and Q2 [8]. The adjacency matrix is derived from this formula
\( Q=F(A;{W_{φ}})=φ(A;softmax({W_{φ}})) \) (1)
That is to get the weighted sum of non-negative weights of the matrix through 1*1 convolution, and then stack multiple layers to further abstract and integrate node features. Using the softmax function to normalize it can meet the requirements of the probability distribution of the output, and also provide an effective numerical stability to avoid gradient disappearance or gradient explosion problems when dealing with large or small values. Multiple node representations from the same GCNs on multiple meta-path graphs are integrated by concatenation and improve the performance of node classification and it is beneficial to learn different node representations via multiple different graph structures [5].
FFNs (Feed-Forward Networks) and Hungarian Fitting Loss:
Employing Hungarian loss for bipartite matching between predicted parameters and actual lanes, and further optimizing the data using the matching results.
2.2. Adjusting the Learning Rate Dynamically
This study employs a cosine annealing strategy, which starts with a high learning rate and then gradually reduces this rate through multiple cycles of cosine function adjustments. This method generates a learning rate curve that appears exceptionally smooth, with the curve starting at a higher learning rate level and gradually approaching zero. Such a learning rate scheduling mechanism not only promotes rapid convergence of the model but also helps to enhance the model's generalization ability.
\( {η_{max}} \) = \( {η_{min}}+\frac{1}{2}({η_{max}}-{η_{min}})(1+cos{(\frac{{T_{cur}}}{{T_{i}}})π}) \) (2)
When \( {T_{cur}}={T_{i}}; set{η_{t}}={η_{min}}. \) When \( {T_{cur}}=0 set{ η_{t}}={η_{max}} \) initialize the current temperature \( {T_{cur}} \) to a predetermined value of T, at which point the algorithm starts and randomly adjusts the temperature to reach its lowest value. As the algorithm progresses, the temperature \( { T_{cur}} \) begins to decrease gradually following the pattern of a cosine function, ensuring that the learning rate can fluctuate within a reasonable range.
Restart Strategy: When \( {T_{cur}} \) drops to zero, it indicates that the algorithm will perform a restart. In this restart process, the paper set \( η \) to its maximum value \( {η_{max}} \) to ensure that the model can have different learning rates at various training stages, thereby avoiding getting stuck in local minimum value in this new cycle. Although the adjustment of the learning rate still follows the pattern of a cosine function, due to the resetting of \( η \) to \( {η_{max}} \) at the restart and this effectively provides the model with a "fresh" starting point, allowing the model to undertake further learning tasks. As the cycles continue to repeat, the model's understanding of the data gradually deepens, and its generalization ability steadily improves. If a model performs exceptionally well within a certain cycle, then the length of that cycle can be appropriately extended to allow the model to utilize the current learning rate more fully for training; conversely, if the model becomes stuck or performs poorly, then the cycle can be restarted prematurely, and adjustments can be made to the rate or magnitude of the learning rate decrease, in hopes of achieving better training results in the new cycle. This strategy not only helps the model converge to the optimal solution more quickly but also enhances the model's generalization ability, allowing it to demonstrate better stability and robustness when facing unknown data.
2.3. Hungarian Matching
In this collection, each curve is labeled with a binary tag indicating whether it represents a lane or not. The lane prediction is represented as \( H=\lbrace {h_{i}}|{h_{i}}=({c_{i}},{g_{i}})\rbrace _{i=1}^{N} \) , where N is set to a relatively large value that exceeds the number of lanes in the existing samples. Each element \( {h_{i}} \) represents a possible lane or non-lane. Meanwhile, the paper constructed a real-world sequence of lane markings that encompasses all observed lanes in a specific scenario, represented as \( L=\lbrace {\hat{l}_{i}}|{\hat{l}_{i}}=({\hat{c}_{i}},{\hat{s}_{i}})\rbrace _{i=1}^{N} \) . Since the size of the predicted set may be larger than the actual number of lanes, the paper expands the real lane markings to the same length, filling the unoccupied positions with non-lane labels. Next, the paper defines an optimization problem aimed at finding an optimal mapping function z, which establishes a one-to-one correspondence between the set of predicted curves and the augmented set of real lane markings. By minimizing the cost of this mapping, the paper can ensure that each real lane achieves the best possible match with its predicted counterpart.z(i) represents the most suitable measurement curve for the actual vehicle i.
\( \hat{z}={arg_{z}}min\sum _{i=1}^{N}d(\hat{{l_{i}}},{h_{z(i)}}) \) (3)
This process transforms the lane detection problem into a bipartite graph matching problem. By solving this minimization problem, the paper is able to precisely match the predicted curves with the actual lanes, thereby significantly enhancing the accuracy of lane detection [9]. Hungarian loss [10] for all pairs matched in the previous step. Referring to the method of Nicolas Carion [10] and others,this study define the loss similarly to the losses of common object detectors:
\( L=\sum _{i=1}^{N}-{ω_{1}}{log_{{P_{\hat{z}(i)}}}}{({\hat{c}_{i}})}+ ({\hat{c}_{i}}=1){ω_{2}}{L_{1}}({\hat{s}_{i}},{s_{\hat{z}(i)}})+({\hat{c}_{i}}=1){ω_{3}}{L_{1}}({\hat{α}_{i}},{α_{\hat{z}(i)}},{\hat{β}_{i}},{β_{\hat{z}(i)}}) \) (4)
2.4. Lane Shape Model
This formula is used to represent a single-lane line on approximately flat ground:
X \( =k{Z_{3}}+m{Z_{2}}+nZ+b \) (5)
Where k, m, n, and b are real number parameters, and (X, Z) represents a point on the horizontal plane.
For an oblique camera with an angle \( φ \) to the ground, the curve of the inclined image plane is
\( {u^{ \prime }}=\frac{{k^{ \prime }}×{cos^{2}}{φ}}{{({v^{ \prime }}-fsin{φ})^{2}}}+\frac{{m^{ \prime }}cos{φ}}{({v^{ \prime }}-fsin{φ})}+{n^{ \prime }}+\frac{{b^{ \prime }}×{v^{ \prime }}}{cos{φ}}-{b^{ \prime }}×ftan{φ} \) (6)
Here, f is the focal length measured in pixels, and \( ({u^{ \prime }},{v^{ \prime }}) \) are the corresponding high-frequency transformed positions [9]. By combining the parameters with the pitch angle \( φ \) , the form of the curve in the tilted camera plane is given by:
\( {u^{ \prime }}=\frac{{k^{ \prime \prime }}}{{(v \prime -{f^{ \prime \prime }})^{2}}}+\frac{{m^{ \prime \prime }}}{({v^{ \prime }}-{f^{ \prime \prime }})}+{n^{ \prime }}+{b^{ \prime \prime }}×{v^{ \prime }}-{b^{ \prime \prime \prime }} \) (7)
In almost all scenarios, the lanes are of a thin and elongated shape. Therefore, the k, n, m, and f parameters are shared across all scenarios [11]. Thus, the parameters output by the t-th lane are:
\( {g_{t}}=({k^{ \prime \prime }},{f^{ \prime \prime }},{m^{ \prime \prime }},{n^{ \prime }},b_{t}^{ \prime \prime },b_{t}^{ \prime \prime \prime },{α_{t}},{β_{t}}) \) (8)
3. Experiments Results
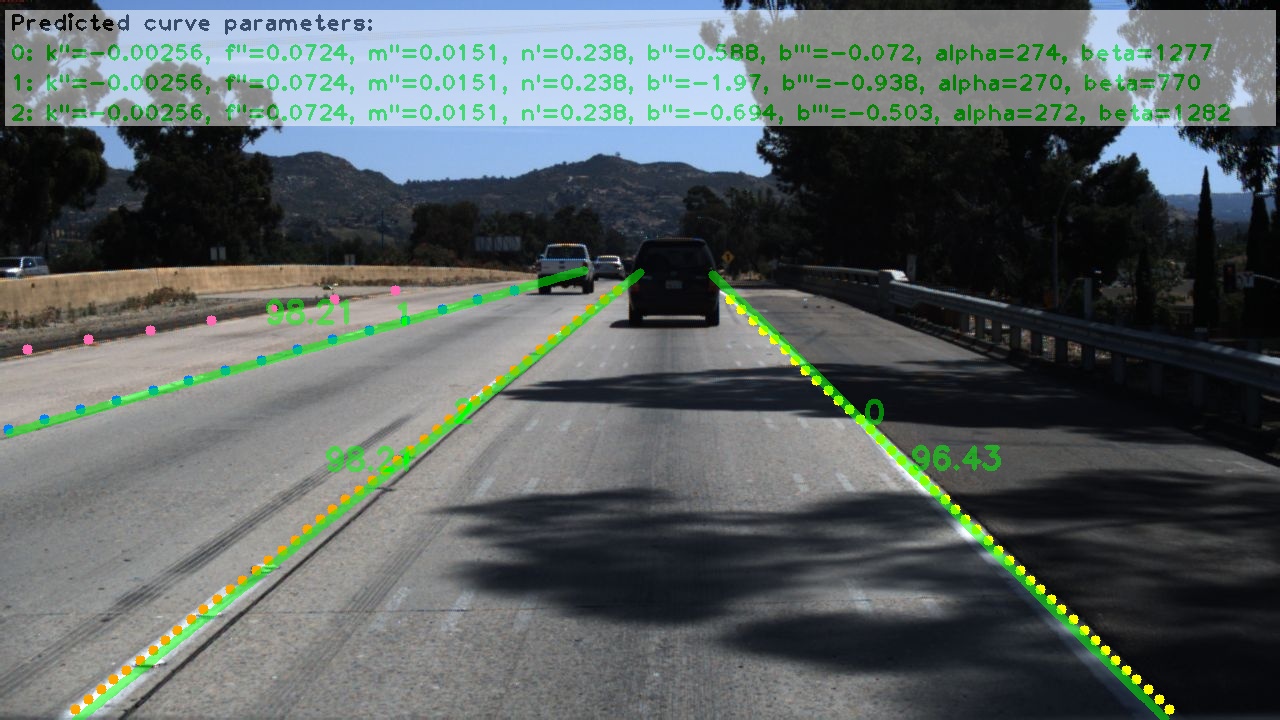
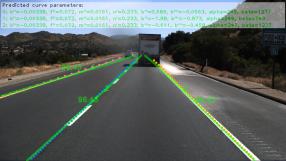
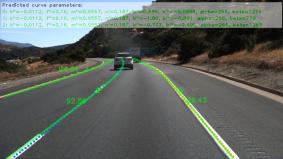
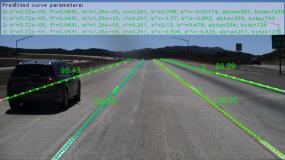
Figure 2. Visualization of predictions on the Tusimple dataset.
As shown in Figure 2, the visualization results of this study on the Tusimple data set. At the coding level, the application of gtns demonstrates its evident advantages: these images are exactly the results our model has derived after a series of complex calculations. In more complex environmental conditions, the model is able to accurately calculate various parameters of the curve, such as curvature, rate of change, second-order curvature, third-order curvature, etc.
Table 1. Comparison with current advanced methods on the Tusimple data set.
Method | fps | FP | FN | Acc |
SCNN | 7 | .0617 | .0180 | 96.53 |
PINet | 30 | .0294 | .0263 | 96.70 |
FastDraw | 90 | .0760 | .0450 | 95.20 |
This study | 420 | .0293 | .0402 | 96.21 |
As shown in Table 1, the results obtained by comparing this study with currently popular methods. At the coding level, the application of gtns demonstrates its evident advantages: these images are exactly the results our model has derived after a series of complex calculations. In more complex environmental conditions, the model is able to accurately calculate various parameters of the curve, such as curvature, rate of change, second-order curvature, third-order curvature, etc.
In the table, the paper uses the Tusimple metric to evaluate the accuracy of various methods. Data shows that this method performs the best in terms of speed, while still maintaining a high level of accuracy. Despite some minor compromises in error rate, this does not affect its effectiveness in practical applications.
Compared to the FastDraw method, our method has improved accuracy by about 1%. More importantly, compared to other two-stage methods, this approach achieves competitive accuracy with fewer parameters and faster speed, as well as the lowest false detection and missed detection rates.
4. Conclusion
The lane detection algorithm proposed in this study, based on GTNs, achieves efficient and accurate detection of lane lines by integrating the strengths of graph neural networks and the Transformer architecture. The experimental results demonstrate that the algorithm can stably output key parameters of the lane shape model, such as curvature and rate of change, under various weather conditions, providing robust technical support for the lane departure warning and adaptive cruise control functions of autonomous vehicle systems. Although algorithms perform well in lane detection tasks, their accuracy can be compromised under extreme weather conditions or when roads are severely worn, requiring further optimization to enhance robustness in complex conditions. Looking forward, it is possible to explore the integration of lane detection algorithms with other autonomous driving functionalities more closely.
References
[1]. Zhang, Y. (2023). Research on Lane Detection Algorithm based on Convolutional Nural Network. Beijing Jiaotong University.
[2]. Borkar, A., Hayes, M., Smith, M. T. (2011). A novel lane detection system with efficient ground truth generation. IEEE Transactions on Intelligent Transportation Systems, 13(1): 365-374.
[3]. Ke, H. (2021). Research on Lane Line Detection and Tracking under Complex Road Conditions. Frontiers in Science and Engineering, 1(3): 162-165.
[4]. Lucas, T., Rodrigo, B., Thiago, M., Paixao C. B., Alberto, F., De, S., and Thiago, O. S. (2010). Keep your Eyes on the Lane: Real-time Attention-guided Lane Detection. IEEE, Conference on Computer Vision and Pattern Recognition (CVPR).
[5]. He, K. M., Zhang, X. Y., Ren, S. Q., and Sun, J. (2016). Deep Residual Learning for Image Recognition. In Conference on Computer Vision and Pattern Recognition (CVPR).
[6]. Kipf, T. N., and Welling, M. (2017). Semi-supervised classification with graph convolutional networks. In International Conference on Learning Representations (ICLR).
[7]. Wang, X., Ji, H., Shi, C., Wang, B., Cui, P., Yu, P., and Ye, Y. (2019). Heterogeneous graph attention network. CoRR, abs/1903.07293.
[8]. Seongjun, Y., Minbyul, J., Raehyun, K., Jaewoo, K., and Hyunwoo, J. K. (2019). Graph Transformer Networks. Neural Information Processing Systems (NeurIPS).
[9]. Liu, R. J., Yuan, Z. J., Liu, T., and Xiong, Z. L. (2020). End-to-end Lane Shape Prediction with Transformers. Computer Vision and Pattern Recognition (cs.CV).
[10]. Nicolas, C., Francisco, M., Gabriel, S., Nicolas, U., Alexander, K., and Sergey, Z. (2020). End-to-End Object Detection with Transformers. Computer Vision and Pattern Recognition (cs.CV).
[11]. Ilya, L., Frank, H. (2016). SGDR: STOCHASTIC GRADIENT DESCENT WITH WARM RESTARTS. ICLR 2017 conference paper.
Cite this article
Wei,Z. (2024). Research on lane detection algorithms based on GTNs. Applied and Computational Engineering,103,33-38.
Data availability
The datasets used and/or analyzed during the current study will be available from the authors upon reasonable request.
Disclaimer/Publisher's Note
The statements, opinions and data contained in all publications are solely those of the individual author(s) and contributor(s) and not of EWA Publishing and/or the editor(s). EWA Publishing and/or the editor(s) disclaim responsibility for any injury to people or property resulting from any ideas, methods, instructions or products referred to in the content.
About volume
Volume title: Proceedings of the 2nd International Conference on Machine Learning and Automation
© 2024 by the author(s). Licensee EWA Publishing, Oxford, UK. This article is an open access article distributed under the terms and
conditions of the Creative Commons Attribution (CC BY) license. Authors who
publish this series agree to the following terms:
1. Authors retain copyright and grant the series right of first publication with the work simultaneously licensed under a Creative Commons
Attribution License that allows others to share the work with an acknowledgment of the work's authorship and initial publication in this
series.
2. Authors are able to enter into separate, additional contractual arrangements for the non-exclusive distribution of the series's published
version of the work (e.g., post it to an institutional repository or publish it in a book), with an acknowledgment of its initial
publication in this series.
3. Authors are permitted and encouraged to post their work online (e.g., in institutional repositories or on their website) prior to and
during the submission process, as it can lead to productive exchanges, as well as earlier and greater citation of published work (See
Open access policy for details).
References
[1]. Zhang, Y. (2023). Research on Lane Detection Algorithm based on Convolutional Nural Network. Beijing Jiaotong University.
[2]. Borkar, A., Hayes, M., Smith, M. T. (2011). A novel lane detection system with efficient ground truth generation. IEEE Transactions on Intelligent Transportation Systems, 13(1): 365-374.
[3]. Ke, H. (2021). Research on Lane Line Detection and Tracking under Complex Road Conditions. Frontiers in Science and Engineering, 1(3): 162-165.
[4]. Lucas, T., Rodrigo, B., Thiago, M., Paixao C. B., Alberto, F., De, S., and Thiago, O. S. (2010). Keep your Eyes on the Lane: Real-time Attention-guided Lane Detection. IEEE, Conference on Computer Vision and Pattern Recognition (CVPR).
[5]. He, K. M., Zhang, X. Y., Ren, S. Q., and Sun, J. (2016). Deep Residual Learning for Image Recognition. In Conference on Computer Vision and Pattern Recognition (CVPR).
[6]. Kipf, T. N., and Welling, M. (2017). Semi-supervised classification with graph convolutional networks. In International Conference on Learning Representations (ICLR).
[7]. Wang, X., Ji, H., Shi, C., Wang, B., Cui, P., Yu, P., and Ye, Y. (2019). Heterogeneous graph attention network. CoRR, abs/1903.07293.
[8]. Seongjun, Y., Minbyul, J., Raehyun, K., Jaewoo, K., and Hyunwoo, J. K. (2019). Graph Transformer Networks. Neural Information Processing Systems (NeurIPS).
[9]. Liu, R. J., Yuan, Z. J., Liu, T., and Xiong, Z. L. (2020). End-to-end Lane Shape Prediction with Transformers. Computer Vision and Pattern Recognition (cs.CV).
[10]. Nicolas, C., Francisco, M., Gabriel, S., Nicolas, U., Alexander, K., and Sergey, Z. (2020). End-to-End Object Detection with Transformers. Computer Vision and Pattern Recognition (cs.CV).
[11]. Ilya, L., Frank, H. (2016). SGDR: STOCHASTIC GRADIENT DESCENT WITH WARM RESTARTS. ICLR 2017 conference paper.