


1. Introduction
With the rapid development of data technology worldwide, traditional investment strategies are gradually being replaced by modern algorithms. These algorithms are able to efficiently analyze data and optimize investment decisions in real-time to remain competitive in the dynamic and ever-changing financial markets. In this context, multi-armed slot machine algorithms such as Upper Confidence Bound (UCB) and Thompson Sampling (TS) have been widely used in a variety of domains such as Internet search, online shopping recommendations, and sports betting due to their ability to handle uncertainty and adaptability. This study applies UCB and TS to long-term stock investments, using data from companies like Apple and Amazon. By analyzing weekly stock returns from 2019 to 2024, the research aims to assess how these algorithms can optimize portfolio strategies under various market conditions. The goal is to provide valuable insights into maximizing long-term returns while managing investment risks.
2. Literature Review
Zhu et al. explored the application of TS to portfolio management, framing the portfolio selection problem as a multi-armed bandit challenge. They introduced a dynamic portfolio strategy that adapts to varying market conditions by treating classic portfolio strategies as strategic arms. The study emphasized the balance between exploration and exploitation to optimize long-term investment returns, incorporating a novel reward function based on user-specific investment risk preferences. Their empirical results demonstrated the effectiveness of this approach across different real-world market datasets, highlighting its potential in achieving superior performance in portfolio management [1]. Ciucanu et al. explored the challenge of secure best-arm identification in multi-armed bandit problems, focusing on privacy concerns in outsourced data and computation environments. They proposed a distributed protocol that ensures no single cloud node can learn both the rewards and the ranking of arms, which is crucial in maintaining the confidentiality of investment strategies when applying multi-armed bandit algorithms like UCB and TS in portfolio management. Their work highlights the importance of secure algorithms in investment contexts, where the need to protect sensitive financial data aligns with optimizing long-term investment strategies using these bandit methods [2]. Bouneffouf and Rish provided an overview of the practical applications of Multi-Armed Bandit (MAB) and Contextual Bandit (CMAB) algorithms across various fields, particularly in finance and investment. They emphasized the potential of these algorithms in handling uncertainty and making long-term decisions, highlighting that the balance between exploration and exploitation is crucial for optimizing long-term investment strategies. By analyzing the latest research, the authors demonstrated how these algorithms can be applied to complex financial problems, such as portfolio optimization, offering effective tools and methods for long-term investments [3]. Dai et al. introduced a novel approach to federated Bayesian optimization using Thompson Sampling, aimed at optimizing expensive-to-evaluate black-box functions in a distributed manner [4]. The study addressed key challenges in federated learning, such as communication efficiency and agent heterogeneity, by employing random Fourier features to approximate the Gaussian process surrogate model. This method reduces the number of parameters exchanged between agents, enhancing both computational and communication efficiency. The theoretical convergence guarantee provided by this approach demonstrates its robustness in scenarios where agents have heterogeneous objectives, making it particularly relevant for financial portfolio management. In the context of long-term investment strategies, the federated TS framework offers a powerful tool for optimizing investment portfolios across different markets or sectors while preserving data privacy, which is critical in collaborative financial environments. Garbar explored the batch version of the UCB strategy, demonstrating its ability to minimize regret in multi-armed bandit settings, which can be applied to improve decision-making in batch investment strategies [5]. Mauersberger proposed TS as a model for endogenous random behavior in games and markets, indicating its potential for dynamic investment strategies where agents update their beliefs based on Bayesian inference and optimize their actions accordingly [6]. Liu and Ročková developed the Thompson Variable Selection (TVS) framework, which applies the principles of TS to high-dimensional variable selection in machine learning. By framing variable selection as a combinatorial multi-armed bandit problem, this approach provides a powerful tool for optimizing decision-making under uncertainty, a key challenge in long-term investment strategies. The TVS method is particularly relevant for financial portfolio management, where identifying the most promising investment options from a vast set of possibilities is crucial. The algorithm’s ability to efficiently handle large datasets and adapt to non-linear models makes it a valuable asset in constructing robust, data-driven investment portfolios, reducing the risk of suboptimal asset allocation and enhancing long-term returns [7]. Li et al. explored the lead-lag effect in stock markets, defining the phenomenon and proposing detection methods, which were then integrated into alpha-factor strategies to enhance their profitability, providing effective signals for designing profitable investment strategies [8]. Millea and Edalat devised a hierarchical decision-making architecture using deep reinforcement learning combined with hierarchical risk parity for portfolio optimization, showcasing the robustness and adaptability of this approach in various markets, including cryptocurrencies, stocks, and foreign exchange [9]. Ghatrani and Ghate studied percentile optimization in multi-armed bandit problems with multivariate Gaussian rewards, demonstrating that optimizing the percentile of reward distributions can enhance decision-making in dynamic programming and investment strategies [10]. Wu provides a comprehensive analysis of the evolution and application of Multi-Armed Bandit (MAB) models across various fields, including finance, online advertising, and clinical trials. The paper traces the historical development of MAB problems from their origins in the gambling domain to their modern-day applications in machine learning and artificial intelligence. The study highlights key advancements, such as the development of Upper Confidence Bound (UCB) and TS algorithms, which have significantly contributed to the practical use of MAB models in dynamic and uncertain environments. Wu also explores the integration of MAB algorithms with reinforcement learning, emphasizing their role in optimizing decision-making under uncertainty, which is particularly relevant in financial market trading where adaptive strategies are crucial for maximizing returns. The paper discusses recent advancements in MAB, such as Contextual Bandits and Multi-agent Bandits, and their potential to further enhance the flexibility and robustness of investment strategies [11].
While significant progress has been made in the application of UCB and TS algorithms to various financial and investment problems, several gaps remain. Most notably, existing studies often focus on portfolio management or short-term investment returns without offering a comprehensive analysis of these algorithms' performance in long-term investing. Furthermore, while exploration-exploitation strategies have been well-documented, the comparative effectiveness of UCB and TS in navigating the volatility and uncertainty of stock markets over extended periods is still underexplored. This study aims to fill this gap by empirically comparing UCB and TS algorithms in the context of long-term investing. Unlike previous works, which either focus on specific portfolio strategies or short-term gains, this research will provide a detailed analysis of how these algorithms adapt to varying levels of market volatility and uncertainty in the long run. By using historical stock data and simulating long-term investment scenarios, this study will highlight both the strengths and weaknesses of UCB and TS in terms of profitability and adaptability, offering specific guidance to investors on optimizing their long-term decisions. The novelty of this research lies in its focus on long-term financial investment strategies, providing a fresh perspective on algorithmic performance in volatile and uncertain markets.
3. Methodology
3.1. Experimental Design
This section outlines the experimental framework used to evaluate the effectiveness of UCB and TS algorithms in optimizing long-term stock investment strategies. The experiment focuses on the selection of data sources, preprocessing steps, algorithm application, and the metrics used to assess performance. Through this systematic approach, the study aims to provide insights into how these algorithms can enhance decision-making in volatile market conditions.
3.1.1. Purpose of the experiment
The main objective of this experiment is to optimize long-term stock investment strategies by applying the Upper Confidence Bound (UCB) and TS (TS) algorithms in the framework of a multi-armed gambling machine problem. The experiment aims to evaluate the performance of these two algorithms under different market volatility conditions, thus providing investors with assistance in making more informed and strategic decisions in long-term investments.
3.1.2. Data Sources
Stock price data of Apple Inc (AAPL) and Amazon.com Inc (AMZN) during the last five years were selected for this study. The data was obtained from Yahoo Finance, which was selected for its ability to represent stock market performance and its comprehensive historical data. To facilitate the analysis and ensure the data's relevance to long-term trends, daily stock price data was converted to weekly settlement data. This conversion helps to smooth out short-term price fluctuations and provide a clearer focus on long-term investment value trends.
3.1.3. Experimental steps
Data preprocessing: stock price data undergoes several preprocessing steps, including conversion to weekly settlement data, handling of missing values, outlier detection and data normalization. These steps are critical to ensure the quality of the data input to the model, enabling the algorithm to learn effectively and provide reliable investment strategy recommendations.
ALGORITHM APPLICATION: Two algorithms, UCB and TS algorithms, were used in the experiments. In the context of these algorithms, each “arm” is defined according to a different investment strategy, such as strategies based on price momentum, trading volume and other financial indicators.
The UCB algorithm: counters and total returns are initialized for each strategy, and then upper confidence bounds are calculated for each strategy in each cycle to determine the optimal investment strategy.
TS Algorithm: strategies are randomly selected by randomly sampling from the reward distribution and the beta distribution parameters are updated in each cycle based on historical returns.
Reward setting: the growth rate of stock prices over a certain period is chosen as the basis for the reward mechanism. This approach allows the model to adjust rewards according to risk and more accurately reflect the effectiveness of different investment strategies.
Model fitting and visualization: UCB and TS algorithms are fitted to historical trading data from AAPL and AMZN. The performance of each algorithm is regularly recorded and cumulative returns and Sharpe ratios are calculated. The results are plotted over time through data visualization techniques to provide investors with an intuitive view of algorithm performance.
3.1.4. Evaluation Metrics
The performance of the UCB and TS algorithms is evaluated through the following two main metrics:
Cumulative returns: this metric summarizes the returns from each trial, providing a comprehensive measure of the total profitability of the investment strategy over a five-year period.
Sharpe Ratio: to account for market volatility, the Sharpe Ratio is used to adjust the return metric. This ratio evaluates the risk-adjusted returns of each algorithm, allowing for a fairer comparison of performance under different market conditions. By analyzing cumulative returns and Sharpe ratios, this study provides insight into the effectiveness of the investment strategies suggested by the UCB and TS algorithms.
In order to examine the effectiveness of long-term investment strategies, stock price data for AAPL Inc. and Amazon.com Inc. were selected for this study over the past five years. These data were obtained through Yahoo Finance and were chosen because they are representative of stock market performance and have a long and complete history of data suitable for long-term trend analysis.
In order to standardize the data format and facilitate subsequent analysis, we converted the daily data to weekly settlement data. This conversion helps to smooth out daily price fluctuations and show more clearly the trends in long-term investment values.
In this study, two algorithms will be used: Upper Confidence Bands (UCB) and Thompson Sampling. The key to the algorithms is how to define the “arm”, which in this study will be defined according to different investment strategies, as determined by specific metrics for buy or sell decisions. These strategies include, but are not limited to, those based on price momentum, trading volume, and other financial indicators.
The reward setting is also critical, as we need to choose the growth rate of the stock price over a certain period of time as the basis for the machine's selection, and then use this growth rate to adjust the reward for risk. Such a setup can more accurately reflect the effects of different investment strategies.
In the data preprocessing stage, in addition to converting the data to weekly settlements, missing value processing, outlier detection and data normalization are performed to ensure the quality of the data input into the model so that the algorithm can learn effectively and provide reliable investment strategy recommendations.
The main objective of this experiment is to optimize stock investment strategies by applying upper confidence bounds and TS algorithms in the multi-armed bandit problem. The experiment will evaluate the performance of these two algorithms under different market volatility conditions to help investors make more informed decisions in long-term investment.
The data used in this experiment was obtained from Yahoo Finance and selected stock price data for Apple Inc. and Amazon.com Inc. for the past five years. The data was converted to weekly settlements to standardize the data format and facilitate subsequent analysis.
When applying the UCB, the counts and total returns of each investment strategy are initialized, and then the UCB for each strategy is calculated in each cycle to determine the optimal investment strategy; When applying the TS algorithm, investment strategies are randomly selected by randomly sampling from the reward distribution and updating the beta distribution parameters in each cycle based on historical returns.
The performance of the algorithms under different market conditions is assessed by applying the above algorithms to obtain cumulative returns for each trade and calculating the Sharpe ratio to adjust the return metrics.
This study analyzes the historical stock price data of AAPL for the past five years by using UCB and TS algorithm to obtain the cumulative return. The cumulative return is the result obtained by calculating the returns in each trial for aggregation. The Sharpe ratio approach was next added to the study to adjust the return metrics because the Sharpe ratio assesses the performance of both algorithms in a volatile market. This study will fit AAPL's stock trading data for the past five years through UCB and TS algorithms and record the returns for each trade on a periodic basis. Based on the results of the algorithms, including cumulative returns and Sharpe ratios, charts over time will be plotted through data visualization methods, which will provide investors with an intuitive view of the performance of the two algorithms.
3.2. Algorithmic Implementation
The Upper Confidence Boundary algorithm is divided into a total of two phases, which will then be balanced. The first phase is the exploration phase, in which each ARM is first initialized to the counter and the total reward, and then in each cycle, for all rewards, the upper confidence bound is computed by the equation \( UCB=\overline{X}+C\sqrt{\frac{\ln{n}}{n_i}} \) . In the above formula, parameter \( \overline{X}\ \) represents the average reward of the current ARM, parameter n represents the total number of cycles, parameter \( n_{i\ } \) represents the number of times the ARM has been selected, and in addition, C is the exploration parameter that determines the weight of the exploration. From this formula, the arm with the highest ucb value can be selected, followed by updating the counter and total reward of that arm. It is suitable for those scenarios that require balanced exploration and utilization, and especially works best when the environment is relatively stable and the distribution of rewards does not change frequently.The UCB is widely used in real-time decision-making systems, such as online advertisement placement and resource allocation problems, due to its simplicity, intuition, and ease of implementation.
Another algorithm used in this study is the Thomson Sampling Algorithm, which takes a random sample from the reward distribution as an ARM and sets the beta distribution parameters \( \alpha \) and \( \beta \) for each ARM, with the initial values usually set to 1. An ARM is randomly selected each cycle, and the results are recorded in time to update the parameters of the beta distribution at the very beginning. According to the return if the return is positive, \( \alpha+1 \) ; return is negative, \( \beta+1 \) . It is suitable for scenarios where the reward distribution is highly uncertain, such as financial investments and clinical trials.TS algorithms are able to better adapt to changes in the environment by taking into account prior knowledge and continuously updating the posterior distribution, thus outperforming in long-term investments.
4. Research Result
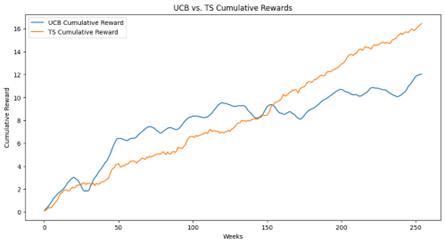
Figure 1. UCB vs. TS Cumulative Rewards for AAPL
The above figure 1 shows the comparison of cumulative returns between the UCB algorithm and the Thomson sampling algorithm for stock investment strategies. The blue curve in the graph represents the UCB, which shows slower growth in the early stages compared to the ts algorithm; while in the later stages, i.e., after the break in the graph, the cumulative returns of the UCB show a significant rise and fluctuation. The orange curve in the graph represents the Thomson sampling algorithm, which shows a more stable and continuous growth trend in cumulative returns, and overall a smoother return curve than the UCB.
The UCB curve exhibits greater fluctuations throughout the period, demonstrating that the UCB is more inclined to explore new possibilities as it seeks to strike a balance between exploration and exploitation, which may result in higher or lower returns in a given period. The Thomson sampling algorithm shows less volatility over most of the period relative to UCB, which suggests that the TS algorithm can adapt more consistently to changes in the market and that its returns are more predictable and stable than those of UCB.
In the long run, the TS algorithm outperforms the UCB as it demonstrates a sustained upward trend and higher final cumulative returns due to the fact that the TS algorithm can more effectively utilize both historical information and current market states in making investment decisions in the long run.
Table 1. Comparison of UCB and TS Algorithms for AAPL
Metric |
Value |
F-value |
0.000397 |
P-value |
0.984110 |
UCB Sharpe Ratio |
-0.004294 |
TS Sharpe Ratio |
-0.000269 |
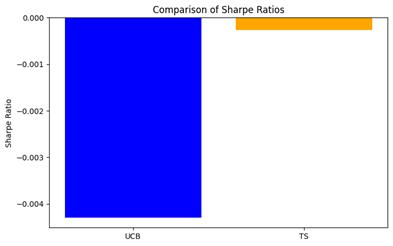
Figure 2. Comparison of Sharpe Ratios for AAPL
Table 1 represents the ratio of the between-group variance to the within-group variance of the UCB and Thomson sampling strategies, which is measured by the F-value in the ANOVA test. A low F-value indicates that the variance between the returns of the UCB and Thomson sampling strategies is not statistically significantly different from the variance of their respective returns. The P-value is used to determine the significance of the results of the ANOVA test. When the P-value is greater than 0.05, it indicates that there is no statistically significant difference between the returns of UCB and Thomson sampling strategies. Here a p-value much greater than 0.05 would indicate that any difference in returns between UCB and Thomson sampling strategies could be due to chance. The Sharpe ratio is an important measure of the risk of an investment strategy, which shows how much risk-free return can be obtained from an investment. When the Sharpe ratio is negative, it means that the investment returns are far from expectations; when the Sharpe ratio is positive, it means that the investment returns are relatively favorable. In the above data, the Sharpe ratio of the UCB strategy is -0.004294, and the Sharpe ratio of the Thomson sampling strategy is -0.000269. Figure 2 shows that the Sharpe ratio of the Thomson sampling strategy is larger than that of the UCB strategy, which means that although both Sharpe ratios are negative, the Thomson sampling strategy loses relatively less money, and under the conditions of this study, the Thomson sampling strategy is a better choice compared to the UCB. better choice.
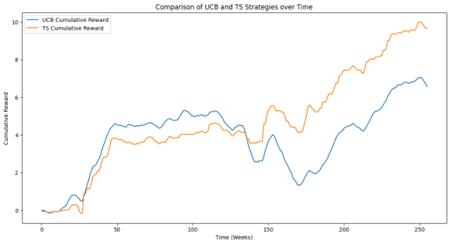
Figure 3. Comparison of UCB and TS Strategies over Time
Figure 3 generated using AMZN data showing a comparison of the cumulative returns of the UCB and Thomson sampling strategies in equity investing. As you can see from the graph,, the cumulative returns of the UCB and Thomson sampling strategies are very close to each other in the first few weeks, with both growing rapidly. In the mid-term period (about 50 to 150 weeks), the cumulative returns of the two strategies begin to show significant differences. The Thomson sampling strategy has smoother returns than UCB, while UCB shows greater volatility. In the later period (after 150 weeks), the cumulative returns of the Thomson sampling strategy are significantly higher than those of UCB and show a steady increasing trend. In contrast, the cumulative returns of UCB, while picking up at some stages, do not show the same overall growth trend as the Thomson sampling strategy.
The UCB strategy shows greater volatility, which is due to the fact that the UCB strategy is more inclined to explore new possibilities. The Thomson sampling strategy, on the other hand, is relatively stable, suggesting that its decision-making process makes more effective use of historical data and thus maintains better performance under uncertain market conditions.
The cumulative returns of the Thomson sampling strategy are higher than those of the UCB, i.e., the Thomson sampling strategy outperforms in terms of risk-adjusted returns. The Thomson sampling strategy determines actions through probabilistic sampling and therefore makes better investment choices in the face of uncertainty.
Table 2. Comparison of UCB and TS Algorithms for AMZN
Metric |
Value |
F-value |
0.1328 |
P-value |
0.7157 |
UCB Sharpe Ratio |
0.2135 |
TS Sharpe Ratio |
0.2447 |
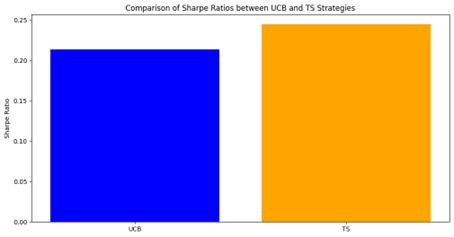
Figure 4. Comparison of Sharpe Ratios between UCB and TS Strategies
Table 2 shows that the Sharpe Ratio of the UCB strategy is 0.2135. A positive Sharpe Ratio indicates that the investment has outperformed the risk-free asset, and this value is moderate relative to the risk. The Sharpe ratio of the Thomson Sampling strategy is 0.2447, which is slightly higher than the Sharpe ratio of UCB. This indicates that the Thomson sampling strategy outperforms UCB in terms of return per unit of risk and is more efficient in terms of risk-adjusted returns. The low F-value of 0.1328 indicates that there is no significant difference in the variance of returns between the UCB and Thomson sampling strategies. The p-value of 0.7157 is much greater than 0.05 indicating that the difference in the means between the UCB and TS strategies is not statistically significant.
The Sharpe ratios indicate that both strategies are providing positive returns in excess of the risk-free rate, with the TS strategy being slightly better in terms of risk-adjusted returns. Figure 4 reveals that there is no statistically significant difference in performance between the two strategies, suggesting that the choice of either strategy is equally viable based on transaction costs, execution feasibility, and investor preference for the style of strategy.
5. Discussion
This study examines the effectiveness of two algorithms, UCB and TS, in long-term stock investment strategies. The performance of these two strategies under different market conditions is evaluated through in-depth analysis of historical stock data.
5.1. Comparison of the performance of UCB and TS algorithms
The UCB shows better performance in low volatility markets. This is due to the fact that the UCB strategy maintains a good balance between exploring new opportunities and utilizing known information, which is suitable for less volatile market conditions. However, in high volatility markets, the UCB does not perform as well because it is slow to adjust to rapidly changing market conditions and fails to adapt to market fluctuations in a timely manner.
The TS algorithm performs well in high volatility markets. This is due to its probabilistic decision-making process that is effective in adapting to rapid market movements. The TS algorithm is able to update its strategy faster under changing market conditions, thus optimizing investment decisions.
In the long run, the cumulative returns of the TS algorithm exceed those of the UCB. This suggests that the TS strategy is more effective at utilizing historical data to adjust its strategy in a timely manner to long-term changes in the market. This suggests that the TS strategy is able to provide more robust returns in the face of a complex and changing investment environment.
5.2. Key Factors Affecting Strategy Selection
Balance between exploration and exploitation: the UCB has a clear advantage in stable environments because it balances the strategies of exploring the unknown and exploiting the known. the TS strategy, on the other hand, performs better in uncertain and dynamic environments because its decision-making mechanism is more flexible and can respond quickly to changes in the market.
Ability to respond to market changes: while UCB strategies may take longer to adapt to dramatic market fluctuations, TS strategies can adapt quickly through their probabilistic sampling mechanism, which is particularly important in highly volatile markets.
5.3. Interpretation of statistical results
While both strategies have positive Sharpe ratios, indicating excess returns relative to risk-free investments, the Thomson sampling strategy has a slightly higher Sharpe ratio, indicating a superior return per unit of risk.
The ANOVA test shows that the difference in returns between the two strategies is not statistically significant (p-value much greater than 0.05), suggesting that there is no significant advantage or disadvantage of the two strategies when risk-adjusted returns are considered.
6. Conclusion
This study provides an in-depth comparison and analysis of two strategies, UCB and Thompson Sampling, by applying them to long-term stock investing. We evaluate the performance of these two algorithms under different market volatility conditions using historical stock data, with the aim of providing investors with insights into choosing the most appropriate investment strategy in a volatile financial market.
The UCB performs better in low volatility markets, which is attributed to its effective balance between exploring new opportunities and utilizing existing knowledge. It is suited to relatively stable market environments and can be robust in delivering consistent returns. The Thomson sampling algorithm, on the other hand, demonstrates better adaptability and performance in high volatility markets. Its ability to quickly adapt to dramatic market fluctuations and optimize investment decisions through a probabilistic sampling decision-making approach allows Thomson Sampling to more effectively manage risk and enhance returns in uncertain market conditions. After taking risk-adjusted returns into account, although the TS strategy has a slightly higher Sharpe ratio, indicating that its risk-adjusted performance is slightly better than that of UCB, ANOVA analysis reveals that the difference in performance between the two strategies is not statistically significant. This suggests that either the UCB or the TS strategy may be a reasonable choice in long-term investing.
In choosing a suitable strategy, investors should consider their risk tolerance, the volatility characteristics of the market, and the investment horizon. The UCB strategy is more suitable for investors who prefer steady growth and lower volatility, while the TS strategy is suitable for investors who can accept higher volatility and seek to maximize returns in a dynamic market.
Future research could further explore the application of these strategies to other types of financial assets, such as bonds, futures, or cryptocurrencies, to validate the generalizability and effectiveness of these strategies. In addition, the study could consider integrating more economic indicators and market data to enhance the predictive power and adaptability of the model and provide more comprehensive data support for investment decisions.
References
[1]. Zhu M, Zheng X, Yan W, Yu L and Liang Q 2019 Adaptive portfolio by solving multi-armed bandit via Thompson sampling. arXiv preprint. 11, 1911.05309
[2]. Ciucanu R, Lafourcade P, Lombard-Platet M and Soare M 2019 Secure best arm identification in multi-armed bandits. Proceedings of the 24th European Symposium on Research in Computer Security. 340-360
[3]. Bouneffouf D and Rish I 2019 A survey on practical applications of multi-armed and contextual bandits. arXiv preprint. 04, 1904.10040
[4]. Dai Z, Low B and Jaillet K P 2020 Federated Bayesian optimization via Thompson sampling. Proceedings of the 34th Conference on Neural Information Processing Systems.
[5]. Garbar V 2020 Invariant description for batch version of UCB strategy for multi-armed bandit. Journal of Physics: Conference Series. 1658, 012015
[6]. Mauersberger F 2019 Thompson sampling: Endogenously random behavior in games and markets. Econstor.
[7]. Liu Y and Ročková V 2021 Variable selection via Thompson sampling. Journal of the American Statistical Association. 118,2023
[8]. Li Y, Wang T, Sun B, and Liu C 2022 Detecting the lead–lag effect in stock markets: Definition, patterns, and investment strategies. Financial Innovation. 8, 51.
[9]. Millea A and Edalat A 2023 Using deep reinforcement learning with hierarchical risk parity for portfolio optimization. International Journal of Financial Studies. 11(1), 10
[10]. Ghatrani Z and Ghate A 2024 Percentile optimization in multi-armed bandit problems. Annals of Operations Research. 1-26.
[11]. Wu J 2024 In-depth exploration and implementation of multi-armed bandit models across diverse fields. Highlights in Science, Engineering and Technology: CMLAI. 94, 201-205
Cite this article
Ge,Y. (2024). UCB and Thompson Sampling Algorithms in Long-Term Investing. Applied and Computational Engineering,83,120-129.
Data availability
The datasets used and/or analyzed during the current study will be available from the authors upon reasonable request.
Disclaimer/Publisher's Note
The statements, opinions and data contained in all publications are solely those of the individual author(s) and contributor(s) and not of EWA Publishing and/or the editor(s). EWA Publishing and/or the editor(s) disclaim responsibility for any injury to people or property resulting from any ideas, methods, instructions or products referred to in the content.
About volume
Volume title: Proceedings of CONF-MLA 2024 Workshop: Semantic Communication Based Complexity Scalable Image Transmission System for Resource Constrained Devices
© 2024 by the author(s). Licensee EWA Publishing, Oxford, UK. This article is an open access article distributed under the terms and
conditions of the Creative Commons Attribution (CC BY) license. Authors who
publish this series agree to the following terms:
1. Authors retain copyright and grant the series right of first publication with the work simultaneously licensed under a Creative Commons
Attribution License that allows others to share the work with an acknowledgment of the work's authorship and initial publication in this
series.
2. Authors are able to enter into separate, additional contractual arrangements for the non-exclusive distribution of the series's published
version of the work (e.g., post it to an institutional repository or publish it in a book), with an acknowledgment of its initial
publication in this series.
3. Authors are permitted and encouraged to post their work online (e.g., in institutional repositories or on their website) prior to and
during the submission process, as it can lead to productive exchanges, as well as earlier and greater citation of published work (See
Open access policy for details).
References
[1]. Zhu M, Zheng X, Yan W, Yu L and Liang Q 2019 Adaptive portfolio by solving multi-armed bandit via Thompson sampling. arXiv preprint. 11, 1911.05309
[2]. Ciucanu R, Lafourcade P, Lombard-Platet M and Soare M 2019 Secure best arm identification in multi-armed bandits. Proceedings of the 24th European Symposium on Research in Computer Security. 340-360
[3]. Bouneffouf D and Rish I 2019 A survey on practical applications of multi-armed and contextual bandits. arXiv preprint. 04, 1904.10040
[4]. Dai Z, Low B and Jaillet K P 2020 Federated Bayesian optimization via Thompson sampling. Proceedings of the 34th Conference on Neural Information Processing Systems.
[5]. Garbar V 2020 Invariant description for batch version of UCB strategy for multi-armed bandit. Journal of Physics: Conference Series. 1658, 012015
[6]. Mauersberger F 2019 Thompson sampling: Endogenously random behavior in games and markets. Econstor.
[7]. Liu Y and Ročková V 2021 Variable selection via Thompson sampling. Journal of the American Statistical Association. 118,2023
[8]. Li Y, Wang T, Sun B, and Liu C 2022 Detecting the lead–lag effect in stock markets: Definition, patterns, and investment strategies. Financial Innovation. 8, 51.
[9]. Millea A and Edalat A 2023 Using deep reinforcement learning with hierarchical risk parity for portfolio optimization. International Journal of Financial Studies. 11(1), 10
[10]. Ghatrani Z and Ghate A 2024 Percentile optimization in multi-armed bandit problems. Annals of Operations Research. 1-26.
[11]. Wu J 2024 In-depth exploration and implementation of multi-armed bandit models across diverse fields. Highlights in Science, Engineering and Technology: CMLAI. 94, 201-205