


1. Introduction
The advancement of machine learning and deep learning has resulted in a significant transformation of the artificial intelligence sector in recent decades. The concept of algorithms with the ability to learn from and forecast data was first explored by trailblazers like Alan Turing and Arthur Samuel in the middle of the 20th century, which is when machine learning first emerged. Turing's work established the idea that machines could behave intelligently, and Samuel's checkers-playing program is frequently recognized as one of the first examples of machine learning in action [1, 2]. In the 1980s and 1990s, the machine learning gained traction with the introduction of various algorithms, such as decision trees [3] and support vector machines [4]. The development of these algorithms allowed researchers to tackle problems of higher complexity, leading to advances in natural language processing, image recognition, and speech understanding. Nevertheless, it was only after the advent of deep learning in the 2000s that machine learning reached its true potential. With the introduction of deep neural networks, based on increased computing capability and the availability of big data, significant progress was achieved in various fields [5, 6].
Deep learning succeeded in challenging tasks, such as image classification, where models including AlexNet achieved state-of-the-art performance on benchmarks like ImageNet [7]. Then, it continued to rise, with frameworks represented by CNNs and RNNs becoming classic tools for AI researchers [8-10], promoting a series of applications from healthcare to robotics. In parallel to developments in deep learning, tree-based classification models have been advancing, which have proven to be effective in various predictive tasks. Among them, Gradient Boosting Machines, introduced by Friedman [10], are an ensemble learning method which develops the model in a progressive mode, optimizing for a loss function at each step. It is practical for both regression and classification challenges due to its capability to combine weak learners into a powerful predictor. Extreme Gradient Boosting is an optimization of GBoost which combines regularization techniques to prevent over-fitting and improve model generalization [11]. It performs remarkably in handling large datasets and exhibits versatility across various applications. Random Forests, on the other hand, is an integrated technique that structures several decision trees for parallel training and takes the average of predictions as the output [12]. The randomness introduced in the selection of features and samples helps mitigate over-fitting, making Random Forests a robust choice for many classification tasks. Recent studies have highlighted the strengths and weaknesses of these tree-based models, as well as their comparative performance in different scenarios. For instance, Liu et al. demonstrated that XGBoost outperformed traditional models in predicting credit risk [13], while Zhang et al. conducted a comprehensive review of ensemble learning methods, highlighting the efficiency of model selection and hyper-parameter tuning in acquiring optimal performance [14].
Aiming to study the performance of tree-based classification methods in prediction tasks, this paper selects Gradient Boosting, XGBoost, and Random Forest to conduct the well-known Titanic survival prediction. The background of this prediction challenge is the Titanic disaster that occurred in 1912. While some survivors benefited from luck, the survival and death of individuals were not entirely random. By selecting factors such as gender, age, and class as the features, and the survival outcome as the target variable, this paper will develop a typical binary classification model of machine learning to perform prediction of the passengers’ survival status. This research starts from data preprocessing, then perform feature importance analysis and feature selection based on a foundation model. After a series of model constructing and hyper-parameters tuning, this paper compares and analyses the test results to examine the characteristics of these tree-based learning methods.
2. Data and method
2.1. Data processing
The Titanic data set includes personal information and survival statuses of certain passengers and crew members involved in the 1912 sinking of the Titanic. The historical data is divided into training and test sets, allowing the development of an appropriate model in the training and thereby the prediction of survival statuses in the test. The feature descriptions of the data set are as follows:
• PassengerId: Passenger’s identity
• Survived: Survival status
• Pclass: Passenger’s ticket class
• Name: Name
• Sex: Gender
• Age: Age in years
• SibSp: Number of siblings or spouses aboard
• Parch: Number of parents or children aboard
• Fare: Fare
• Ticket: Ticket number
• Cabin: Cabin number
• Embarked: Embarkation port.
Since the model ultimately needs to offer predictions for the test samples, both the training and test data set must be preprocessed, including operations on missing values and feature processing. First, the two sets are combined as a single list in convenience of the application of the same operations to both datasets. The “df.isnull()” function is applied for missing values checking . The output results can be organized as shown in Table 1. From the output results, it can be observed that both the training and test set include missing data. Among the training data, missing data exists in Age, Cabin, and Embarked, while in the test set, missing values are found in Age, Cabin, and Fare.
In feature engineering, the key lies in generating new distinguishable variables and modify certain variables for better utility. Subsequently, the missing values should be imputed appropriately on the basis of processed data. Table 2 specifically illustrates the processing operations for each feature. The general operations are as follows:
• Extracting and classifying the passenger titles from Name.
• Generating the Family variable from Parch and SibSp.
• Handling missing values separately.
• Dummy encoding for Pclass, Title, Sex, Family, Ticket, Cabin, and Embarked.
Table 1. Number of missing values.
Feature | Train set missing count | Test set missing count |
Name | 0 | 0 |
Pclass | 0 | 0 |
Sex | 0 | 0 |
Age | 177 | 86 |
Ticket | 0 | 0 |
Fare | 0 | 1 |
Cabin | 687 | 327 |
Embarked | 2 | 0 |
Parch | 0 | 0 |
SibSp | 0 | 0 |
Table 2. Processing method for features.
Feature | Total missing | Filling missing data with | Dummy encoding |
Pclass | 0 | ✔ | |
Title(Name) | 0 | ✔ | |
Sex | 0 | ✔ | |
Age | 263 | Median of samples with the same Sex, Pclass and Title | |
Family (Parch & SibSp) | 0 | ✔ | |
Ticket | 0 | ✔ | |
Fare | 1 | Mean | |
Cabin | 1014 | U(Unknown) | ✔ |
Embarked | 2 | Mode | ✔ |
The samples from the training and the test set are combined for processing. However, the calculation of replacement values only took the training set data into account in order to avoid any leakage of test information. The titles are the most meaningful information within Name. Through extraction and simplification, all titles are classified into 6 categories: Mr, Mrs, Miss, Officer, Master and the Royals.
The processing of the Family variable is based upon a realistic assumption: larger families are more likely to be grouped together, which means higher possibilities to get survived than individual travelers. Therefore, combining the Parch and SibSp with “combined[‘FamilySize’] = combined[‘Parch’] + combined[‘SibSp’] + 1”, it is convenient to obtain the numbers of companions and classify the statuses into “Singleton”, “Small Family” and “Large Family”. For Fare and Embarked values, the numbers of missing values are quite small. Therefore, it is suitable to simply replace 1 missing Fare value by the mean and 2 missing Embarked value by the most frequent one in the training set.
However, there are large numbers of missing Age and Cabin values which might hold patterns of survival. The values used as substitutes must be as accurate as possible. The processing of the Age variables first categorize the data based on Sex, Pclass and Title and then calculate the median value for each category of samples separately. For example, among female passengers in the first class (Pclass=1), the median age of those with the title “Miss” is 30.0, while the average age of those with the title "Officer" is 49.0. To prevent sample leakage from the test set, Ages in both the training set and the test set are filled with values calculated over the train set.
In order to facilitate machine learning training, the categorical variables, including Pclass, Title, Sex, Family, Ticket, Cabin, and Embarked, are converted into numeric formats. Taking Pclass as an example, if a sample has Pclass as 2, it would be encoded as: Pclass_1=0; Pclass_2=1; Pclass_3=0. Trough the above processing, the original variables are replaced by numeric formats. Before building the models, the combined list should be re-segmented into original sets of training and test, with the test set comprising approximately 32% of the total data.
2.2. Methods
Decision trees, also known as regression trees, is a widely used fundamental learner that classify and regress data through a structure similar to trees, where each internal node corresponds to a test over a particular attribute, branch to the testing outcome, and leaf to the final result of class or value [15]. The superiority of decision trees lies in the ease of interpretation and visualization, the capability to tackle both categorical and numerical data, and the minimal requirement for data preprocessing. Gradient Boosting (GBoost) is an ensemble algorithm that performs optimization by consecutively introducing weak learners, typically decision trees [10]. The core idea is to improve subsequent models on the basis of the errors of the previous ones, thereby enhancing overall performance. XGBoost is an optimized implementation of GBoost, with superior computing performance and regularization capabilities [11]. XGBoost accelerates model training through incorporating second-order derivative information and parallel computation. It also performs remarkably in handling missing values and preventing over-fitting. Random Forest is an ensemble algorithm on the basis of the Bagging (Bootstrap Aggregating) principle [12]. It builds several decision trees for parallel training and averages the predictions to promote the model so that the over-fitting problem of a single decision tree does not affect the final prediction results. Different from GBoost and XGBoost, Random Forest reduces variance by randomly sampling both data and features, therefore suitable for high-dimensional data and nonlinear relationships, which is advantageous for the Titanic data set. In addition, Random Forest can evaluate the degree of relevance of features by calculating features’ effect on the splits in the trees, providing guidance for feature selection.
While all three methods are representatives of ensemble learning, they show differences in model construction and optimization strategies. GBoost and XGBoost primarily optimize through an sequential addition model, whereas Random Forest reaches better performance by aggregating predictions from multiple models. In the context of Titanic survival prediction, Random Forest might achieve higher stability and robustness through ensemble model averaging and is expected to obtain most outstanding performance among these three methods. The comparisons are shown in Table 3.
Table 3. Characteristic comparison of GBoost, XGBoost, and Random Forest.
Characteristic | GBoost | XGBoost | Random Forest |
Algorithm type | Boosting | Boosting | Bagging |
Training process | Stepwise optimization, focusing on the errors of the previous step | Stepwise optimization with regularization to reduce over-fitting | Parallel training of multiple trees, with each tree trained independently |
Handling missing values | Requiring manual handling | Automatically handling | Requiring manual handling |
Computing speed | Slower due to stepwise training | Generally faster due to parallel computing | Faster, as tree training is independent |
Regularization | None | L1 and L2 regularization | None |
3. Results and discussion
3.1. Feature importance analysis
Once feature engineering is completed, the next step is reducing dimensionality by selecting appropriate features that encapsulate essential information. Feature selection offers several benefits including reduction of redundancy, increasing training efficiency, and over-fitting mitigation [16, 17]. Tree-based estimators can be applied to calculate feature importance, thereby informing the elimination of irrelevant features. Initialize and train a basic Random Forest classifier with the parameter “n_estimators” as 50 and “max_features” as ‘sqrt’, and visualize the significance of each variable in the model. As is illustrated in Fig. 1, there is a remarkable relationship with Age, Fare, Sex, and Title (Title_Mr, Title_Miss, and Title_Mrs). This demonstrates convincingly that the age, gender, as well as wealth plays important roles in passengers’ survival probability in the Titanic disaster. The “SelectFromModel()” function can be utilized to select features. The compute_score() function is applied for cross-validation, calculating the model’s accuracy. The compute_score() function uses 5-fold stratified cross-validation (cv=5) to evaluate model performance. After initializing the basic Gradient Boosting model, Grid Search is employed for hyper-parameter tuning of the Gradient Boosting classifier. The parameter grid is defined with the following values: "max_depth": 4, 6, and 8; "n_estimators": 50 and 100; "min_samples_split": 2 and 3; "min_samples_leaf": 1 and 3; "max_features": ‘log2’, ‘sqrt’, and ‘auto’; and "max_leaf_nodes": None and 20.
Cross-validation was employed for performance evaluation. The “GridSearchCV()” function facilitated the search for the optimal hyper-parameters by assessing the model’s accuracy as the appraisal index. The optimum model and its corresponding parameters were identified upon applying grid optimization to the training data. The output results include the best score and the optimal hyper-parameter configuration. Finally, predictions were implemented over the test set, and the results were saved to a CSV file for the later analysis. The accuracy of the initial model and the tuned model over the training set are 0.830 and 0.836 respectively. When validated upon the test set, the performance scores are separately 0.763 and 0.775.
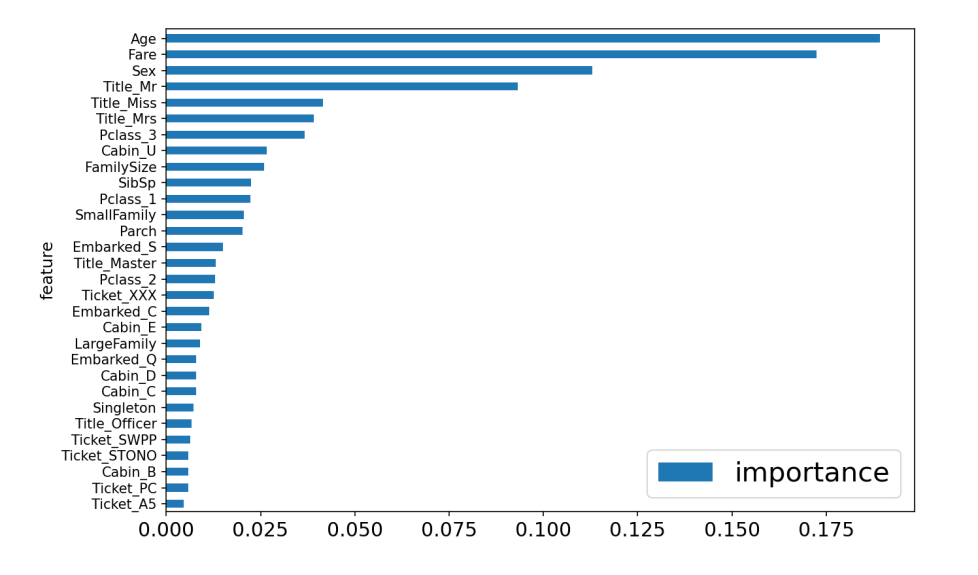
Figure 1. Diagram illustrating feature importance in a basic Random Forest model (with features of minimal importance omitted) (Photo/Picture credit: Original).
XGBoost has multiple hyper-parameters, including the learning rate, the number of estimators, the maximum depth, the regularization parameters, and the minimum child weight, which are substantially related to the classifier’s performance [18]. With the introduction of regularization, the parameter tuning is much more demanding. In this paper, there are 10 parameters selected. The tuned parameters, although not necessarily the same in multiple experiments, can achieve a relatively stable accuracy. The training accuracy of the initial and tuned model are 0.811 and 0.839 respectively. Evaluated on the test set, the performance scores are separately 0.708 and 0.775.
Utilizing functions from the sci-kit learn library, a basic Random Forest model was constructed with default parameters “n_estimators” as 100 and “max_features” as ‘sqrt’. Each estimator in the Random Forest is not pruned and randomly selects a certain number of features and samples to build the decision tree model. This means that each decision tree does not use all the samples and features from the training set. Therefore, the score output in the classifier represents the score of the samples that were not used to build the model for any decision tree. The average accuracy obtained in this way can be considered as the prediction accuracy of the Random Forest classifier. Grid Search is employed for hyper-parameter tuning. A parameter grid was defined with the following values: "max_depth": 4, 6, and 8; "n_estimators": 50 and 10; "min_samples_split": 2, 3, and 10; "min_samples_leaf": 1, 3, and 10; "max_features": ‘log2’, ‘sqrt’, and ‘auto’; and "bootstrap": True and False. The training accuracy of the initial and tuned model are 0.815 and 0.84 respectively. Evaluated on the test set, the performance scores are separately 0.725 and 0.785.
3.2. Performance analysis
The output results obtained above can be consolidated in the Table 4. The Gradient Boosting classifier gains the highest score when initialized and lowest after hyper-parameter tuning. By comparing the two groups of data before and after optimization, it is apparent that the optimization rarely promotes the GBoost model. Although it is not the most outstanding model, the XGBoost method demonstrates a remarkable advantage in its low requirements for parameter tuning. The XGBoost and Random Forest algorithm shows similarity in data characteristics, in which hyper-parameters tuning significantly improves their performances of prediction. After the optimization separately, the test score enhances remarkably and the over-fitting is mitigated for both of the models. In addition, multiple experiments can generally achieve stable accuracy of prediction, although with obvious fluctuation of the optimal parameter. The Random Forest classifier performs slightly better than the other two methods, which indicates the superiority of multiple trees averaging. In datasets of higher complexity, the Random Forest might demonstrate greater advantages.
Table 4. Performance comparison of GBoost, XGBoost, and Random Forest.
initial model | tuned model | |||
training score | test score | training score | test score | |
gboost | 0.83 | 0.763 | 0.836 | 0.766 |
xgb | 0.811 | 0.708 | 0.839 | 0.775 |
rf | 0.815 | 0.725 | 0.84 | 0.785 |
3.3. Limitations
The Titanic data set is not particular complicated. Although there are various features, it is not difficult to extract effective information from these elements. Therefore, the data processing can be implemented definitely and sufficiently. The advantages of XGBoost in handling missing values and Random Forest in tackling data of dramatic complexity and obvious noise are not demonstrated effectively in this paper.
4. Conclusion
To sum up, this study predicts the survival outcomes of Titanic passengers by constructing a survival prediction model on the basis of several classic tree-based classification algorithms. Initially, data preprocessing is conducted, and the data samples are decoupled into training and test sets. Subsequently, GBoost, XGBoost, and Random Forest models are employed to analyze the data set and perform predictions. By measuring and comparing the accuracy of training and test before and after optimization, this paper comes to conclusion that GBoost is a convenient method with low requirements for parameter tuning. The XGBoost, comparing with GBoost, performs slightly better with the introduction of regularization but is correspondingly much more demanding for parameter tuning. The Random Forest method achieves vaguely superior results than the other two algorithms. After hyper-parameter tuning respectively, the three methods all reach a presentable accuracy and do not show serious over-fitting.
Despite limitations in datasets, the results of this paper can to some extent verify the characteristics of the GBoost, XGBoost, and Random Forest method as well as indicate the critical factors in Titanic survival analysis. Features of greatest significance include Age, Fare, Sex, and Title, showing the priority in the rescue of Titanic disaster. The prediction model can be applied to effectively predict human survival in similar disasters based on diverse individual information, thereby offering guidance for emergency measure.
References
[1]. Turing A 1950 Computing machinery and intelligence Mind vol 59(236) pp 433-460
[2]. Samuel A L 1959 Some studies in machine learning using the game of checkers IBM Journal of Research and Development vol 3(3) pp 210-229
[3]. Breiman L, Friedman J H, Olshen R A and Stone C J 1986 Classification and regression trees Wadsworth and Brooks/Cole
[4]. [Cortes C and Vapnik V 1995 Support-vector networks Machine Learning vol 20(3) pp 273-297
[5]. Hinton G E, Osindero S and Teh Y W 2006 A fast learning algorithm for deep belief nets Neural Computation vol 18(7) pp 1527-1554
[6]. LeCun Y, Bengio Y and Haffner P 2015 Gradient-based learning applied to document recognition Proceedings of the IEEE vol 86(11) pp 2278-2324
[7]. Krizhevsky A, Sutskever I and Hinton G E 2012 ImageNet classification with deep convolutional neural networks In Advances in neural information processing systems vol 25 pp 1097-1105
[8]. Goodfellow I, Bengio Y and Courville A 2016 Deep learning MIT Press
[9]. Vaswani A, Shankar S, Parmar N, Uszkoreit J, Jones L, Gomez A N, Kaiser Ł and Polosukhin I 2017 Attention is all you need In Advances in neural information processing systems p 30
[10]. Friedman J H 2001 Greedy function approximation: A gradient boosting machine Annals of Statistics vol 29(5) pp 1189-1232
[11]. Chen T and Guestrin C 2016 XGBoost: A scalable tree boosting system In Proceedings of the 22nd ACM SIGKDD International Conference on Knowledge Discovery and Data Mining pp 785-794
[12]. Breiman L 2001 Random forests Machine Learning vol 45(1) pp 5-32
[13]. Liu Y, Wang Y and Yang Y 2018 Credit risk assessment using XGBoost model Applied Sciences vol 8(8) pp 1362
[14]. Zhang H and Singer B 2020 Ensemble methods in data mining: Improving accuracy through combining predictions Springer
[15]. Freund Y Boosting a weak learning algorithm by majority Information and Computation vol 121(2) pp 256-285
[16]. Sun Y and Li J 2020 Feature selection based on mutual information: A review ACM Computing Surveys vol 52(4) pp 1-35
[17]. Huang J and Wang H 2020 Feature selection: A data perspective Journal of Machine Learning Research vol 21 pp 1-42
[18]. Guo J, Yang L, Bie R, Yu J, Gao Y, Shen Y and Kos A 2019 An XGBoost-based physical fitness evaluation model using advanced feature selection and Bayesian hyper-parameter optimization for wearable running monitoring Computer Networks vol 151 pp 166-180
Cite this article
Huang,S. (2024). Processing and Comparison of GBoost, XGBoost, and Random Forest in Titanic Survival Prediction. Applied and Computational Engineering,102,175-182.
Data availability
The datasets used and/or analyzed during the current study will be available from the authors upon reasonable request.
Disclaimer/Publisher's Note
The statements, opinions and data contained in all publications are solely those of the individual author(s) and contributor(s) and not of EWA Publishing and/or the editor(s). EWA Publishing and/or the editor(s) disclaim responsibility for any injury to people or property resulting from any ideas, methods, instructions or products referred to in the content.
About volume
Volume title: Proceedings of the 2nd International Conference on Machine Learning and Automation
© 2024 by the author(s). Licensee EWA Publishing, Oxford, UK. This article is an open access article distributed under the terms and
conditions of the Creative Commons Attribution (CC BY) license. Authors who
publish this series agree to the following terms:
1. Authors retain copyright and grant the series right of first publication with the work simultaneously licensed under a Creative Commons
Attribution License that allows others to share the work with an acknowledgment of the work's authorship and initial publication in this
series.
2. Authors are able to enter into separate, additional contractual arrangements for the non-exclusive distribution of the series's published
version of the work (e.g., post it to an institutional repository or publish it in a book), with an acknowledgment of its initial
publication in this series.
3. Authors are permitted and encouraged to post their work online (e.g., in institutional repositories or on their website) prior to and
during the submission process, as it can lead to productive exchanges, as well as earlier and greater citation of published work (See
Open access policy for details).
References
[1]. Turing A 1950 Computing machinery and intelligence Mind vol 59(236) pp 433-460
[2]. Samuel A L 1959 Some studies in machine learning using the game of checkers IBM Journal of Research and Development vol 3(3) pp 210-229
[3]. Breiman L, Friedman J H, Olshen R A and Stone C J 1986 Classification and regression trees Wadsworth and Brooks/Cole
[4]. [Cortes C and Vapnik V 1995 Support-vector networks Machine Learning vol 20(3) pp 273-297
[5]. Hinton G E, Osindero S and Teh Y W 2006 A fast learning algorithm for deep belief nets Neural Computation vol 18(7) pp 1527-1554
[6]. LeCun Y, Bengio Y and Haffner P 2015 Gradient-based learning applied to document recognition Proceedings of the IEEE vol 86(11) pp 2278-2324
[7]. Krizhevsky A, Sutskever I and Hinton G E 2012 ImageNet classification with deep convolutional neural networks In Advances in neural information processing systems vol 25 pp 1097-1105
[8]. Goodfellow I, Bengio Y and Courville A 2016 Deep learning MIT Press
[9]. Vaswani A, Shankar S, Parmar N, Uszkoreit J, Jones L, Gomez A N, Kaiser Ł and Polosukhin I 2017 Attention is all you need In Advances in neural information processing systems p 30
[10]. Friedman J H 2001 Greedy function approximation: A gradient boosting machine Annals of Statistics vol 29(5) pp 1189-1232
[11]. Chen T and Guestrin C 2016 XGBoost: A scalable tree boosting system In Proceedings of the 22nd ACM SIGKDD International Conference on Knowledge Discovery and Data Mining pp 785-794
[12]. Breiman L 2001 Random forests Machine Learning vol 45(1) pp 5-32
[13]. Liu Y, Wang Y and Yang Y 2018 Credit risk assessment using XGBoost model Applied Sciences vol 8(8) pp 1362
[14]. Zhang H and Singer B 2020 Ensemble methods in data mining: Improving accuracy through combining predictions Springer
[15]. Freund Y Boosting a weak learning algorithm by majority Information and Computation vol 121(2) pp 256-285
[16]. Sun Y and Li J 2020 Feature selection based on mutual information: A review ACM Computing Surveys vol 52(4) pp 1-35
[17]. Huang J and Wang H 2020 Feature selection: A data perspective Journal of Machine Learning Research vol 21 pp 1-42
[18]. Guo J, Yang L, Bie R, Yu J, Gao Y, Shen Y and Kos A 2019 An XGBoost-based physical fitness evaluation model using advanced feature selection and Bayesian hyper-parameter optimization for wearable running monitoring Computer Networks vol 151 pp 166-180