


1. Introduction
The digital transformation of the educational field has led to the utilisation of data-driven technologies that provide new ways of enhancing learning experiences. Among these, learning analytics are one of the most prominent technologies that enable educational institutions to collect and use large amounts of student data. This capability can be used to track students' engagement and academic performance, but also to predict future outcomes, all in real-time. Educational platforms continuously expand, hence the amount of data generated also increases and becomes a great resource for predictive modelling. Predictive models help determine which students are at risk of failing, thus providing targeted interventions, such as tutoring, mentoring or making modifications to their course. These transformations have significant effects on reducing dropout rates, enhancing retention, and improving student success. In addition to predicting students' outcomes, learning analytics also helps provide personalised feedback and adapt learning pathways. Due to continuously monitoring their performance, learning analytics can enable institutions to adapt the amount of content delivery to each individual's needs. This process promotes an inclusive learning environment, where students are engaged and motivated to learn. Furthermore, because learning analytics systems are based on algorithms, these automated procedures provide feedback to large numbers of students and enable them to receive feedback in a timely manner [1]. With growing complexity of learning environments, it is essential that all efforts are made to deliver quality education by taking appropriate data-driven decisions. This paper will discuss the major components of learning analytics, starting from data collection and machine-learning procedures to personalised educational strategies, and explain their impacts to improve student success.
2. Learning Analytics Framework
2.1. Data Collection and Preprocessing
Timely and personalized feedback is a cornerstone of fostering student motivation and engagement, especially in modern educational environments where learning analytics plays a crucial role. The relationship between feedback and motivation can be modeled using the formula \( M= \) \( P×(\frac{F}{T})+E \) ,where \( M \) represents student motivation, \( P \) stands for the personalization factor of the feedback, \( F \) is the feedback quality, and \( T \) represents the time interval between feedback sessions. The formula demonstrates that the more personalized and frequent the feedback, the greater its impact on student motivation. Additionally, the engagement level \( E \) serves as a baseline, meaning that higher initial engagement enhances the motivational effects of timely and personalized feedback. For example, when a student completes an assignment, receiving immediate feedback that is both detailed and specific to their performance helps to reinforce their strengths while pointing out areas for improvement. The frequent, tailored nature of the feedback allows the student to adjust their strategies in real-time, preventing disengagement and promoting a continual sense of progress. As \( F/T \) increases, meaning feedback is delivered quickly and with high quality, the motivation \( M \) increases significantly, making students feel more supported and empowered in their learning journey. Furthermore, the personalization factor \( P \) ensures that feedback addresses individual needs, making it more relevant and impactful [2]. Whether a student excels or struggles, personalized feedback helps them feel that their progress is being noticed, encouraging them to engage more deeply with the course content. The learning analytics systems that automate this feedback process are able to deliver it consistently and at scale, ensuring that even in large classes or complex curricula, students receive high-quality, timely feedback. This promotes self-regulated learning, where students actively participate in their own education, adjust their learning tactics based on feedback, and maintain motivation throughout the course. In this way, the interplay between feedback quality, timing, and personalization becomes a powerful tool for educators to enhance both student motivation and overall learning outcomes.
2.2. Predictive Modeling in Learning Analytics
Predictive modeling lies at the core of learning analytics, enabling educators to anticipate student outcomes based on historical and real-time data. This process can be represented by the formula \( O=f(B,A,E) \) ,where \( O \) is the predicted student outcome, \( B \) represents student behavior data, \( A \) signifies academic performance, and \( E \) stands for engagement levels. Machine learning algorithms such as decision trees, neural networks, and support vector machines process these variables to identify patterns and correlations between student behavior and academic success. These models can forecast a range of outcomes, from predicting a student’s success on future assessments to identifying those at risk of dropping out. For instance, by analyzing \( B \) (interactions with course material) and \( E \) (engagement in discussion forums), the model highlights students who may need additional support. The predictive function \( f \) is continuously refined as it processes more data, improving its accuracy in forecasting outcomes. In certain cases these models have successfully forecasted student performance weeks or even months before final exams, allowing educators to intervene early. By moving from a reactive to a proactive approach, institutions can offer personalized support to students, addressing potential challenges before they become significant issues [3]. This version integrates the formula \( O=f(B,A,E) \) into the context of predictive modeling, showing how student behavior, academic performance, and engagement contribute to forecasting student outcomes.
2.3. Visualization and Interpretation of Data
The second critical stage in learning analytics is data visualisation, which translates big data sets into actionable pieces of information for educators. Through visualisation tools such as dashboards, graphs and heat maps, educators would be able to improve their ability to detect and react to trends and outliers in student behaviour and performance. Through effective visualisation, educators can track individual student progress and/or aggregate class-wide trends to help identify and customise areas that require specific interventions. For example, a dashboard that captures real-time information regarding student engagement across multiple courses and sections can signal to the educator and/or institution students who are at risk academically, so that they can provide the necessary interventions and do so in a real-time fashion [4]. Visualisation is also a critical tool for educators to communicate to administrators and stakeholders what the data reveal about specific areas within the institution or specific outcomes for specific groups of students. The ability to see patterns and outliers within and across courses and curriculum can inform decisions around curriculum redesign, resource allocation and policy tweaks. The gap between big data and information is what visualisation helps to bridge.
3. Student Behavior Prediction
3.1. Analyzing Learning Engagement
Engagement with learning activities may very well be the most important leading indicator of student success. Using big data, institutions can monitor how often students interact with learning content, participate in online discussions, or complete assignments. Each type of behavioural pattern can be a proxy for engagement, a factor in academic performance. For instance, students who frequently engage with digital learning platforms tend to achieve better scores in assessments (which is likely a factor of increased engagement) than those who do not. Using data, institutions can quickly identify that some students are at risk of academic failure, and provide support so that they can avoid missing classes, falling behind with coursework, or failing an assessment. While there are relatively simple patterns to anticipate academic success and failure, learning analytics can also reveal periodic changes in engagement. Institutional data can show fluctuations in student performance over time, with particular times in the semester where students are most likely to experience difficulties. Institutions can use this information to adapt content and teaching methodologies to re-engage them with their learning, so that they can achieve better outcomes [5]. The information in Table 1 is based on a study undertaken by the Educational Analytics Research Group (2023) [6], which established the relationship between students’ engagement and academic performance in various higher education institutions with online learning via multiple platforms. In the study, researchers monitored students’ behaviours, including how they interacted with course materials, discussion boards and their assignment details, over one semester, to explore the impact on their overall academic outcomes.
Table 1: Student Engagement and Performance
Student_ID | Interactions_with_Course_Material | Online_Discussion_Participation | Assignments_Completed | Overall_Engagement_Score | Assessment_Score |
S001 | 120 | 15 | 10 | 145 | 85 |
S002 | 45 | 5 | 6 | 56 | 50 |
S003 | 98 | 10 | 8 | 108 | 75 |
S004 | 150 | 18 | 10 | 168 | 90 |
S005 | 30 | 3 | 5 | 38 | 45 |
3.2. Monitoring Performance Metrics
Exam scores, grades on assignments, and other performance metrics are immediate indicators of progress in learning. Learning analytics can help to track these frequently, detecting which students are falling behind, and alerting instructors to give additional support. If early test results for a student in a particular class suggest poorer performance than usual, predictive models can warn instructors or alert him to give extra resources or seek a tutor [7]. Patterns found in performance data on large numbers of students can offer insights into how best to intervene to address specific learning weaknesses. Performance metrics are also a basis for forecasting longer-term outcomes. Given performance on some tests, instructors can predict whether a student is likely to pass or fail a course. This can inform the design of a ‘learning plan’ tailored to the unique needs of the student.
3.3. Identifying At-Risk Students
Notably, one of the most pertinent benefits of learning analytics is the ability for institutions to identify at-risk students through predictive models that analyse a combination of behavioural (including attendance, submission, class participation, overall performance etc.) and performance data that can detect early warning signs of academic risks long before they grow in criticality. The Table 2 shows some common risk factors include irregular attendance, late submissions and poor participation in classroom activities [8]. As soon these patterns are identified, institutions can initiate personalised interventions through formal or informal meetings, additional tutoring or adjustment of the syllabus to re-engage at-risk students before they dropout. We have seen many institutions with effective learning analytics systems implemented notice a reduction in dropout rates. An example is the Table 2, which presents the longitudinal study results conducted by the Institute of Learning Analytics and Educational Research (2022) [9]. Their study tracked student attendance, submission class participation through multiple institutions to identify early warning signs of academic risks and also the impact of a number of interventions such as tutoring and one-on-one meetings conducted to help retain the students and improve student success rate.
Table 2: At-Risk Student Data and Interventions
Student_ID | Attendance_Percentage | Late_Submissions | Class_Participation_Score | Identified_As_At_Risk | Intervention_Offered |
S101 | 70 | 3 | 6 | Yes | Tutoring |
S102 | 50 | 7 | 3 | Yes | One-on-One Meeting |
S103 | 95 | 0 | 9 | No | None |
S104 | 65 | 5 | 5 | Yes | Tutoring |
S105 | 40 | 8 | 2 | Yes | One-on-One Meeting |
4. Personalized Educational Strategies
4.1. Tailoring Content Delivery
One of the primary benefits of learning analytics is that it enables educators to deliver different content to different students based on their needs or preferences. This is achieved by examining student interaction data to determine what kind of materials (video, simulation, text, etc) individual students respond to. For some, video-based instruction may prove to be the most effective; for others, simulations or text-based materials may be a better fit. In this way, they can continue to deliver content to meet the needs of different users. Importantly, learning analytics allows educators to provide the appropriate level of challenge to all students. For example, more advanced learners can be given more challenging materials while students who are having difficulty can receive content that reinforces the basic principles of what they are learning [10]. This personalisation, by creating better learner-content fit, is not only conducive to deeper learning, but also helps to create more inclusive learning environments that can meet a wider range of student needs. Table 1 demonstrates the varying effectiveness of different content types—video-based instruction, simulations, and text-based materials—across advanced, average, and struggling learners.
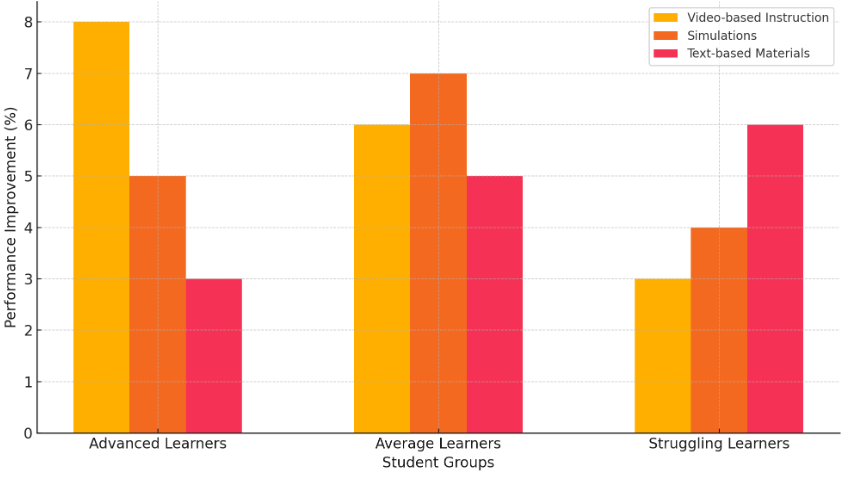
Figure 1: Effectiveness of Tailored Content Delivery by Student Groups
4.2. Adaptive Learning Pathways
Adaptive learning technologies continuously collect real-time data to modify the learning path in response to how a student is progressing. If a system is constantly monitoring a student’s performance and engagement, it has the ability to automatically modify the learning course as the student works through it, allowing it to provide individualised learning experiences. If a student is mastering a topic, the adaptive learning pathway may present more advanced materials. If a student is struggling, the pathway can present additional practice or review lessons [11]. Adaptive learning pathways dynamically adjust the level of difficulty so that it is always appropriate to the student’s level. With this approach, a student spends more time on the things they need to work on and less time on things they have already mastered. It is much more efficient and students learn material more effectively.
4.3. Feedback and Student Motivation
On-time and individualised feedback is crucial to sustain engagement and motivation. Learning analytics allows the provision of real-time feedback that can be personalised by students’ performance and progress. For example, after finishing the assignment, students can receive feedback with comments on their strengths and weaknesses, which will provide students with immediate feedback to readjust a new strategy to learn and to be motivated for the next class. Personalised feedback can help students to become self-directed learners and foster their feelings of self-efficacy. Learning analytics systems can automate such processes, providing students with consistent and quality feedback on their learning regardless of course sizes or learning disciplines. By allowing students to become the major actors of their learning processes, personalised feedback promotes self-regulated learning, which will improve the quality of learning processes.
5. Conclusion
Learning analytics represents a new era in education – a way for institutions to better understand, facilitate and improve student learning. Through the use and analysis of big data, educational institutions can identify and intervene students; adapt to learning styles and tailor feedback even predict and intervene analytics also supports the use of personalised feedback systems, which can motivate and engage students in self-regulated learning. As educational environments evolve, learning analytics will become a critical space for developing these personalised, data-driven approaches for learning, teaching and even guiding institutions as a whole. Likewise, as institutions begin to adopt these technologies, they will be better able to support and empower student success, enhance retention and provide an engaging, relevant and effective way to pursue their education. In a nutshell, learning analytics provides the bridge between the collection of data and the use of this data to take action and ensure that every student succeeds.
References
[1]. Caspari-Sadeghi, Sima. "Learning assessment in the age of big data: Learning analytics in higher education." Cogent Education 10.1 (2023): 2162697.
[2]. Yassine, S., S. Kadry, and M. A. Sicilia. "Learning analytics and learning objects repositories: Overview and future directions." Learning, Design, and Technology: an international compendium of theory, research, practice, and policy (2023): 3503-3532.
[3]. Freire, Manuel, et al. "Game learning analytics: Learning analytics for serious games." Learning, design, and technology: An international compendium of theory, research, practice, and policy. Cham: Springer International Publishing, 2023. 3475-3502.
[4]. Nguyen, Andy, et al. "Examining socially shared regulation and shared physiological arousal events with multimodal learning analytics." British Journal of Educational Technology 54.1 (2023): 293-312.
[5]. Ijeh, Scholastica, et al. "Predictive modeling for disease outbreaks: a review of data sources and accuracy." International Medical Science Research Journal 4.4 (2024): 406-419.
[6]. Khodadadi, Ehsaneh, and S. K. Towfek. "Internet of Things Enabled Disease Outbreak Detection: A Predictive Modeling System." Journal of Intelligent Systems & Internet of Things 10.1 (2023).
[7]. Igwama, Geneva Tamunobarafiri, et al. "Big data analytics for epidemic forecasting: Policy Frameworks and technical approaches." International Journal of Applied Research in Social Sciences 6.7 (2024): 1449-1460.
[8]. Jain, Arushi, et al. "Optimized levy flight model for heart disease prediction using CNN framework in big data application." Expert Systems with Applications 223 (2023): 119859.
[9]. Farayola, Oluwatoyin Ajoke, et al. "Advancements in predictive analytics: A philosophical and practical overview." World Journal of Advanced Research and Reviews 21.3 (2024): 240-252.
[10]. Egwim, Christian Nnaemeka, et al. "Comparison of machine learning algorithms for evaluating building energy efficiency using big data analytics." Journal of Engineering, Design and Technology 22.4 (2024): 1325-1350.
[11]. Yuan, Shuai, Brigitte Kroon, and Astrid Kramer. "Building prediction models with grouped data: A case study on the prediction of turnover intention." Human Resource Management Journal 34.1 (2024): 20-38.
Cite this article
Luo,X. (2024). Learning Analytics Based on Big Data: Student Behavior Prediction and Personalized Educational Strategy Formulation. Applied and Computational Engineering,116,7-13.
Data availability
The datasets used and/or analyzed during the current study will be available from the authors upon reasonable request.
Disclaimer/Publisher's Note
The statements, opinions and data contained in all publications are solely those of the individual author(s) and contributor(s) and not of EWA Publishing and/or the editor(s). EWA Publishing and/or the editor(s) disclaim responsibility for any injury to people or property resulting from any ideas, methods, instructions or products referred to in the content.
About volume
Volume title: Proceedings of the 5th International Conference on Signal Processing and Machine Learning
© 2024 by the author(s). Licensee EWA Publishing, Oxford, UK. This article is an open access article distributed under the terms and
conditions of the Creative Commons Attribution (CC BY) license. Authors who
publish this series agree to the following terms:
1. Authors retain copyright and grant the series right of first publication with the work simultaneously licensed under a Creative Commons
Attribution License that allows others to share the work with an acknowledgment of the work's authorship and initial publication in this
series.
2. Authors are able to enter into separate, additional contractual arrangements for the non-exclusive distribution of the series's published
version of the work (e.g., post it to an institutional repository or publish it in a book), with an acknowledgment of its initial
publication in this series.
3. Authors are permitted and encouraged to post their work online (e.g., in institutional repositories or on their website) prior to and
during the submission process, as it can lead to productive exchanges, as well as earlier and greater citation of published work (See
Open access policy for details).
References
[1]. Caspari-Sadeghi, Sima. "Learning assessment in the age of big data: Learning analytics in higher education." Cogent Education 10.1 (2023): 2162697.
[2]. Yassine, S., S. Kadry, and M. A. Sicilia. "Learning analytics and learning objects repositories: Overview and future directions." Learning, Design, and Technology: an international compendium of theory, research, practice, and policy (2023): 3503-3532.
[3]. Freire, Manuel, et al. "Game learning analytics: Learning analytics for serious games." Learning, design, and technology: An international compendium of theory, research, practice, and policy. Cham: Springer International Publishing, 2023. 3475-3502.
[4]. Nguyen, Andy, et al. "Examining socially shared regulation and shared physiological arousal events with multimodal learning analytics." British Journal of Educational Technology 54.1 (2023): 293-312.
[5]. Ijeh, Scholastica, et al. "Predictive modeling for disease outbreaks: a review of data sources and accuracy." International Medical Science Research Journal 4.4 (2024): 406-419.
[6]. Khodadadi, Ehsaneh, and S. K. Towfek. "Internet of Things Enabled Disease Outbreak Detection: A Predictive Modeling System." Journal of Intelligent Systems & Internet of Things 10.1 (2023).
[7]. Igwama, Geneva Tamunobarafiri, et al. "Big data analytics for epidemic forecasting: Policy Frameworks and technical approaches." International Journal of Applied Research in Social Sciences 6.7 (2024): 1449-1460.
[8]. Jain, Arushi, et al. "Optimized levy flight model for heart disease prediction using CNN framework in big data application." Expert Systems with Applications 223 (2023): 119859.
[9]. Farayola, Oluwatoyin Ajoke, et al. "Advancements in predictive analytics: A philosophical and practical overview." World Journal of Advanced Research and Reviews 21.3 (2024): 240-252.
[10]. Egwim, Christian Nnaemeka, et al. "Comparison of machine learning algorithms for evaluating building energy efficiency using big data analytics." Journal of Engineering, Design and Technology 22.4 (2024): 1325-1350.
[11]. Yuan, Shuai, Brigitte Kroon, and Astrid Kramer. "Building prediction models with grouped data: A case study on the prediction of turnover intention." Human Resource Management Journal 34.1 (2024): 20-38.