


1. Introduction
In the past decades, images carry complex and rich information in a simple form. As artificial intelligence and computer technology continue to evolve at a rapid pace, deep learning has been progressively brought into the image processing industry and has produced impressive results [1, 2]. The goal of computer vision, a significant area of computer science, is to empower devices and systems to recognize and process visual inputs like images, extracting useful information and acting or making decisions in response [3]. In this process, image features play a crucial role as the basic units of information. Consequently, picture feature detection and matching algorithms have emerged as fundamental technologies in the domain of computer vision.
Within this framework, many feature detection and matching algorithms have been introduced and are widely utilized. Among them, SIFT (scale-invariant feature transform) and SURF (speed-up robust feature), as the early classical algorithms, occupy an important position in various computer vision tasks by virtue of their invariance to feature stability, scale and rotation [4]. However, with the development and application of deep learning technology, the traditional hand-designed feature detection and matching algorithms gradually reveal their limitations, especially when they perform poorly in dealing with complex scenes and diverse visual tasks. To solve these problems, deep learning-based feature detection and matching algorithms, such as Superpoint and D2-Net, have emerged, which show significant advantages over traditional hand-designed feature detection and matching algorithms when dealing with complex and irregular scenes (e.g., occlusion and strong illumination changes). By learning rich feature representations, these methods are able to adapt to a variety of variations and disturbances, thus improving the accuracy and robustness of matching [5, 6]. Even though an extensive amount of research has been done to thoroughly compare the performance of traditional algorithms like SIFT and SURF [4,7,8,9], there are still relatively few performance comparisons between classical algorithms and deep learning-based algorithms for feature detection and matching algorithms (e.g., Superpoint and D2-Net) [10]. Therefore, this paper will fill this gap by focusing on comparing the performance of the classical algorithms SIFT and SURF with the deep learning methods Superpoint and D2-Net in different scenarios, and discussing in depth their applicability and advantages in modern computer vision tasks.
2. Related work
2.1. Classical feature detection and matching algorithms
Among the early research in feature detection and matching, SIFT (Scale Invariant Feature Transform) and SURF (Speeded Up Robust Feature) are among the most influential algorithms. SIFT, originally developed by David Lowe in 1999, is a resilient feature identification technique that retains stability across scaling, rotation, and variations in illumination. SIFT is a robust feature detection algorithm that maintains stability under scaling, rotation and illumination changes, making it ideal for detecting keypoints in an image. The core idea of SIFT is to find local extrema as keypoints by constructing a scale space, and to compute feature descriptors for each keypoint. These descriptors are represented by high-dimensional vectors and are used to achieve feature matching between images [11]. However, SIFT is computationally intensive and less efficient especially when dealing with high resolution images, which becomes one of its main limitations [12].
The SURF algorithm, proposed in 2006, was optimized for the computational complexity of SIFT.SURF performs feature point detection by means of Hessian matrix determinant and accelerates the computation of the feature descriptors by using an integral map. SURF significantly improves computational efficiency while maintaining robustness to scale and rotation [13]. However, although SURF shows better speed and stability in regular scenes, the matching accuracy and robustness are still deficient in large view angle changes, strong occlusion, and complex dynamic scenes, especially when facing images with less texture or repetitive patterns, which are prone to mis-matching.
These two algorithms have been commonly employed in image stitching assignments, especially in the generation of panoramas and seamless stitching of multiple images, where alignment and synthesis between images can be effectively achieved by extracting and matching feature points [14, 15]. However, traditional feature detection and matching methods are often difficult to cope with complex motion patterns and non-rigid deformations when dealing with dynamic scenes or drastic environmental changes, resulting in less than ideal stitching results. In addition, the matching performance of SIFT and SURF is significantly degraded when confronted with strong illumination changes or blurred images [16, 17].
2.2. Deep learning based feature detection and matching algorithm
The recent development of deep learning algorithms has advanced the domain of feature identification and matching. Superpoint is a comprehensive convolutional model utilizing self-supervised learning, capable of concurrently calculating pixel-level interest points and feature descriptors on whole pictures by training interest point detectors and descriptors. Superpoint introduces an adaptive method with multiple scales and multiple single responsiveness, which effectively improves the repeatability and cross-domain adaptation of interest point detection [5]. D2-Net, on the other hand, is a method that utilizes a single convolutional neural network to jointly achieve feature detection and dense feature description, and is able to find reliable pixel-level correspondences under complex imaging conditions. By deferring detection to higher-level features, D2-Net extracts keypoints more consistently than traditional methods and can learn without additional labeling from large-scale structural reconstruction (SfM) data [6].
In this study, we systematically compare the performance of SIFT, SURF, Superpoint and D2-Net in different scenarios by comprehensively analyzing the advantages and disadvantages of classical feature detection algorithms and modern deep learning methods. This comparison is not just a simple evaluation of each algorithm, but an in-depth discussion of the effectiveness and limitations of each type of algorithm in practical applications compared with previous studies. In addition, this paper will consider the characteristics of specific application scenarios to reveal the performance differences of the algorithms in dealing with complex environments, so as to provide a more targeted reference for future research on feature detection and matching algorithms. Through this novel perspective, it aims to fill the gaps in existing research and promote the development of related fields.
3. Methodology
3.1. SIFT
The core premise of the SIFT approach is to identify keypoints on a variety of scales and determine the orientation of them. The prominent characteristics identified by SIFT include distinctive locations that persist unaltered despite variations in illumination, affine transformations, and noises, encompassing corner points, boundary points, luminous points in dim regions, and obscure points in illuminated areas, among others. The prominent characteristics detected by SIFT are critical locations that remain unchanged despite alterations in light, affine transformations, and noise. Figure 1 shows the main steps of feature point detection and matching of SIFT [11, 18].
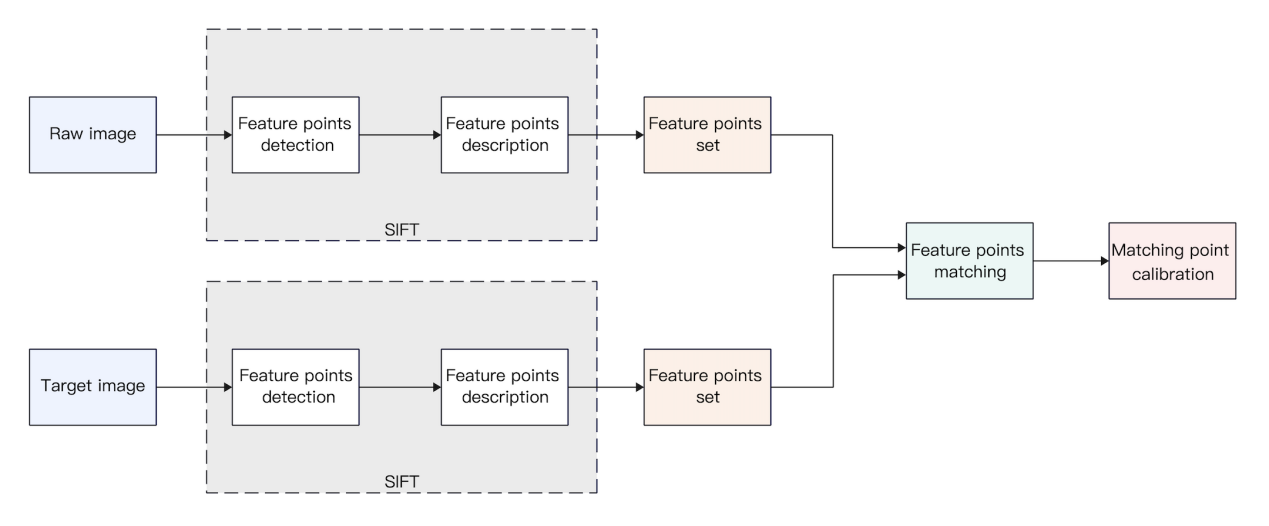
Figure 1. SIFT feature detection and matching process (Photo/Picture credit : Original)
3.1.1. Scale-space extrema detection The initial phase identifies unique characteristics by exploring the scale space with the Difference of Gaussian (DoG) function to detect prospective spots of interest that exhibit scale and orientation invariance. The image's scale space is denoted as \( L(x,y,σ) \) (1), created via convolutioning a variable scale Gaussian \( G(x,y,σ) \) (2) with the input image \( I(x,y,σ) \) :
\( L(x,y,σ)=G(x,y,σ)*I(x,y) \) (1)
\( G(x,y,σ)=\frac{1}{2π{σ^{2}}}{e^{-\frac{{x^{2}}+{y^{2}}}{2{σ^{2}}}}} \) (2)
Critical points that are valid and robust are determined by detecting scale-space extrema from several Difference of Gaussians (DoGs) (Figure 2). \( D(x,y,σ) \) is derived from the disparity between two contiguous scales differentiated by an ongoing multiplied factor k (3):
\( D(x,y,σ)=(G(x,y,kσ)-G(x,y,σ))*I(x,y)=L(x,y,kσ)-L(x,y,σ) \) (3)
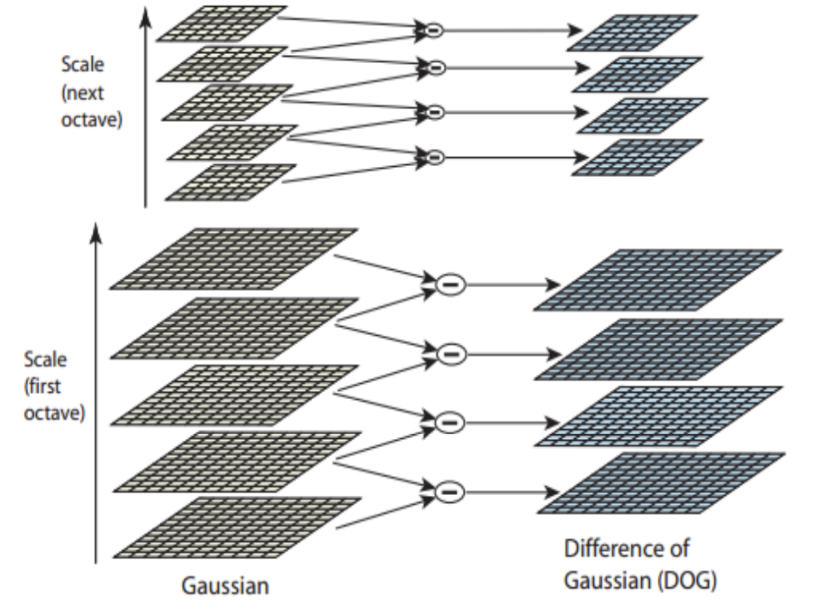
Figure 2. Generation of Gaussian difference pyramid [19]
3.1.2. Key point positioning A comprehensive model was applied at each feature point to ascertain position and scale. Keypoints were chosen based on their stability measurements.
\( m(x,y)=\sqrt[]{(L(x+1,y)-L(x-1,y){)^{2}}+(L(x,y+1)-L(x,y-1){)^{2}}} \) (4)
\( θ(x,y)={tan^{-1}}(\frac{(L(x,y+1)-L(x,y-1))}{(L(x+1,y)-L(x-1,y))}) \) (5)
3.1.3. Keypoint descriptor Localized picture intensity variations were assessed at specific scales in the vicinity of each keypoint. These were transformed into representations that permitted substantial degrees of localized shape distortion and variations in illumination.
3.2. SURF
SURF utilizes the concept of approximate simplification (DoG approximation in lieu of LoG) within SIFT, streamlining the Gaussian second-order differential template of the Hessian matrix through the integral map. Consequently, the image filtering via the template necessitates merely a few elementary addition and subtraction operations, which are unaffected by the dimensions of the filtering template. SURF is an enhanced and expedited variant of SIFT, optimizing computational speed while maintaining comparable performance in feature point detection [13]. SURF significantly outperforms SIFT in both speed and overall efficacy. The main steps of feature point detection and matching in SURF are [13, 20]:
3.2.1. Points of interest detection Feature point detection is accelerated by converting the original image into an integral image. The integral image represents the sum of all pixel intensities, which is calculated as:
\( {I_{Σ}}(X)=\sum _{i=0}^{i≤x} \sum _{j=0}^{j≤y} I(i,j) \) (6)
Based on the fundamental image, the sum of the luminance values of the pixels on any vertical rectangular region is calculated (Figure 3).
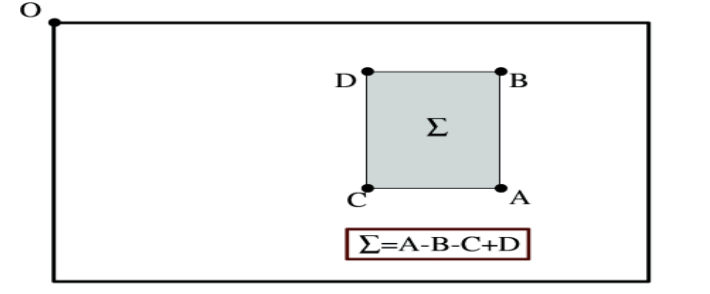
Figure 3. Example of summing pixel grayscale values [21]
The integral image is convolved using a box filter as an approximation of the Gaussian filter. The definition of the Hessian matrix is:
\( H(X,σ)=[\begin{matrix}{L_{xx}}(X,σ) & {L_{xy}}(X,σ) \\ {L_{xy}}(X,σ) & {L_{yy}}(X,σ) \\ \end{matrix}] \) (7)
3.2.2. Point of interest description To maintain the rotational invariance of the image, the SURF determines repeatable directions for the points of interest. The response is computed in both x and y directions in a region of radius 6s using Haar wavelets with 4s side lengths and a sampling step size that depends on the scale s. The response is then computed in the x and y directions (Figure 4).

Figure 4. Haar wavelet types used for SURF [21]
Upon calculating the wavelet response, it is depicted as spatial points with a Gaussian weighting σ = 2s, centered on the place of interest, with the horizontal and vertical response intensities serving as the respective horizontal and vertical coordinates. Subsequently, the peak value of the response sum is identified inside every sliding window (oriented at π/3), and the local direction vector is produced by aggregating the horizontal and vertical responses to ascertain the direction of the point of interest (Figure 5).
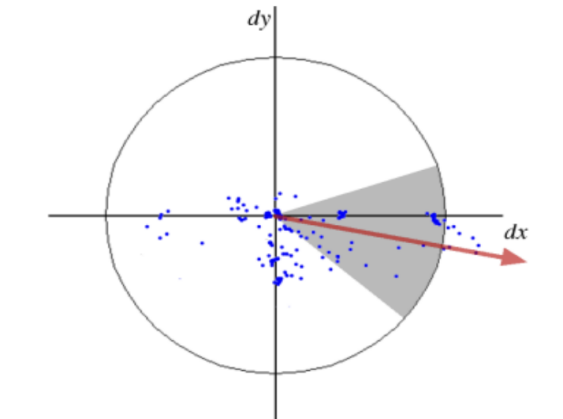
Figure 5. Direction assignment [21]
A square region constructed over the points of interest to extract the feature descriptors (Figure 6).
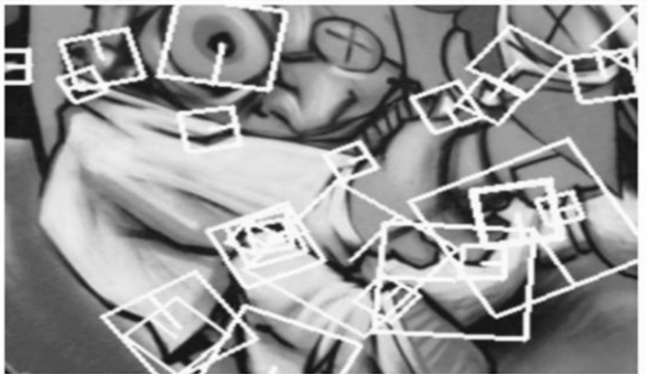
Figure 6. Detail of the graffiti scene showing the size of the descriptor window at different scales [21]
3.3. Superpoint
Superpoint is a self-supervised network framework that simultaneously detects keypoints and extracts descriptors. Compared with the classical algorithms SIFT and SURF, Superpoint introduces a monoimmunity adaptation strategy, which generates new training samples through multiple monoimmunity transformations to improve the re-detection rate and robustness of feature points. Although SIFT and SURF perform well in terms of scale and rotation invariance, they are susceptible to noise and illumination changes in complex scenes [5]. Comparatively, Superpoint's self-supervised learning approach makes it more stable in different contexts, especially in cross-domain tasks (e.g., migration from synthetic data to real scenes), showing more flexibility and robustness, making it a more competitive choice for modern computer vision applications. The main steps of feature point detection and matching in Superpoint are [5]:
3.3.1. Points of interest pre-training Create synthetic dataset Synthetic Shapes (simple graphics, small pixels, huge total number of points of interest, accurate points of interest) Build Superpoint network using synthetic dataset. Training results on the synthetic dataset Synthetic Shapes significantly outperform traditional interest point detectors (Figure 7) (FAST, etc.).
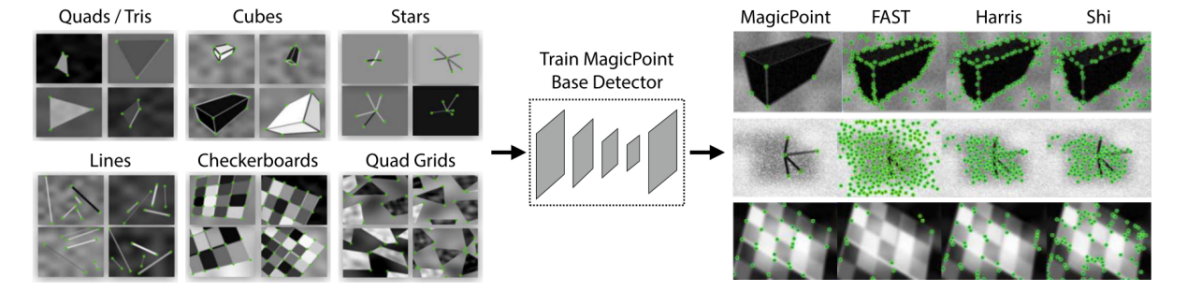
Figure 7. Synthetic Pre-Training [5]
3.3.2. Self-monitoring labels Feature points are extracted from the selected dataset using MagicPoint, a detector trained in interest point pre-training. With this self-supervised dataset training, the obtained detections exhibit enhanced repeatability (Figure 8). Multiple transformations are performed for each image, and this approach effectively improves the repeatability of the detector and enhances the stability of feature point detection.
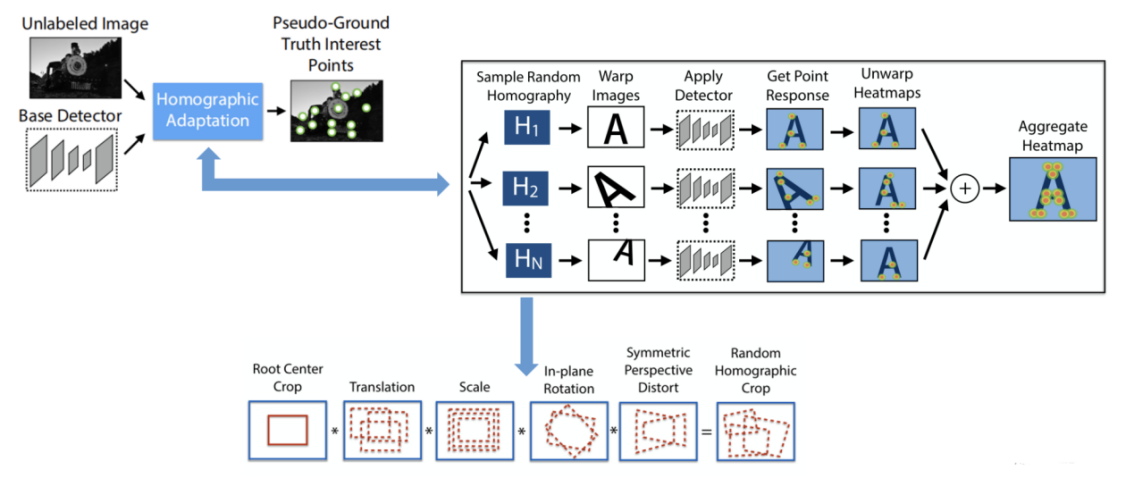
Figure 8. Self-Supervised Training Overview [5]
3.3.3. Joint training During the training process, the network first determines the truth values of the feature points on the real image set, while the truth values of the descriptors are generated by the network learning on its own. The deformed image is generated by single responsive transform to derive the relationship between the original image and the relevant feature points in the altered image. The loss function is used to calculate the distances between matching and non-matching points and optimize the network so that the descriptor distances for matching points are as small as possible and the distances for non-matching points are as large as possible. This process enables Superpoint to efficiently capture local features and optimize the similarity and differentiation of descriptors for efficient feature point matching (Figure 9).
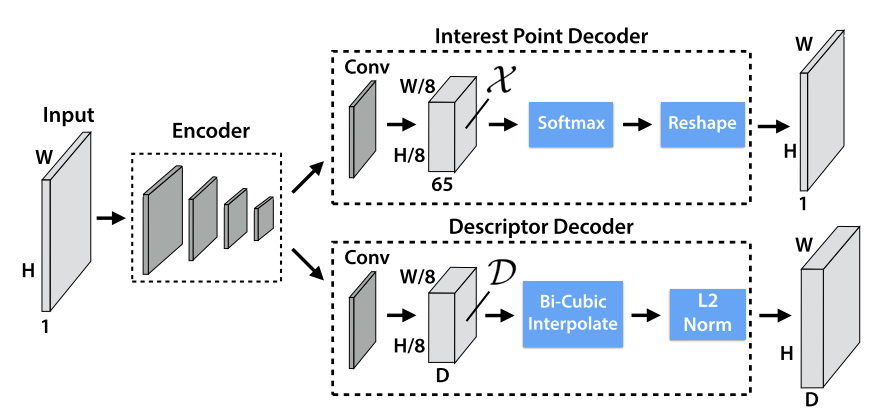
Figure 9. Superpoint Decoders [5]
3.4. D2-Net
The essence of D2-Net lies in the simultaneous generation of feature point locations and descriptors through a unified convolutional neural network (CNN), whose architecture is based on the VGG16 model, removing the fully-connected layer and focusing on feature extraction in the convolutional layer. By processing the feature map of the last convolutional layer, D2-Net realizes the joint learning of feature point detection and description (Figure 10 and figure 11) [6]. Compared with the classical algorithms SIFT and SURF, the dense descriptors generated by D2-Net provide richer information, which gives it an advantage when dealing with complex scenes, thus improving the accuracy and reliability of feature point detection. D2-Net's benefit over Superpoint, which employs a single network for detection and description while segregating these activities into distinct branches, is its capability to jointly generate feature point locations and descriptors via a unified network architecture. This design enables D2-Net to optimize the utilization of features retrieved from the convolutional layer and strengthen the correlation among these features, hence enhancing the quality of matching between feature points and descriptors. The main steps of feature point detection and matching in D2-Net are [6, 21]:
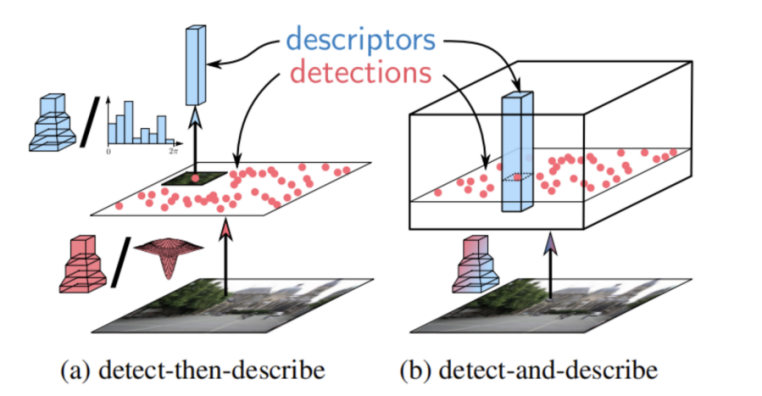
Figure 10. Comparison between different approaches for feature detection and description [6]
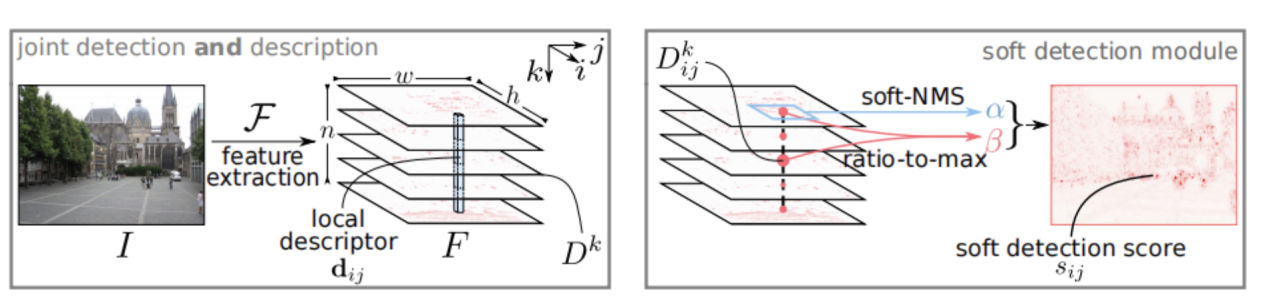
Figure 11. Proposed detect-and-describe (D2) network [6]
Feature Map Generation and Descriptor Extraction
The image I is fed into a convolutional neural network \( F \) to obtain a three-dimensional tensor \( F \) , \( F∈{R^{h×w×n}} \) . The descriptor \( {d_{ij}}={F_{ij}} \) is normalized:
\( {\hat{d}_{ij}}={d_{ij}}/||{d_{ij}}|{|_{2}} \) (8)
Feature point detection
Define the two-dimensional response \( {D^{k}} \) = \( {F_{::k}} \) , detect the feature points (i,j) by the local maximum condition , and compute the soft local maximum score \( α_{ij}^{k} \) :
\( α_{ij}^{k}=\frac{exp{(D_{ij}^{k})}}{\sum _{({i^{ \prime }},{j^{ \prime }})∈N(i,j)} exp(D_{{i^{ \prime }}{j^{ \prime }}}^{k})} \) (9)
Combined scores and normalization
Combining the local scores, define the overall score \( { γ_{ij}} \) :
\( {γ_{ij}}=\underset{k}{max} (α_{ij}^{k}β_{ij}^{k}) \) (10)
Normalization yields a soft detection score \( { s_{ij}} \) :
\( {s_{ij}}={γ_{ij}}/\sum _{({i^{ \prime }},{j^{ \prime }})} {γ_{{i^{ \prime }}{j^{ \prime }}}} \) (11)
Image Pyramid Construction
Construct an image pyramid \( { I^{ρ}} \) , extract feature maps at different resolutions, and fuse low-resolution features to high-resolution features:
\( {\widetilde{F}^{ρ}}={F^{ρ}}+\sum _{γ \lt ρ} {F^{γ}} \) . (12)
4. Experimentation
4.1. Image selection
In this study, three distinct image datasets will be used to compare the performance of image matching algorithms. Each dataset targets specific challenging scenarios, allowing for the evaluation of the algorithms' effectiveness under varying conditions.
First, images with repetitive patterns: This dataset tests the algorithm's performance when encountering repetitive structures. These images typically contain identical or similar textures, shapes, or color regions, providing an effective way to evaluate the robustness and accuracy of the algorithm (Figure 12).
|
|
|


Figure 12. Repeating pattern dataset example(Photo/Picture credit : Original)
Secondly, images with cluttered backgrounds: this dataset evaluates the algorithm's ability to match features in complex environments (Figure 13). These images contain detailed and noisy backgrounds that may interfere with feature extraction and matching, allowing for an assessment of the algorithm's stability in handling background interference.
|
|
|
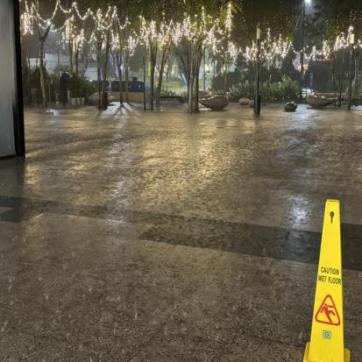
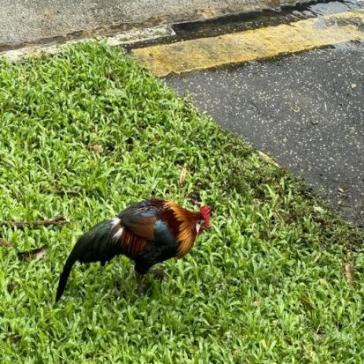

Figure 13. Clutter background dataset example (Photo/Picture credit : Original)
Finally, images of strong lighting: the dataset will be used to analyze the performance of the algorithms under strong lighting conditions (Figure 14). These images may have problems such as overexposure or shadows, and can effectively evaluate the algorithm's ability to adapt and accuracy under light changes.
|
|
|
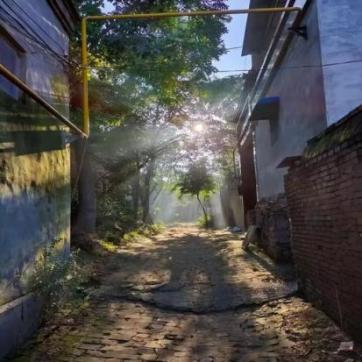


Figure 14. High light image dataset example (Photo/Picture credit : Original)
With these three aspects of dataset selection, this study aims to provide a more in-depth basis for analyzing the performance of image matching algorithms. Each dataset has been carefully selected to ensure that its features challenge the limitations of existing algorithms and provide guidance for future improvements.
4.2. Experimental setup
In this experiment, all input images were scaled to a uniform size (512 × 512 pixels) and grayscaled to ensure consistency in the processing. During the phase of keypoint detection, for the SIFT and SURF algorithms, the default detection thresholds were used and set to 0.04 and 400, respectively. for the Superpoint and D2-Net algorithms, their pre-trained models [22, 23] were used and the default parameters were not adjusted. For the feature matching algorithm, the Brute-Force Matcher (BFM) algorithm was used for feature point matching.
4.3. Evaluation metrics
To comprehensively evaluate the performance of the image matching algorithms (SIFT, SURF, Superpoint, and D2-Net), this study selects four key metrics: number of matching points, matching efficiency, average matching distance, and spatial distribution entropy. These metrics are widely used to assess matching performance and accuracy, providing a multi-perspective evaluation of the algorithms and a foundation for analyzing experimental results and optimizing the algorithms.
4.4. Analysis of experimental results
4.4.1. Experiment 1-Images with repeating patterns The experimental results (Figure 15, Figure 16 and Table 1) show that D2-Net performs well in feature extraction and matching efficiency, with the number of feature points of 1574 and 1913, respectively, and the matching efficiency reaches 40.83%, and the spatial distribution entropy is high (6.9853 and 7.1388), which indicates that its feature points are uniformly distributed to capture the complexity of the scene effectively. In the experimental images, the feature points of D2-Net are widely distributed and cover the key details in the images, especially in the repeated pattern scene.
In contrast, SURF achieves a matching efficiency of 33.60% and an average matching distance of just 0.29, indicating higher accuracy. However, its feature count and distribution uniformity are inferior to D2-Net. The experimental images reveal that SURF’s feature points are concentrated in specific areas, and while its accuracy is strong, the lack of uniform distribution impacts its performance in complex scenes. Both SIFT and Superpoint have relatively fewer features, with matching efficiency below 30%. The experimental images show sparse feature point distribution in complex scenes, limiting their coverage and applicability.
From an analytical perspective, D2-Net's superior performance is driven by its deep learning-based feature extraction, which captures complex image patterns and adapts well to challenging scenarios like repetitive patterns. In contrast, SURF, as a traditional algorithm, is less robust due to its reliance on hand-crafted features, though it achieves higher efficiency. SIFT and Superpoint fall behind D2-Net and SURF in both efficiency and accuracy, limited by their feature extraction methods.
Overall, D2-Net excels in repetitive pattern scenarios, while SURF strikes a better balance between accuracy and efficiency. The experimental graphs clearly demonstrate each algorithm's applicability across different scenarios, offering a solid basis for selection.
|
| ||
Figure 15. Example Test Images for the Repeating Pattern Dataset (Photo/Picture credit : Original) | |||
|
|
|
|
Feature Detection with SIFT on Repeating Pattern Images | Feature Detection with SURF on Repeating Pattern Images | ||
|
| ||
Feature Matching with SIFT on Repeating Pattern Images | Feature Matching with SURF on Repeating Pattern Images | ||
|
|
|
|
Feature Detection with Superpoint on Repeating Pattern Images | Feature Detection with D2-Net on Repeating Pattern Images | ||
|
| ||
Feature Matching with Superpoint on Repeating Pattern Images | Feature Matching with D2-Net on Repeating Pattern Images | ||
Figure 16. The result of feature detection and feature matching on the Repeating Pattern Dataset (Photo/Picture credit : Original) | |||
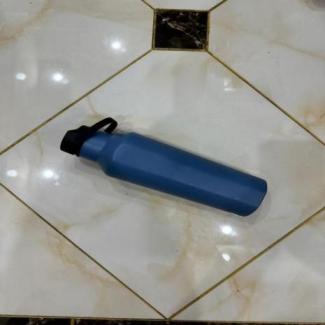

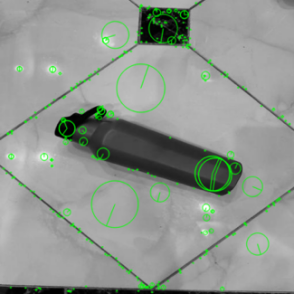

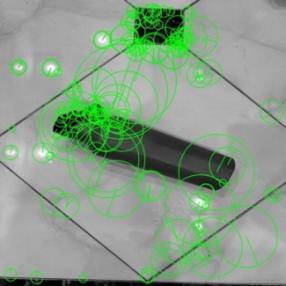
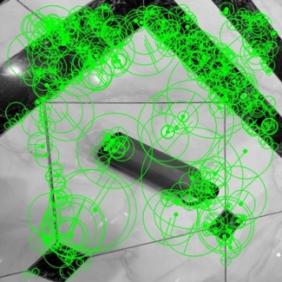
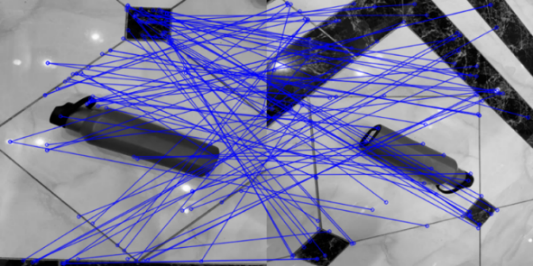
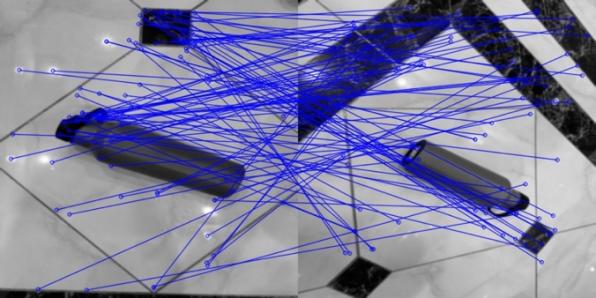
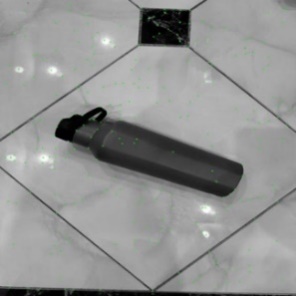

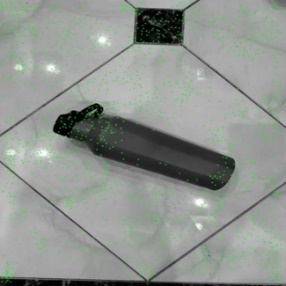
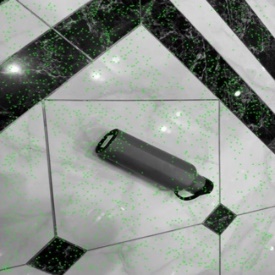
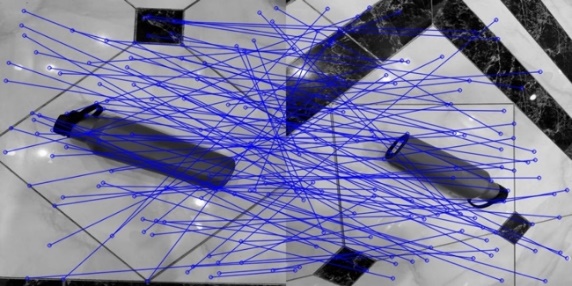
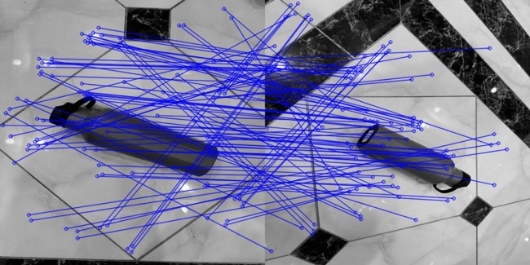
Table 1. Summary of SIFT, SURF, Superpoint, and D2-Net Performance on Repeating Pattern Images
Method | Features | Matches | Matching efficiency% | Average matching distance | Spatial distribution entropy |
SIFT | 314 | 107 | 17.95 | 203.42 | 3.7840 |
878 | 3.8774 | ||||
SURF | 148 | 105 | 33.60 | 0.29 | 3.3187 |
477 | 3.9278 | ||||
Superpoint | 261 | 97 | 32.28 | 0.84 | 4.2913 |
340 | 4.4083 | ||||
D2-Net | 1574 | 781 | 40.83 | 0.95 | 6.9853 |
1913 | 7.1388 |
4.4.2. Experiment 2 - Images with cluttered backgrounds The results (Figure 17, Figure 18 and table 2) show that SURF achieves the highest matching efficiency at 55.57%, with an average matching distance of 0.22, indicating strong accuracy. SuperPoint, while slightly more efficient (58.42%), extracts fewer features (465 and 449) compared to SURF, reflecting limitations in feature quantity. SIFT, despite extracting more features (1469 and 1985), has a lower efficiency of 40.13%, making it less suitable for complex scenes. D2-Net, with 45.57% efficiency, excels in feature quantity (2062 and 2342) and boasts the highest spatial distribution entropy (7.1541 and 7.2620), indicating a more even feature distribution. It captures complex structures well and offers broader coverage and robustness in challenging environments.
In summary, SURF excels in both efficiency and accuracy, making it ideal for cluttered scenes. SuperPoint maintains high efficiency despite fewer features, while D2-Net shines in feature distribution and complexity handling, though with slightly lower efficiency.
|
| ||
Figure 17. Example Test Images for the Clutter Background Dataset (Photo/Picture credit : Original) | |||
|
|
|
|
Feature Detection with SIFT on Clutter Background Images | Feature Detection with SURF on Clutter Background Images | ||
|
| ||
(c) Feature Matching with SIFT on Clutter Background Images | (d) Feature Matching with SURF on Clutter Background Images | ||
|
|
|
|
(e) Feature Detection with Superpoint on Clutter Background Images | (f) Feature Detection with D2-Net on Clutter Background Images | ||
|
| ||
(g) Feature Matching with Superpoint on Clutter Background Images | (h) Feature Matching with D2-Net on Clutter Background Images | ||
Figure 18. The result of feature detection and feature matching on the Clutter Background Dataset (Photo/Picture credit : Original) | |||
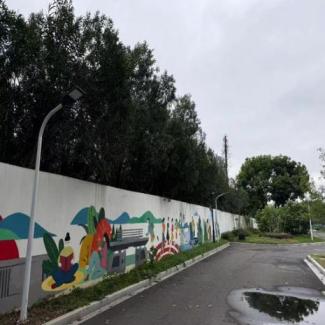
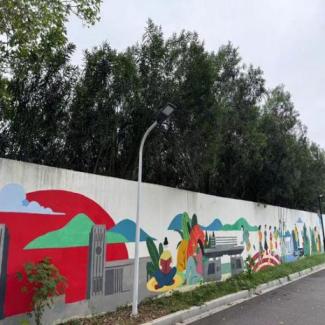
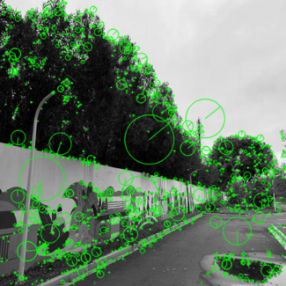
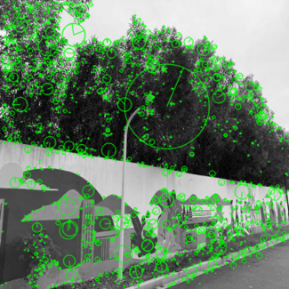
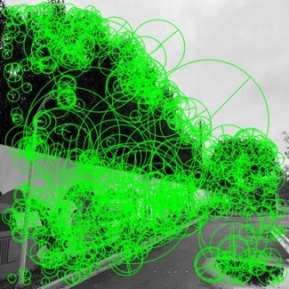
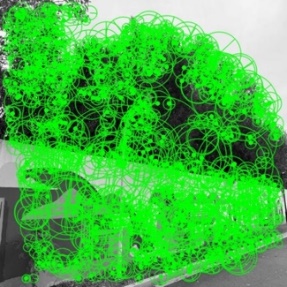
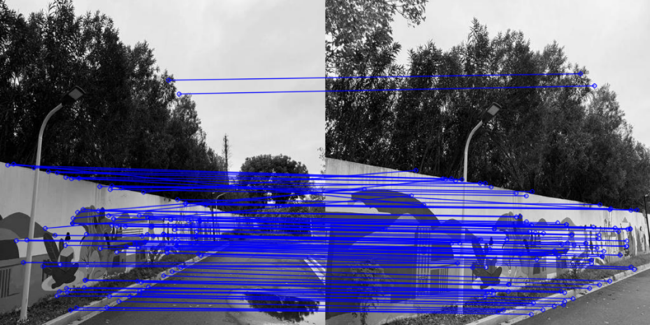
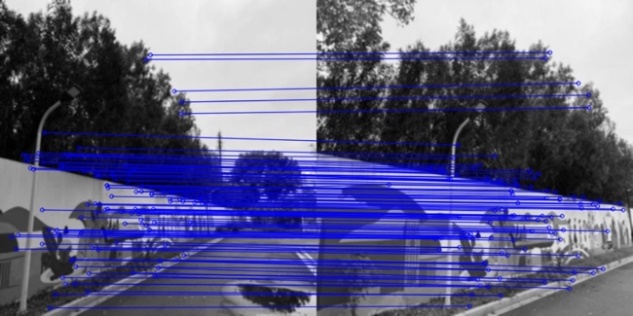
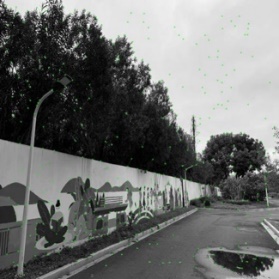
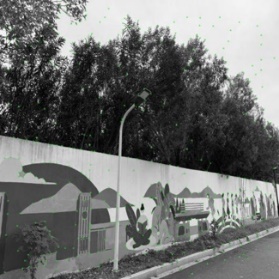
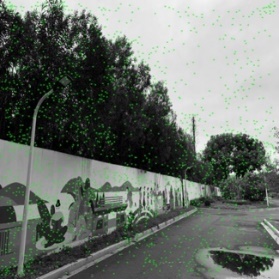
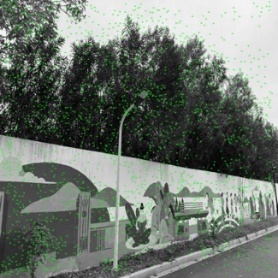
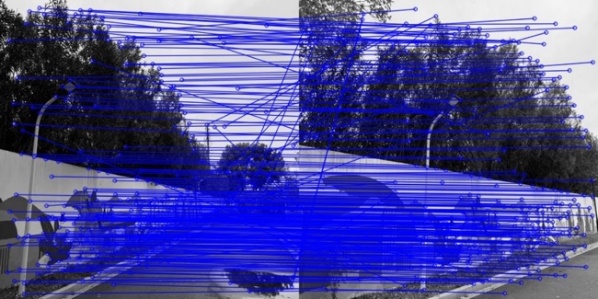
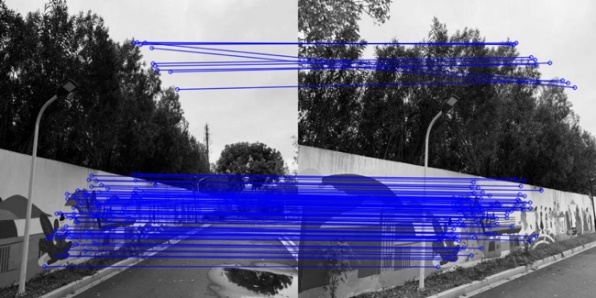
Table 2. Summary of SIFT, SURF, Superpoint, and D2-Net Performance on Clutter Background Images
Method | Features | Matches | Matching efficiency % | Average matching distance | Spatial distribution entropy |
SIFT | 1469 | 693 | 40.13 | 210.25 | 4.1215 |
1985 | 4.2910 | ||||
SURF | 904 | 606 | 55.57 | 0.22 | 4.1088 |
1277 | 4.3255 | ||||
Superpoint | 465 | 267 | 58.42 | 0.44 | 4.3293 |
449 | 4.2695 | ||||
D2-Net | 2062 | 1114 | 45.57 | 0.68 | 7.1541 |
2342 | 7.2620 |
4.4.3. Experiment 3-Images under strong light intensity The experimental results (Figure 19 ,Figure 20 and Table 3) show that D2-Net excels in the number of features (3007 and 2781) and the number of matches (1180), with a matching efficiency of 42.43%. Although its number of feature points is significantly higher than that of other algorithms, the average matching distance is 0.94, indicating that there is still room for improvement of D2-Net's matching accuracy in high light scenes.
In contrast, SURF has the highest matching efficiency of 45.43% and its average matching distance is 0.30, showing high accuracy and reliability in feature matching. The experimental result graphs also demonstrate the effective capture and accurate matching of key features by SURF in high light scenes.
In contrast, SIFT has lower matching efficiency (25.72%) and number of matches (409), reflecting its inadequate performance in dealing with complex scenes with strong illumination. Superpoint, although inferior to SURF and D2-Net in terms of the number of features and the number of matches, has a relatively high matching efficiency (31.67%), and the entropy of spatial distribution (4.5344 and 4.5056) indicates its advantage in the diversity and uniformity of feature point distribution. In the experimental graph, Superpoint extracts a wider distribution of features, but the limited number of matching points affects its overall performance.
In summary, SURF has the best overall performance under strong lighting conditions, especially leading in matching efficiency and accuracy. D2-Net still needs to be improved in matching accuracy despite its outstanding performance in the number of features extracted, while Superpoint has some advantages in feature distribution uniformity, which is suitable for scenarios that require extensive feature coverage.
|
| ||
Figure 19. Example Test Images for the High Light Image Dataset (Photo/Picture credit : Original) | |||
|
|
|
|
(a)Feature Detection with SIFT on High Light Images | (b) Feature Detection with SURF on High Light Images | ||
|
| ||
(c) Feature Matching with SIFT on High Light Images | (d) Feature Matching with SURF on High Light Images | ||
|
|
|
|
(e) Feature Detection with Superpoint on High Light Images | (f) Feature Detection with D2-Net on High Light Images | ||
|
| ||
(g)Feature Matching with Superpoint on High Light Images | (h)Feature Matching with D2-Net on High Light Images | ||
Figure 20. The result of feature detection and feature matching on High Light Images (Photo/Picture credit : Original) | |||


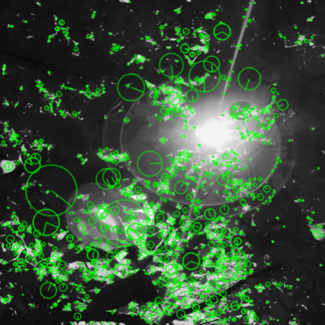
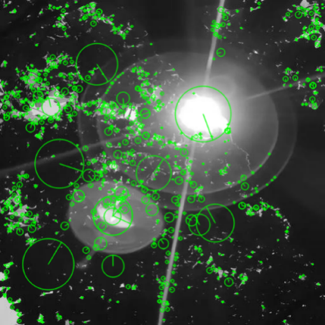
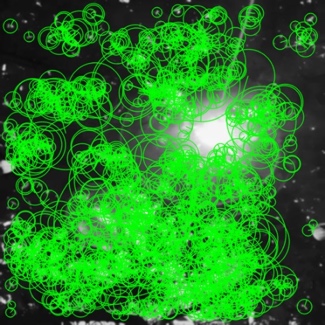
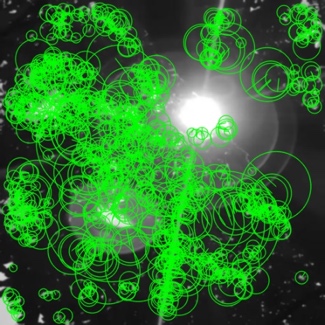
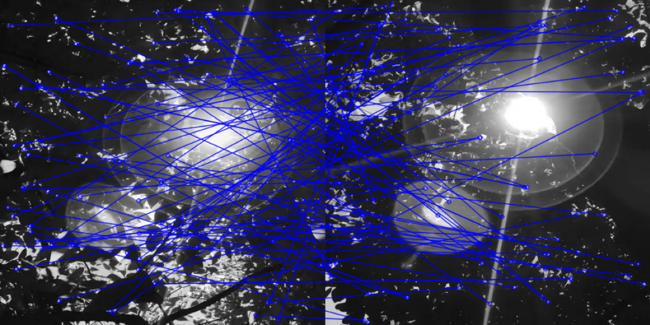
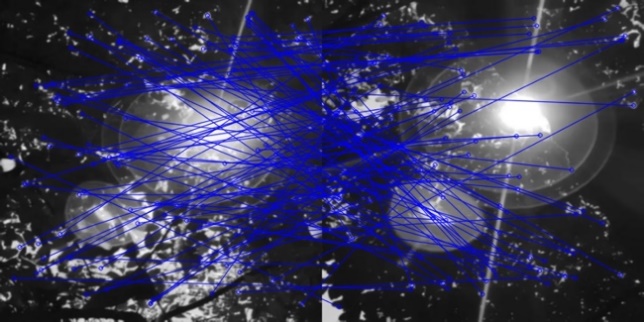

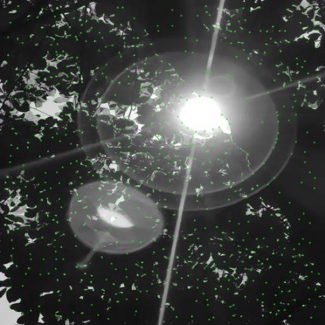
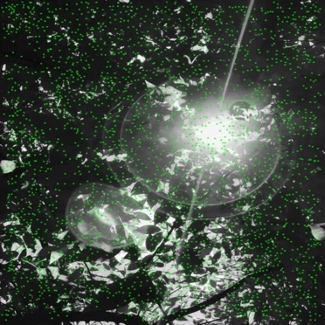
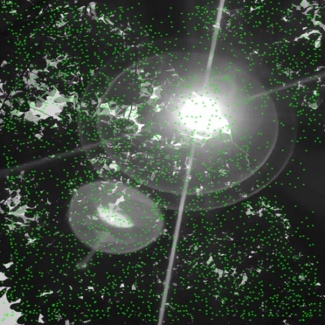
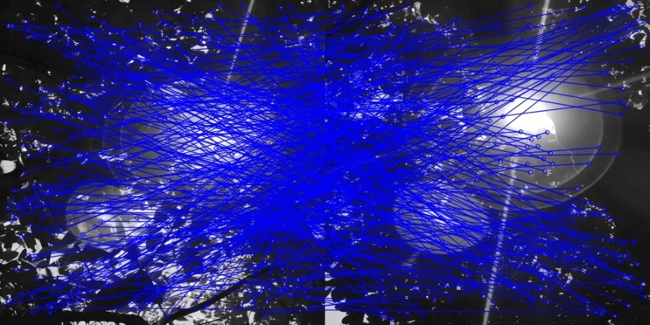
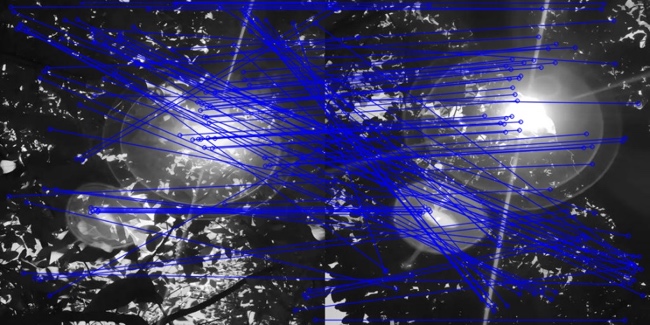
Table 3. Summary of SIFT, SURF, Superpoint, and D2-Net Performance on High Light Image Images
Method | Features | Matches | Matching efficiency % | Average matching distance | Spatial distribution entropy |
SIFT | 1959 | 409 | 25.72 | 265.12 | 4.2451 |
1222 | 4.0912 | ||||
SURF | 1222 | 457 | 45.43 | 0.30 | 4.2361 |
790 | 4.0602 | ||||
Superpoint | 1063 | 318 | 31.67 | 0.77 | 4.5344 |
945 | 4.5056 | ||||
D2-Net | 3007 | 1180 | 42.43 | 0.94 | 7.4401 |
2781 | 7.3855 |
5. Conclusion
This study systematically compares the efficacy of four methods for feature detection and description—SIFT, SURF, Superpoint, and D2-Net—under repetitive pattern backgrounds, cluttered backgrounds, and strong illumination conditions, evaluating their robustness and adaptability in different scenarios in depth. The practical performance of each algorithm and its limitations are thoroughly examined through multiple metrics of assessment, including the total amount of features, the amount of matches, matching efficiency, average matching distance, and spatial distribution entropy. The experimental results show that D2-Net performs well in most scenarios, especially in dealing with light changes and complex backgrounds, and demonstrates excellent feature extraction capability and high matching efficiency. In contrast, SURF and super point show higher matching efficiency and lower average matching distance under specific conditions, indicating that they are still competitive in some applications. SIFT, despite its stable performance in some scenarios, has a low overall matching efficiency, which restricts its applicability in complex applications.
This study shows that suitable algorithms should be selected for different application scenarios to optimize the accuracy and efficiency of image matching. Future research can further explore the combination of deep learning and traditional algorithms to optimize the feature extraction and description methods and maintain the efficiency of the algorithms in resource-constrained environments. In addition, the development of adaptive feature matching mechanism for the application of algorithms in dynamic scenes will be an important direction to be studied in depth.
References
[1]. Mousavian, A., Anguelov, D., Flynn, J., & Kosecka, J. (2017). 3d bounding box estimation using deep learning and geometry. In Proceedings of the IEEE conference on Computer Vision and Pattern Recognition (pp. 7074-7082).
[2]. Jiao, L., & Zhao, J. (2019). A survey on the new generation of deep learning in image processing. IEEE Access, 7, 172231-172263.
[3]. Sinha, R. K., Pandey, R., & Pattnaik, R. (2018). Deep learning for computer vision tasks: a review. arXiv preprint arXiv:1804.03928.
[4]. Paneru, S., & Jeelani, I. (2021). Computer vision applications in construction: Current state, opportunities & challenges. Automation in Construction, 132, 103940.
[5]. Mistry, D., & Banerjee, A. (2017). Comparison of feature detection and matching approaches: SIFT and SURF. GRD Journals - Global Research and Development Journal for Engineering, 2(4), 7-13.
[6]. DeTone, D., Malisiewicz, T., & Rabinovich, A. (2018). Superpoint: Self-supervised interest point detection and description. In Proceedings of the IEEE Conference on Computer Vision and Pattern Recognition Workshops (pp. 224-236).
[7]. DeTone, D., Malisiewicz, T., & Rabinovich, A. (2018). Superpoint: Self-supervised interest point detection and description. In Proceedings of the IEEE Conference on Computer Vision and Pattern Recognition Workshops (pp. 224-236).
[8]. Karami, E., Prasad, S., & Shehata, M. (2017). Image matching using SIFT, SURF, BRIEF and ORB: performance comparison for distorted images. arXiv preprint arXiv:1710.02726.
[9]. Panchal, P. M., Panchal, S. R., & Shah, S. K. (2013). A comparison of SIFT and SURF. International Journal of Innovative Research in Computer and Communication Engineering, 1(2), 323-327.
[10]. Tareen, S. A. K., & Saleem, Z. (2018). A comparative analysis of SIFT, SURF, KAZE, AKAZE, ORB, and BRISK. In 2018 International Conference on Computing, Mathematics and Engineering Technologies (iCoMET) (pp. 1-10). IEEE.
[11]. Bojanić, D., Bartol, K., Pribanić, T., et al. (2019). On the comparison of classic and deep keypoint detector and descriptor methods. In 2019 11th International Symposium on Image and Signal Processing and Analysis (ISPA) (pp. 64-69). IEEE.
[12]. Lowe, D. G. (1999). Object recognition from local scale-invariant features. In Proceedings of the Seventh IEEE International Conference on Computer Vision (pp. 1150-1157). IEEE.
[13]. Brown, M., & Lowe, D. G. (2007). Automatic panoramic image stitching using invariant features. International Journal of Computer Vision, 74, 59-73.
[14]. Bay, H., Tuytelaars, T., & Van Gool, L. (2006). SURF: Speeded up robust features. In Computer Vision–ECCV 2006: 9th European Conference on Computer Vision, Graz, Austria, May 7-13, 2006. Proceedings, Part I 9 (pp. 404-417). Springer Berlin Heidelberg.
[15]. Degadwala, S., Chakraborty, U., Kuri, P., et al. (2021). Real-Time Panorama and Image Stitching with SURF-SIFT Features. In 2021 6th International Conference on Inventive Computation Technologies (ICICT) (pp. 1111-1115). IEEE.
[16]. Singla, S., & Sharma, R. (2014). Medical image stitching using hybrid of SIFT & SURF techniques. International Journal of Advanced Research in Electronics and Communication Engineering (IJARECE), 3(8), 838-842.
[17]. Lipikorn, R., Cooharojananone, N., Kijsupapaisan, S., et al. (2014). Vehicle logo recognition based on interior structure using SIFT descriptor and neural network. In 2014 International Conference on Information Science, Electronics and Electrical Engineering (pp. 1595-1599). IEEE.
[18]. Valgren, C., & Lilienthal, A. J. (2010). SIFT, SURF & seasons: Appearance-based long-term localization in outdoor environments. Robotics and Autonomous Systems, 58(2), 149-156.
[19]. Dusmanu, M. (2024). d2-net. Retrieved from https://github.com/mihaidusmanu/d2-net
[20]. Otero, I. R. (2015). Anatomy of the SIFT Method (Master’s thesis). École Normale Supérieure de Cachan-ENS Cachan.
[21]. Oyallon, E., & Rabin, J. (2015). An analysis of the SURF method. Image Processing On Line, 5, 176-218.
[22]. Bay, H., Ess, A., Tuytelaars, T., et al. (2008). Speeded-up robust features (SURF). Computer Vision and Image Understanding, 110(3), 346-359.
[23]. Narayan, S., Cholakkal, H., Hayat, M., et al. (2021). D2-net: Weakly-supervised action localization via discriminative embeddings and denoised activations. In Proceedings of the IEEE/CVF International Conference on Computer Vision (pp. 13608-13617).
Cite this article
Zhou,H. (2024). Exploring Feature Detection: A Comparative Study of Classical and Deep Learning Methods Across Complex Scenes. Applied and Computational Engineering,105,57-73.
Data availability
The datasets used and/or analyzed during the current study will be available from the authors upon reasonable request.
Disclaimer/Publisher's Note
The statements, opinions and data contained in all publications are solely those of the individual author(s) and contributor(s) and not of EWA Publishing and/or the editor(s). EWA Publishing and/or the editor(s) disclaim responsibility for any injury to people or property resulting from any ideas, methods, instructions or products referred to in the content.
About volume
Volume title: Proceedings of CONF-MLA 2024 Workshop: Neural Computing and Applications
© 2024 by the author(s). Licensee EWA Publishing, Oxford, UK. This article is an open access article distributed under the terms and
conditions of the Creative Commons Attribution (CC BY) license. Authors who
publish this series agree to the following terms:
1. Authors retain copyright and grant the series right of first publication with the work simultaneously licensed under a Creative Commons
Attribution License that allows others to share the work with an acknowledgment of the work's authorship and initial publication in this
series.
2. Authors are able to enter into separate, additional contractual arrangements for the non-exclusive distribution of the series's published
version of the work (e.g., post it to an institutional repository or publish it in a book), with an acknowledgment of its initial
publication in this series.
3. Authors are permitted and encouraged to post their work online (e.g., in institutional repositories or on their website) prior to and
during the submission process, as it can lead to productive exchanges, as well as earlier and greater citation of published work (See
Open access policy for details).
References
[1]. Mousavian, A., Anguelov, D., Flynn, J., & Kosecka, J. (2017). 3d bounding box estimation using deep learning and geometry. In Proceedings of the IEEE conference on Computer Vision and Pattern Recognition (pp. 7074-7082).
[2]. Jiao, L., & Zhao, J. (2019). A survey on the new generation of deep learning in image processing. IEEE Access, 7, 172231-172263.
[3]. Sinha, R. K., Pandey, R., & Pattnaik, R. (2018). Deep learning for computer vision tasks: a review. arXiv preprint arXiv:1804.03928.
[4]. Paneru, S., & Jeelani, I. (2021). Computer vision applications in construction: Current state, opportunities & challenges. Automation in Construction, 132, 103940.
[5]. Mistry, D., & Banerjee, A. (2017). Comparison of feature detection and matching approaches: SIFT and SURF. GRD Journals - Global Research and Development Journal for Engineering, 2(4), 7-13.
[6]. DeTone, D., Malisiewicz, T., & Rabinovich, A. (2018). Superpoint: Self-supervised interest point detection and description. In Proceedings of the IEEE Conference on Computer Vision and Pattern Recognition Workshops (pp. 224-236).
[7]. DeTone, D., Malisiewicz, T., & Rabinovich, A. (2018). Superpoint: Self-supervised interest point detection and description. In Proceedings of the IEEE Conference on Computer Vision and Pattern Recognition Workshops (pp. 224-236).
[8]. Karami, E., Prasad, S., & Shehata, M. (2017). Image matching using SIFT, SURF, BRIEF and ORB: performance comparison for distorted images. arXiv preprint arXiv:1710.02726.
[9]. Panchal, P. M., Panchal, S. R., & Shah, S. K. (2013). A comparison of SIFT and SURF. International Journal of Innovative Research in Computer and Communication Engineering, 1(2), 323-327.
[10]. Tareen, S. A. K., & Saleem, Z. (2018). A comparative analysis of SIFT, SURF, KAZE, AKAZE, ORB, and BRISK. In 2018 International Conference on Computing, Mathematics and Engineering Technologies (iCoMET) (pp. 1-10). IEEE.
[11]. Bojanić, D., Bartol, K., Pribanić, T., et al. (2019). On the comparison of classic and deep keypoint detector and descriptor methods. In 2019 11th International Symposium on Image and Signal Processing and Analysis (ISPA) (pp. 64-69). IEEE.
[12]. Lowe, D. G. (1999). Object recognition from local scale-invariant features. In Proceedings of the Seventh IEEE International Conference on Computer Vision (pp. 1150-1157). IEEE.
[13]. Brown, M., & Lowe, D. G. (2007). Automatic panoramic image stitching using invariant features. International Journal of Computer Vision, 74, 59-73.
[14]. Bay, H., Tuytelaars, T., & Van Gool, L. (2006). SURF: Speeded up robust features. In Computer Vision–ECCV 2006: 9th European Conference on Computer Vision, Graz, Austria, May 7-13, 2006. Proceedings, Part I 9 (pp. 404-417). Springer Berlin Heidelberg.
[15]. Degadwala, S., Chakraborty, U., Kuri, P., et al. (2021). Real-Time Panorama and Image Stitching with SURF-SIFT Features. In 2021 6th International Conference on Inventive Computation Technologies (ICICT) (pp. 1111-1115). IEEE.
[16]. Singla, S., & Sharma, R. (2014). Medical image stitching using hybrid of SIFT & SURF techniques. International Journal of Advanced Research in Electronics and Communication Engineering (IJARECE), 3(8), 838-842.
[17]. Lipikorn, R., Cooharojananone, N., Kijsupapaisan, S., et al. (2014). Vehicle logo recognition based on interior structure using SIFT descriptor and neural network. In 2014 International Conference on Information Science, Electronics and Electrical Engineering (pp. 1595-1599). IEEE.
[18]. Valgren, C., & Lilienthal, A. J. (2010). SIFT, SURF & seasons: Appearance-based long-term localization in outdoor environments. Robotics and Autonomous Systems, 58(2), 149-156.
[19]. Dusmanu, M. (2024). d2-net. Retrieved from https://github.com/mihaidusmanu/d2-net
[20]. Otero, I. R. (2015). Anatomy of the SIFT Method (Master’s thesis). École Normale Supérieure de Cachan-ENS Cachan.
[21]. Oyallon, E., & Rabin, J. (2015). An analysis of the SURF method. Image Processing On Line, 5, 176-218.
[22]. Bay, H., Ess, A., Tuytelaars, T., et al. (2008). Speeded-up robust features (SURF). Computer Vision and Image Understanding, 110(3), 346-359.
[23]. Narayan, S., Cholakkal, H., Hayat, M., et al. (2021). D2-net: Weakly-supervised action localization via discriminative embeddings and denoised activations. In Proceedings of the IEEE/CVF International Conference on Computer Vision (pp. 13608-13617).