


1. Introduction
In today's new era, the popularization of mobile Internet and the vigorous development of the digital economy have had a profound impact on all walks of life. Telecom operators not only need to provide high-quality services, but also must continue to innovate to meet the increasing personalized needs of users [1]. At the same time, the telecom market is becoming more competitive [2]. Therefore, it is of great practical significance to carry out the research on user churn prediction to promote the sustainable development of the telecommunications industry.
Ref. [3] uses the Synthetic Minority Over-sampling Technique (SMOTE) algorithm, feature engineering, random forest model construction, and grid search method to find the optimal parameters, and constructs a random forest model that can predict user churn and take measures before users churn to effectively avoid user churn. Ref. [4] based on the deep learning Informer architecture and the introduction of the ensemble learning algorithm LightGBM, the Enhanced Informer Churn Prediction Model (EILAT-LGBM) was constructed and a personalized retention strategy was formulated based on this, which is helpful to improve user satisfaction and reduce churn rate. Ref. [5] used a large dataset to construct a model using different algorithms and an interpretable AI approach to illustrate the results of a customer churn prediction model, and the results showed that the random forest model performed best, and the study showed that the ensemble learning model not only validated its effect, but also helped to enhance consumer loyalty and improve the profitability of the organization, which has important strategic value.
This study analyzes the Telco Customer Churn dataset on the Kaggle platform and explores the attributes and behaviors of more than 7,000 users. In the data processing stage, the system was first cleaned, followed by preprocessing and feature engineering, so as to understand the user data more deeply and lay the foundation for the subsequent prediction model construction. In terms of model construction, the random forest algorithm was used in this study, and the performance of the model was comprehensively evaluated by various indicators such as precision, recall and F1-Score. Through repeated testing and optimization of the model, the model parameters were gradually adjusted to improve the accuracy and reliability of prediction. These insights provide strategic recommendations for telcos to develop more effective marketing strategies and user retention measures.
2. Research Methods
2.1. Introduction to datasets
The dataset used in this study, Telco Customer Churn, is a record of telecommunications companies providing telephone and Internet services to more than 7,000 subscribers in California. The dataset consists of 21 fields, and the explanations provided in the IBM Business Analytics Community are shown in Table 1:
Table 1. Dataset fields and their interpretation.
Serial number | Feature name | Feature interpretation |
1 | customerID | User identifier |
2 | gender | Gender |
3 | SeniorCitizen | Whether it is the elderly (1 represents yes) |
4 | Dependents | Is it financially independent (Yes or No) |
5 | tenure | User network time |
6 | PhoneService | Whether to open the telephone service (Yes or No) |
7 | MultipleLines | Whether to open multiple telephone services (Yes, No or No phoneservice) |
8 | InternetService | Whether to open the Internet service (No, DSL digital network or filber potic light network) |
9 | OnlineSecurity | Whether to open the network security service (Yes, No or No internetservice) |
10 | OnlineBackup | Whether to open the online backup service (Yes, No or No internetservice) |
11 | DeviceProtection | Whether to open the equipment protection service (Yes, No or No internetservice) |
12 | TechSupport | Whether to open the technical support business (Yes, No or No internetservice) |
13 | StreamingTV | Whether to open the network TV (Yes, No or No internetservice) |
14 | StreamingMovies | Whether to open the network movie (Yes, No or No internetservice) |
15 | PaperlessBilling | Contract signing method (by month, by year or two years) |
16 | PaperlessBilling | Whether to open the electronic billing (Yes or No) |
17 | PaymentMethod | Payment method (bank transfer, credit card, electronic check, mailed check) |
18 | MonthlyCharges | Monthly cost |
19 | TotalCharges | Total cost |
20 | Partner | Spouse presence (Yes or No) |
21 | Churn | Whether to away (Yes or No) |
2.2. Data preprocessing
2.2.1. Data cleaning. Analysis of the dataset revealed the data set without duplicate and missing values. As shown in Figure 1, the data set from the boxplot shows no obvious outliers.
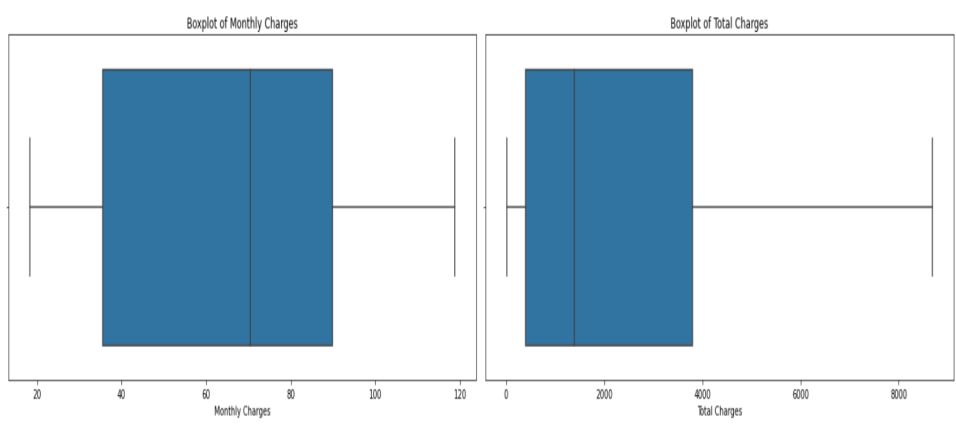
Figure 1. Boxplot of characteristic values.
2.2.2. Data type conversion. Many of the viewing data types are object types and need to meet the model building requirements [6]. After removing the useless user ID column, first change Churn as the label of the model to the category type. Then the monthly fee, total cost and user network duration are defined as continuous fields and converted to numerical types. The remaining fields are defined as discrete fields converted to a category type.
2.3. Preliminary analysis of variables
This study first quickly understood the customer loss situation by calculating the percentage of customer loss. The results showed that the percentage of lost customers was 26.54%, with a total of 1,869 customers. This indicates that there is an imbalance in the data, and oversampling is needed. The correlation coefficient between all features and labels was calculated, visualized as shown in Figure 2:
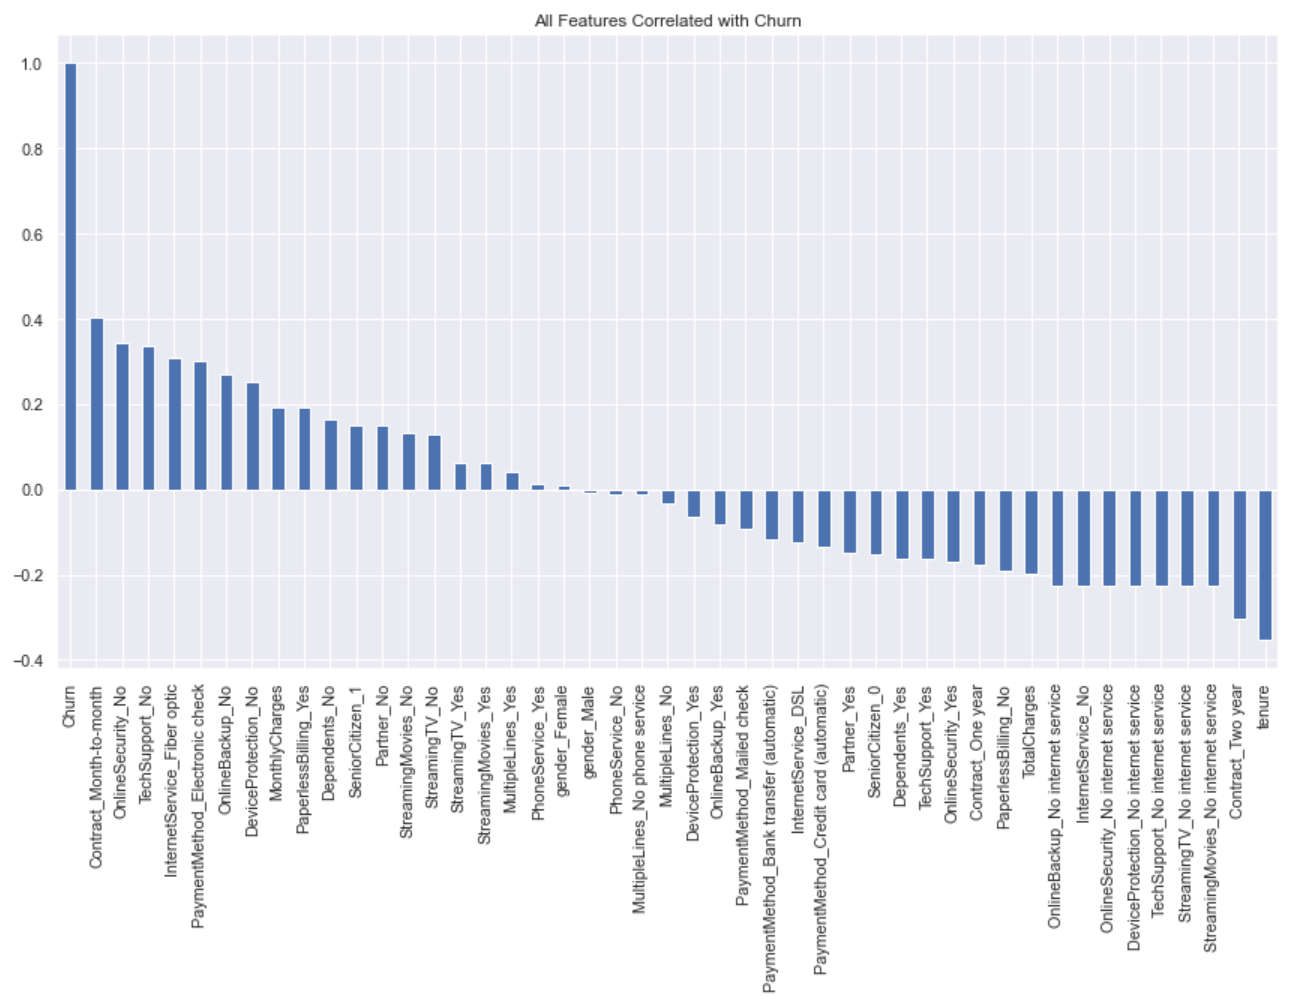
Figure 2. Correlation plot of traits with churn.
Through the analysis of the values of the features above and the comparison of the correlation coefficients, the conclusions of this study can be drawn as shown in Table 2:
Table 2. Feature selection and processing method.
Features that can be removed | gender、MultipleLines、StreamingMovies |
Features that may be the main factor | 'SeniorCitizen', 'Partner', 'Dependents', 'OnlineSecurity', 'OnlineBackup', 'DeviceProtection', 'TechSupport', 'StreamingTV', 'StreamingMovies', 'PaperlessBilling' As a 2-classification label. |
"Contract","InternetService", "Payment Method" Perform one-hot encoding | |
"MonthlyCharges", "TotalCharges and" tenure " are continuous fields, which need to be discretized before exclusive one-hot encoding |
2.4. Build the prediction model
2.4.1. Feature engineering. According to Table 2, the feature engineering was performed in this study. Almost irrelevant columns are first removed; then No internet service is classified as No based on logical relationships, so that more labels can be treated as dichotomous features. All dichotomy features were coded using LabelEncoder, and the dichotomous label data were converted to 0 and 1. Finally, the continuous fields were discretized by 6,4 and 4 quantiles, respectively, to transform the continuous variables into categorical variables. The remaining columns were exclusively encoded to convert the categorical variables into a combination of 0 and 1.
2.4.2. Model building. Divide all the columns of the data box into X and y. X is the feature matrix that contains all the columns in the data box df except the target variable Churn. Y is the target variable (label). Because of the imbalance between chapped and unchapped customer data, oversampling was performed using RandomOverSampler technology to bring the number of two samples close. 30% of the data were assigned to the test set, and the remaining 70% were used to train the model. Finally, RandomForest Classifier was used to build a random forest model [7].
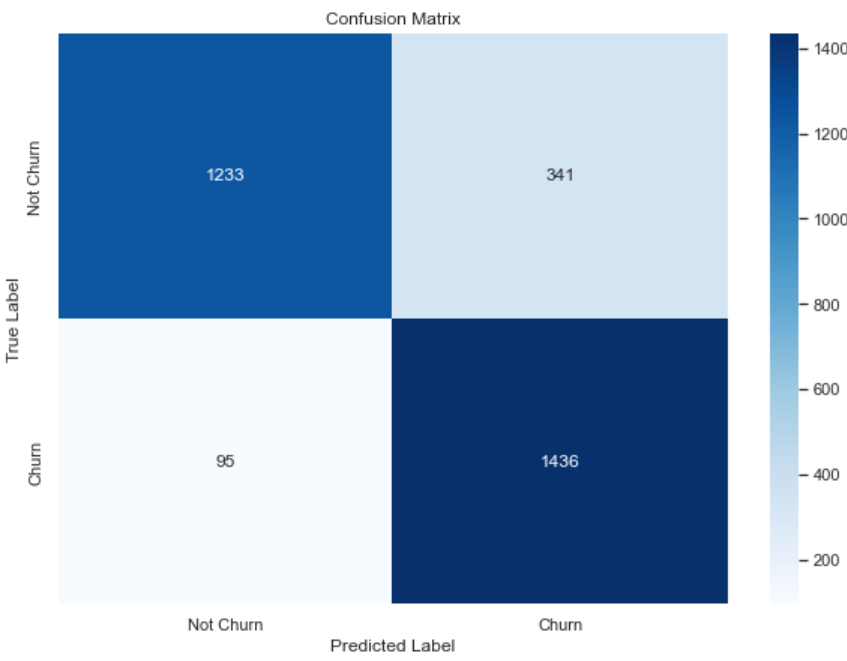
Figure 3. Model confusion matrix.
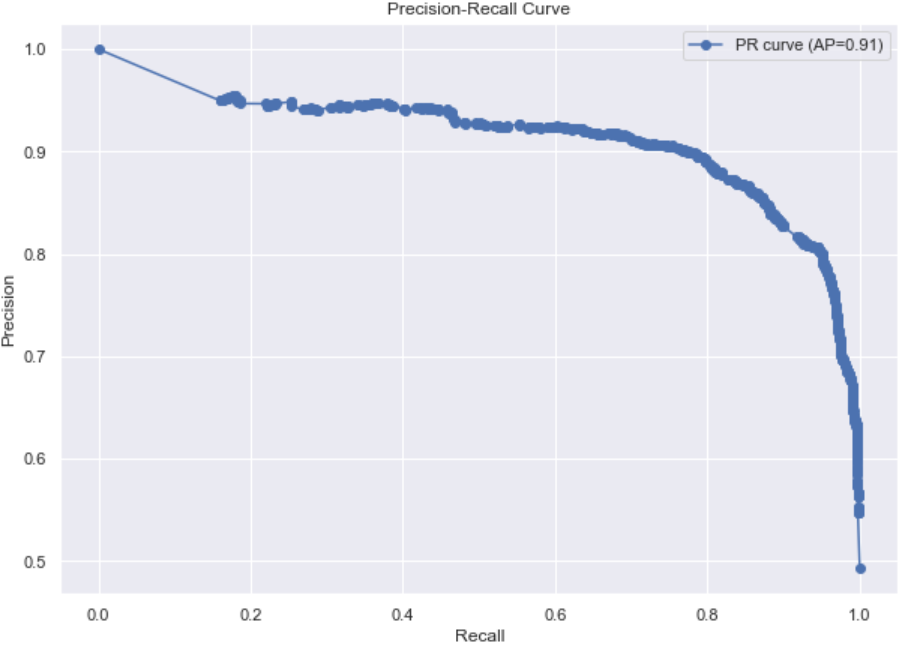
Figure 4. Model PR curve.
This study used a confusion matrix and PR curves to evaluate the model performance [8]. Figure 3 and Figure 4 are the confusion matrix and PR curve of the model. After analysis, the model performs well, but there is still room for improvement in the recall rate of unlost customers. This will become the key direction in the iterative optimization phase.
2.5. Iterative optimization
Set the model parameter range: the number of decision trees (50,100,200); the maximum depth of each tree (None, 10,20,30); the minimum number of samples required for internal nodes (2,5,10); the minimum number of samples required on leaf nodes (1,2,4); whether to use the self-service sampling method (True / False). All parameter combinations were tried and cross-verified using GridSearchCV, and finding the best combination of hyperparameters is shown in Table 3.
Table 3. The best combination of the hyperparameters.
Model parameter | The optimal value |
n_estimators | 100 |
max_depth | 20 |
min_samples_split | 2 |
min_samples_leaf | 1 |
bootstrap | False |
The model is optimized by continuously adjusting the predicted probability to a threshold of classification labels for parameters such as precision, recall and F1 score [9]. The final model has the highest accuracy at a threshold of 0.66. The classification report of the final optimized model is shown in Table 4:
Table 4. Model classification report.
precision | recall | f1-score | support | |
0 | 0.87 | 0.87 | 0.87 | 1574 |
1 | 0.87 | 0.86 | 0.87 | 1531 |
accuracy | 0.87 | 3105 | ||
macro avg | 0.87 | 0.87 | 0.87 | 3105 |
weighted avg | 0.87 | 0.87 | 0.87 | 3105 |
Accuracy Score: 0.869243156199678 | ||||
3. Experimental results
3.1. Identify the key attrition factors
The feature importance ranking [10] can be output through the best model and visualized as shown in Figure 5. The top five are: network access time, monthly contract signing, total cost, monthly cost and having a partner.
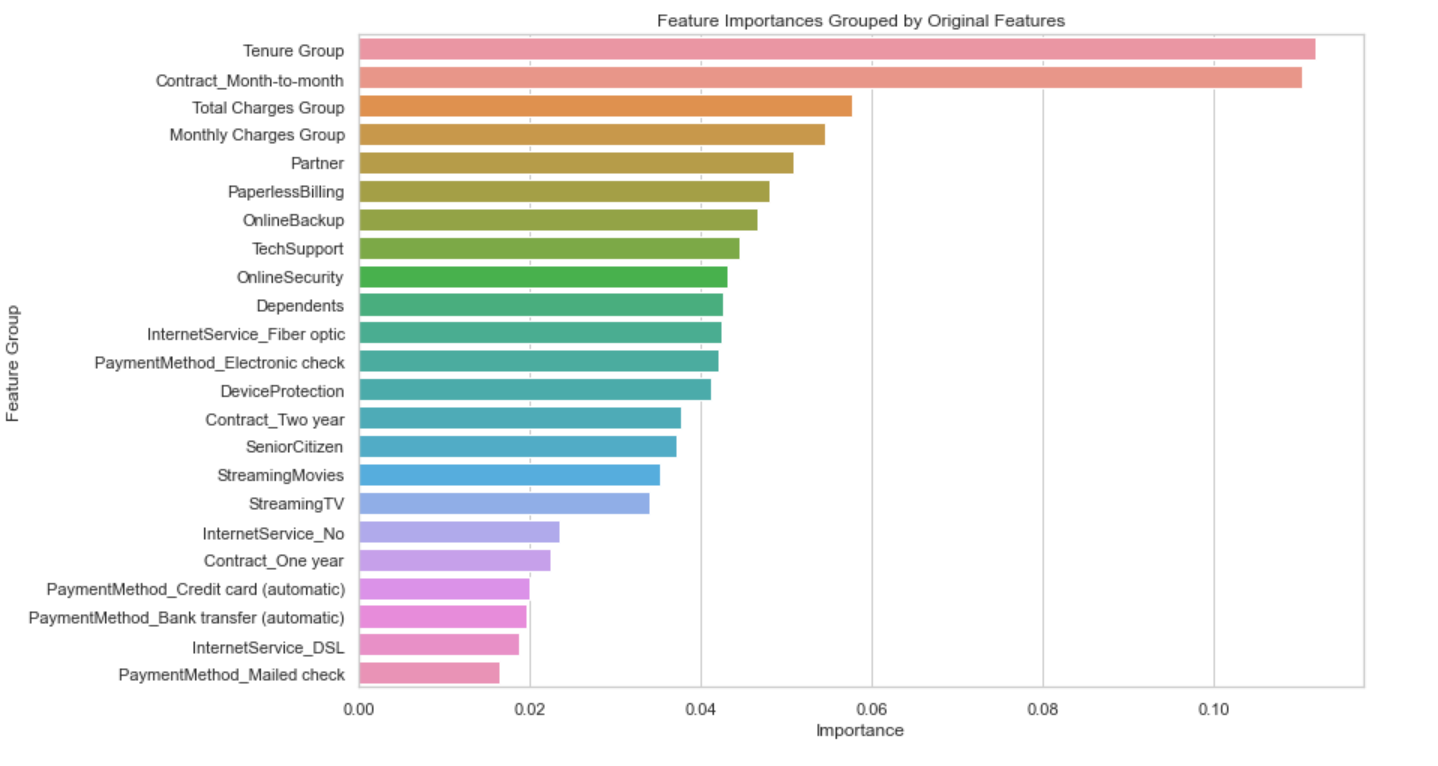
Figure 5. Visualization of the important features.
3.2. Give the results and give the suggestions
3.2.1. Analyze feature data. For the first important feature of data: tenure, it can be seen from Figure 6 that the less the users are in the network, the more likely they are to lose. Among them, the user turnover rate of 1-5 time units is the highest, almost reaching 50% or even more.
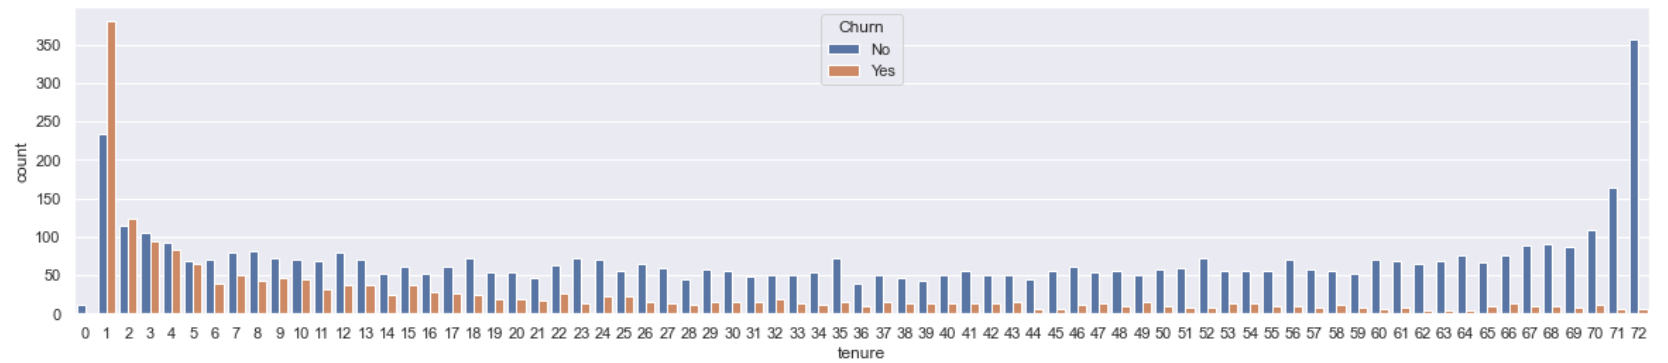
Figure 6. Diagram of user access duration and loss.
For the second important feature: Contract _ Month-to-month, monthly contracts have a great impact on the loss of users, and there are three types of contract signing: monthly, annual and two years. Therefore, this study can analyze and give suggestions.
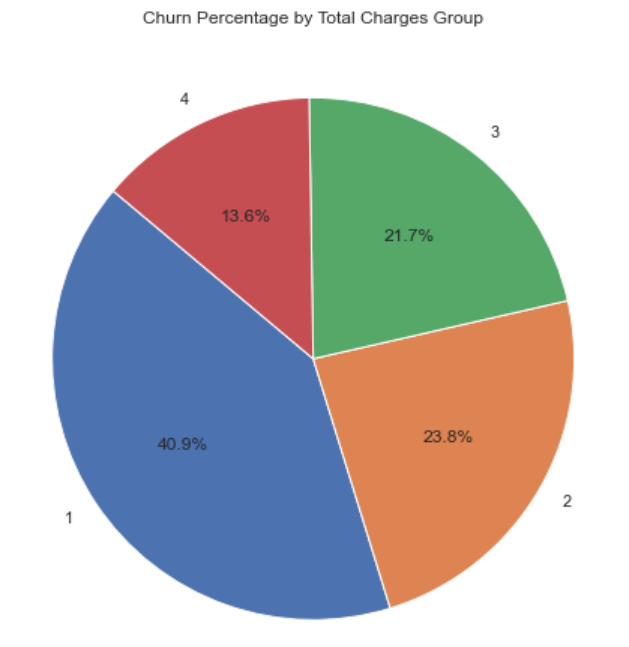
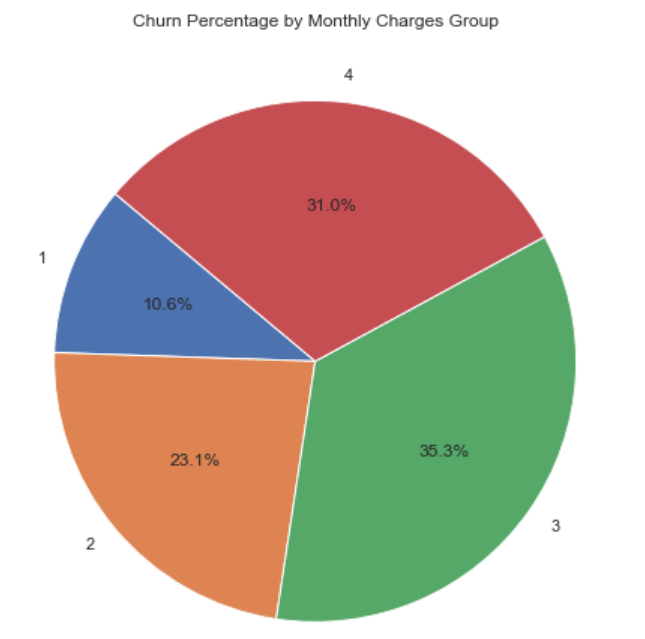
For the third and fourth important features: Total Charges and Monthly Charge, this study used pie charts to understand the customer turnover rate of different groups in monthly expenses and total expenses, as shown in Figure 7 and Figure 8. The interquartile limits of total expense grouping are 18,402,1397,3786; the interquartile limits of monthly expense grouping are 18.25,35.5,70.35 and 89.85 from pie chart, customers with total expenses of 18-402 yuan are easier to lose; customers with monthly expenses of 70.35-89.85 and 89.85-118.75 yuan are easier to lose.
|
| |
Figure 7. Customer attrition rate of different groups in the total expenses. | Figure 8. Customer turnover rate in different groups of monthly expenses. |
For the fifth important feature: Partner, this study analyzed the stacked bar graph of the turnover rate by the presence of partners, and Figure 9, concluded that customers without partners are more likely to lose.
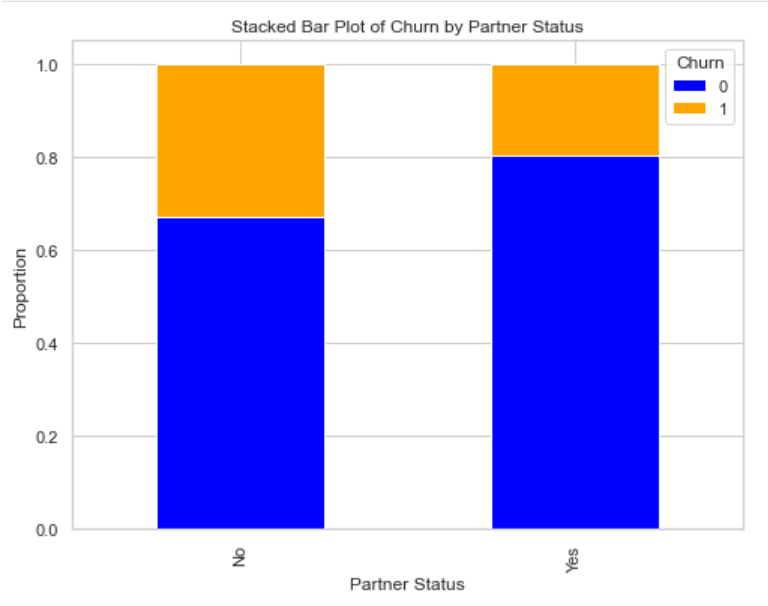
Figure 9. Stacked bar graphs of turnover rates by presence of a partner.
3.2.2. Research conclusion. Through the in-depth analysis of the Telco Customer Churn data set, this study successfully identified the main influencing factors of customer attrition and constructed an effective prediction model. The specific conclusions are drawn as follows:
1. Unbalanced customer loss: the proportion of lost customers is 26.54%, which is an obvious area of attention.
2. The length of the network is the key factor: the shorter the time of customers' access to the network, the significantly higher the turnover rate.
3. The impact of contract type is significant: customers who choose to sign contracts on a monthly basis have a high probability of loss, so long-term contracts will reduce the risk of loss to a certain extent.
4. The impact of monthly and total cost on the loss: the customers with high monthly cost and total cost are more likely to lose, especially the customer groups with low total cost should be paid attention to and support.
5. Association of partnership with attrition: High turnover of customers without a partner suggests that social support may play an important role in customer retention.
Combined with these findings, this study suggests effective measures to reduce customer attrition and improve customer satisfaction and loyalty.
3.2.3. Strategies and Suggestions. Based on the conclusions obtained from the above analyzed characteristic data, the suggested strategies given in this study are shown in Table 5:
Table 5. Table of strategy recommendations given based on feature analysis.
Feature | Measures name | Measures to describe |
tenure | Enhance the user experience and services | After users enter the network, one-to-one customer service support and use training bundle are launched to help users better understand and use the platform services |
Build a user growth and loyalty program | To design a multi-level golden bean system, users can get an exchange for various rewards or privileges each time they use the service or buy additional products | |
Contract_Month-to-month | Strengthen long-term contract incentives | Exclusive discounts, additional data traffic, lower monthly fees, or other benefits to users who choose long-term contracts |
Total Charges | Entry-level discount package | For customers with low total fees, offer entry-level discount packages, such as low-price packages but including basic services, to reduce the possibility of churn |
Monthly Charge | VIP serve | Launch VIP services for users with high monthly fees, such as priority customer service response, exclusive discounts, or experience of new services in advance, to improve their service experience and loyalty |
Partner | Launch a single carnival package | It offers entertainment packages designed for single users, including unlimited streaming services, VIP subscriptions for short video platforms, online music and audio books |
4. Conclusion
This study conducted an in-depth analysis around the customer loss problem in the telecommunication industry, mainly using the random forest classifier model to model and predict the Telco Customer Churn dataset. A final prediction accuracy of 86.92% was achieved by feature engineering and hyperparameter tuning. The study identified several key factors affecting customer loss, including customer access time, contract type, monthly and total cost, partnership, etc., which provide an important basis for telecom companies to develop targeted customer retention and satisfaction improvement strategies.
Despite some results in this study, there are still some shortcomings. First, the studied data samples were derived from specific telecommunications companies, which may limit the universality of the results, and subsequent studies recommend expanding the sample scope to verify the applicability of the conclusions. Secondly, in terms of models, this study mainly relied on random forest models and did not explore other models that might be more suitable, such as deep learning models, which limits the optimality of the results.
Future studies could test the generalizability of models and conclusions by integrating diverse data from different telecom companies. At the same time, exploring the use of multiple machine learning and deep learning models, especially model fusion techniques, may reveal more effective customer churn prediction scenarios. In conclusion, this study provides data support for improving customer retention and customer experience in the telecom industry, but further efforts in methods and data diversity are still needed to achieve more comprehensive theoretical and practical value.
References
[1]. Ahmad, K. A., Jafar, A., Aljoumaa, K. (2019). Customer churn prediction in telecom using machine learning and social network analysis in big data platform. CoRR, abs/1904.00690.
[2]. Joolfoo, A. B. M., Jugurnauth, A. R., Joolfoo, A. B. M. K. (2020). Customer Churn Prediction in Telecom Using Machine Learning in Big Data Platform. Journal of Critical Reviews,7(11):1991-2001.
[3]. Chen, J., Yu, J. B., Li, Y. B. (2021). Early warning study of user loss based on random forest. Precision manufacturing with automatic, (02): 21-24+51.DOI:10.16371/j.cnki.issn1009-962x.2021.02.005.
[4]. Huang, Z. Y. (2022). Research and application of user loss prediction model of private equity wealth management APP. University Of International Business and Economics, DOI:10.27015/d.cnki.gdwju.2022.000757.
[5]. Chang, V., Hall, K., Xu, A. Q. et al. (2024). Prediction of Customer Churn Behavior in the Telecommunication Industry Using Machine Learning Models. Algorithms, 17(6):231-.
[6]. Ye, Y. Y. (2021). Prediction and analysis of telecom user loss early warning model based on machine learning. Shandong University, DOI:10.27272/d.cnki.gshdu.2021.003537.
[7]. Sharmila, W., Aishwarya, A., Kishor, W. et al. (2024). Customer churn prediction in telecom sector using machine learning techniques. Results in Control and Optimization,14
[8]. Ahmad, K. A., Jafar, A., Aljoumaa, K. (2019). Customer churn prediction in telecom using machine learning in big data platform. Journal of Big Data,2019, 6(1): 1-24.
[9]. Cao, L. (2022). Study on telecom user loss prediction based on data mining. Shandong Normal University, DOI:10.27280/d.cnki.gsdsu.2022.001721.
[10]. Diao, C. R. (2024). Research on user loss prediction and retention strategy of Y telecom enterprises. Shandong University of Finance and Economics, DOI:10.27274/d. cnki.gsdjc.2024.001378.
Cite this article
Yang,Q. (2024). Telecom Platform Churn Prediction and Retention Strategies. Applied and Computational Engineering,114,7-15.
Data availability
The datasets used and/or analyzed during the current study will be available from the authors upon reasonable request.
Disclaimer/Publisher's Note
The statements, opinions and data contained in all publications are solely those of the individual author(s) and contributor(s) and not of EWA Publishing and/or the editor(s). EWA Publishing and/or the editor(s) disclaim responsibility for any injury to people or property resulting from any ideas, methods, instructions or products referred to in the content.
About volume
Volume title: Proceedings of the 2nd International Conference on Machine Learning and Automation
© 2024 by the author(s). Licensee EWA Publishing, Oxford, UK. This article is an open access article distributed under the terms and
conditions of the Creative Commons Attribution (CC BY) license. Authors who
publish this series agree to the following terms:
1. Authors retain copyright and grant the series right of first publication with the work simultaneously licensed under a Creative Commons
Attribution License that allows others to share the work with an acknowledgment of the work's authorship and initial publication in this
series.
2. Authors are able to enter into separate, additional contractual arrangements for the non-exclusive distribution of the series's published
version of the work (e.g., post it to an institutional repository or publish it in a book), with an acknowledgment of its initial
publication in this series.
3. Authors are permitted and encouraged to post their work online (e.g., in institutional repositories or on their website) prior to and
during the submission process, as it can lead to productive exchanges, as well as earlier and greater citation of published work (See
Open access policy for details).
References
[1]. Ahmad, K. A., Jafar, A., Aljoumaa, K. (2019). Customer churn prediction in telecom using machine learning and social network analysis in big data platform. CoRR, abs/1904.00690.
[2]. Joolfoo, A. B. M., Jugurnauth, A. R., Joolfoo, A. B. M. K. (2020). Customer Churn Prediction in Telecom Using Machine Learning in Big Data Platform. Journal of Critical Reviews,7(11):1991-2001.
[3]. Chen, J., Yu, J. B., Li, Y. B. (2021). Early warning study of user loss based on random forest. Precision manufacturing with automatic, (02): 21-24+51.DOI:10.16371/j.cnki.issn1009-962x.2021.02.005.
[4]. Huang, Z. Y. (2022). Research and application of user loss prediction model of private equity wealth management APP. University Of International Business and Economics, DOI:10.27015/d.cnki.gdwju.2022.000757.
[5]. Chang, V., Hall, K., Xu, A. Q. et al. (2024). Prediction of Customer Churn Behavior in the Telecommunication Industry Using Machine Learning Models. Algorithms, 17(6):231-.
[6]. Ye, Y. Y. (2021). Prediction and analysis of telecom user loss early warning model based on machine learning. Shandong University, DOI:10.27272/d.cnki.gshdu.2021.003537.
[7]. Sharmila, W., Aishwarya, A., Kishor, W. et al. (2024). Customer churn prediction in telecom sector using machine learning techniques. Results in Control and Optimization,14
[8]. Ahmad, K. A., Jafar, A., Aljoumaa, K. (2019). Customer churn prediction in telecom using machine learning in big data platform. Journal of Big Data,2019, 6(1): 1-24.
[9]. Cao, L. (2022). Study on telecom user loss prediction based on data mining. Shandong Normal University, DOI:10.27280/d.cnki.gsdsu.2022.001721.
[10]. Diao, C. R. (2024). Research on user loss prediction and retention strategy of Y telecom enterprises. Shandong University of Finance and Economics, DOI:10.27274/d. cnki.gsdjc.2024.001378.