


1. Introduction
Machine learning is a science based on computer science, mathematics, statistics, etc. Common types of algorithms in machine learning are supervised learning, unsupervised learning, reinforcement learning, and deep learning. Decision tree is an intuitive and easy to understand machine learning algorithm that can build a classification system based on the features of a sample. J.R. Quinlan gave a detailed description of the famous decision tree algorithm ID3 (Iterative Dichotomiser 3) back in 1984, and this method was first used to simulate the human decision-making process [1]. After decades of development, the effect of this algorithm has been significantly improved. Whether it is for the analysis of scientific data or its application in real life, decision trees are already a stable and reliable method. In addition to this, it is a core component of algorithms such as Random Forests and Gradient Boosting Machines. The reason why decision trees are easier to use than other machine learning models is because of their intuitiveness and transparency. Decision trees are consistent with human reasoning logic, so they are easy to understand [2]. Decision trees are not a "black box" model like deep neural networks. Their judgment conditions are clear and intuitive, and they can be expressed visually. These characteristics make the decision tree model highly interpretable and suitable for beginners who have just started studying machine learning. Besides, in some cases, the logic of the decision-making process is as important as the accuracy of the prediction results. For example, in the medical field, doctors want to use machine learning models to assist them in diagnosing diseases. If the model only gives a diagnosis result without a specific process, this model is obviously unreliable. However, decision trees can help doctors understand the logic of judging diseases through clear decision paths, so as to make more reliable and effective diagnoses.
Although decision trees have the above advantages, their limitations are also obvious. Decision trees do not require a lot of data, but noisy data often leads to model overfitting. If no intervention is done on the decision tree, it will overfit the training data [3]. In response to these shortcomings, people have made improvements to decision trees. In 2001, researchers in machine learning proposed the random forest method. This method builds multiple decision tree models based on decision trees, and each tree is trained on a random subsample. This can reduce the correlation between trees and achieve the purpose of reducing the risk of overfitting. This also makes random forests perform well when processing large amounts of data.
This paper aims to study the application of decision tree algorithm in actual classification tasks, mainly to classify mobile phone price data set through decision tree. The decision tree model was chosen for this study because it is highly logical and readable, making it ideal for someone who is new to machine learning for a short period of time. This study is important because categorizing things by their characteristics is a very common topic in real life applications. And the classification of cell phone prices is one of these popular topics, which is relevant to most people's lives. It also analyzes actual data to demonstrate the effectiveness and interpretability of decision tree algorithm in handling classification tasks in real life, and also analyzes the limitations of this method in practical applications.
2. Research Methods
The focus of this article is to classify the prices of mobile phones based on the features given the dataset and evaluate the performance of the model based on the calculated accuracy. First of all, understanding the principles and structure of decision trees is important for building models. Decision tree is often used to handle classification or regression tasks. It continuously divides the data set by judging conditions to obtain multiple smaller subsets and form a structure similar to an inverted tree. Although decision tree is powerful, this method is simple and easy to use [4]. In this tree structure, each node represents a feature, each branch represents a possible result of this feature, and the leaf represents the final classification or regression result. The ultimate goal of the decision tree is to make the child nodes after each division contain features of the same category as much as possible. Commonly used classification criteria include entropy, Gini impurity, etc. For the idea of this study, you can refer to this figure 1.
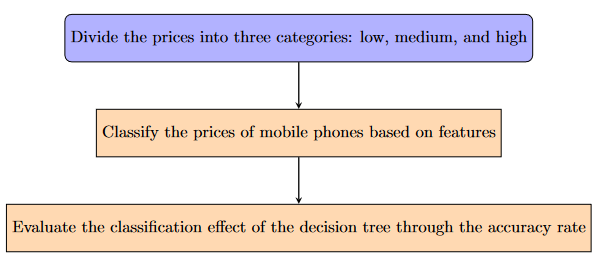
Figure 1. The idea of these research.
2.1. Data collection and processing
About data collection and preprocessing for this study. The original dataset before data cleaning contains 981 rows and 25 columns. However, this original dataset cannot be used directly because the features contain string values, and the decision tree cannot handle this type of value. Therefore, this value was deleted during data cleaning. In addition, there are many missing values in the original dataset. This study adopts the mode filling method for the missing values. The reason for choosing the majority will be explained in more detail in the Evaluation section below. After the above processing, there are still many features, but too many features will lead to overfitting of the model. PCA (Principal Component Analysis) is a commonly used and popular data dimensionality reduction technology, which performs well in high-dimensional data dimensionality reduction, feature extraction and data visualization. The purpose of this method is to represent some important information as a set of orthogonal variables called principal components [5]. The original data is projected into a new coordinate system through linear transformation, so that the variance can be explained to the greatest extent by the new coordinate axis. This dimensionality reduction method can reduce the features or dimensions of the classes in a given data set while retaining the unique capabilities of this data [6].
2.2. Algorithmic structure
Algorithm implementation is the core of building a decision tree model. This study is based on the construction of the decision tree model implementation in Python. The libraries used mainly include NumPy, Pandas, Matplotlib and sklearn. NumPy is mainly used for array operations and mathematical operations. Pandas is used for data reading and writing. Matplotlib is used to visualize the final results and draw charts. One of the most important libraries is sklearn, which involves partitioning the data set, grid search, building a decision tree classifier, and establishing a confusion matrix. These functions all play important roles in hyperparameter tuning, calculating accuracy rates, and visualizing the final results. Therefore, the algorithm structure of this study can be roughly divided into five parts. The first part is to import relevant libraries, the second step is to import data sets, the third step is hyperparameter tuning and PCA dimensionality reduction, the fourth step is decision tree visualization, and the fifth step is confusion matrix visualization and calculation of model classification accuracy.
2.3. Hyperparameter tuning
Hyperparameter tuning is the most important and time-consuming part of building a model. Hyperparameters are parameters that are set before a machine learning model is trained. These parameters cannot be obtained during training and define the architecture of the model [7]. The study of machine learning involves analyzing a range of possibilities to find the ideal model architecture with the best configuration. This process is called hyperparameter tuning [8]. The main purpose of hyperparameter tuning is to improve the performance and generalization ability of the model, reduce the risks of underfitting and overfitting, and thus improve the accuracy and reliability of the model. This study adjusted the hyperparameters by using grid search and cross validation. Grid search first finds a series of hyperparameter combinations in the preset values, and then evaluates different combinations. Cross validation can make full use of limited data to evaluate the performance of the model, thereby avoiding the model being too dependent on a certain data set partition. Therefore, after verification by the above method, the combination with the highest accuracy and the lowest error rate was selected as the best hyperparameter combination.
2.4. Model evaluation
Model evaluation is also a critical part of building a model. After adjusting the hyperparameters and model training of the decision tree, the performance of the model should be checked using the divided test set. This study mainly uses classification accuracy and visual confusion matrix as the basis for judgment. After these evaluations, the performance of the model can be made more reliable. This paper is unique in that it provides a very detailed description of the decision tree construction process, which can deepen the beginner's understanding of decision trees as a model.
3. Evaluation
This section will describe the experimental process of our research in more detail. First, since decision trees cannot handle string-type values, this study deleted all string-type values in the selected dataset. The original dataset before this processing has 981 rows and 25 columns, and the dataset after the deletion processing has 981 rows and 19 columns (a portion of the processed dataset is shown in the figure 2). After completing the above operations, this study imported the modified data set.
Table 1. Excerpts from the dataset.
price | rating | has_5g | has_nfc | has_ir_blaster | num_cores | processor_speed | battery_capacity |
54999 | 89 | TRUE | TRUE | FALSE | 8 | 3.2 | 5000 |
19989 | 81 | TRUE | FALSE | FALSE | 8 | 2.2 | 5000 |
16499 | 75 | TRUE | FALSE | FALSE | 8 | 2.4 | 5000 |
14999 | 81 | TRUE | FALSE | FALSE | 8 | 2.2 | 5000 |
24999 | 82 | TRUE | FALSE | FALSE | 8 | 2.6 | 5000 |
16999 | 80 | TRUE | TRUE | FALSE | 8 | 2.2 | 5000 |
3.1. PCA dimension reduction
The modified dataset contains 1 label and 18 features. However, the existing dataset still contains a lot of features, and too many features will lead to overfitting of the decision tree. Therefore, this study uses PCA to reduce the data dimension. This study hopes to obtain 5 principal components as the most characteristic through PCA dimension reduction. This research outputs the five principal components through a for loop and calculates the weight of each feature. The final result of the study based on PCA is shown in the figure 3.
Table 2. Excerpts from the results of PCA.
Principal_Component_1 | Principal_Component_2 | Principal_Component_3 | |
rating | -0.0003 | 0.0085 | 0.0251 |
has_5g | 0 | 0.0008 | 0.0015 |
has_nfc | 0 | 0.0006 | 0.0016 |
has_ir_blaster | 0 | -0.0001 | 0.0002 |
num_cores | 0.0002 | 0.0002 | 0.0003 |
processor_speed | 0 | 0.0006 | 0.0017 |
3.2. Overview of data processing and decision tree modeling setup
Before further processing, this research has used the Pandas library to convert the existing dataset in the form of a csv file into a data frame for subsequent processing. In this experiment, X is defined as a feature, y is defined as a label, and all feature values, label values and their column names are obtained by traversing. This operation can facilitate subsequent data analysis. For the missing values in these data, this study used the “SimpleImputer” function in “sklearn.impute”. By setting "strategy='most_frequent'", the mode can be used to fill the missing values. When dealing with missing values in classification problems, mode is usually used for filling [9]. When there are not many missing values in the data set, filling with the mode can represent the typical situation of the overall data. Next, this study defines a decision tree and sets the parameter "random_state" to 0. This parameter is used to control the random number generator. If this parameter is set to a fixed value, then each time the code is run to train the decision tree classifier, the random number generator will generate random numbers based on this fixed value. In addition, when running this code multiple times, the value of "random_state" will remain unchanged to obtain the same model structure and results.
3.3. Overview of cell phone price classification methods
Regarding how mobile phone prices should be classified into three categories: low, medium and high, this study defines a classification function and artificially specifies the left and right boundaries of the price classification as 25,000 and 100,000 Indian rupees respectively. Before manually specifying the boundaries, this study wanted to traverse the prices by nesting two for loops to obtain the best price classification boundaries. However, this method would cause the decision tree to classify most smartphone prices into the medium category. Although this method can achieve an accuracy of 96.43%, it does not conform to the actual situation. So, we finally chose to manually define a fixed price classification boundary.
3.4. Hyperparameter optimization and cross-validation
For finding the best hyperparameters using GridSearch, this research has set several options for hyperparameters. It is also initialized that the best accuracy is set to negative infinity so that the accuracy can be calculated later. When dividing the training set and the test set, this research set the size to 0.2, which means that the training set accounts for 80% and the test set accounts for 20%. In the process of cross-validation, this study tried multiple partitioning methods and compared the differences in accuracy. When only the parameter "cv" was changed, the classification accuracy of the models corresponding to different "cv" was compared. When cv=4, 5, or 6, the accuracy was 85.71%. When cv=3 and 7, the accuracy was 84.18% and 83.67% respectively. Therefore, when cv=4, 5, or 6, the ideal accuracy can be obtained.
3.5. Optimal hyperparameters
After the above processing, the best hyperparameters obtained in this study are as follows: 'max_depth': 5, 'min_samples_leaf': 2, 'min_samples_split': 10. Among them, "max_depth" refers to the maximum tree depth of the decision tree, "min_samples_leaf" refers to the minimum number of samples contained in each leaf node, and "min_samples_split" refers to the minimum number of samples required for each node to split.
3.6. Visualization of decision tree output
Finally, this study used the "export text" function to visualize the decision tree. This operation clearly shows the conditions required for each node of the decision tree to split, proving that the decision tree is readable. In addition, the confusion matrix is a clear and easy-to-understand means of judging the results of the decision tree. After the matrix is visualized, only the values on the diagonal are correctly judged by the decision tree. This study evaluates the final performance of the model through the confusion matrix and calculates the accuracy. The accuracy of this decision tree classifier is 85.2%. The model of this decision tree classifier performs well for the selected dataset and the final results are shown in figure 4.
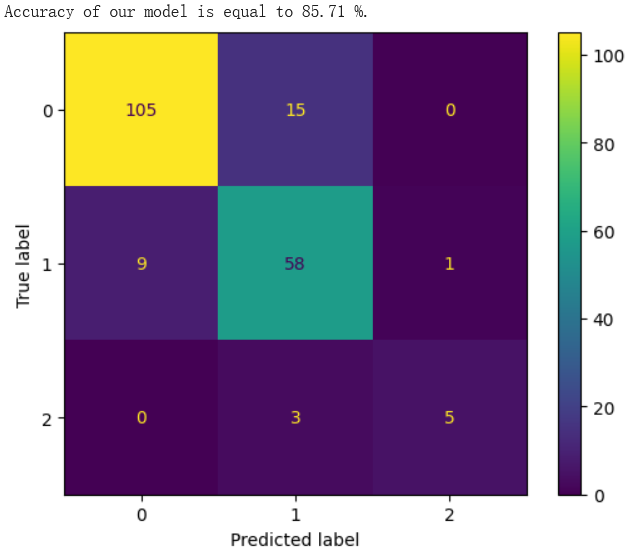
Figure 2. Results of decision tree.
4. Conclusion
This paper comprehensively and meticulously explores the application of decision trees in the practical problem of mobile phone price classification. It also provides a full introduction to the algorithm and experiments. For those who are new to machine learning, this paper provides a good guide for building models. Using PCA for data dimensionality reduction is an important part of this study. In classification problems, PCA can make the model focus on important features and avoid being disturbed by noise. Experiments have shown that this method can improve the accuracy of the decision tree classification model compared to manual feature screening. In addition, data preprocessing is also an important way to improve model performance. Compared with using the mean and median to fill in missing values in the data set, using the median to fill in missing values can make the model more accurate. It can be seen that filling missing values with the mode may be a more reasonable approach in classification problems. This study also highlights the significance of hyperparameter tuning in machine learning model building. Using GridSearch to help this process is a more efficient approach than manually adjusting hyperparameters.
4.1. Overview of research limitations
In addition, this study also has many shortcomings that deserve discussion. First of all, the data set is the core of the machine learning model, and the final performance of a model is largely affected by the quality of the data set. After data cleaning, this data set contains 979 samples, including 783 training data and 196 test data. Relatively speaking, the data set of this study is relatively small. This will also lead to many problems, such as: it may cause the model to overfit, the data lacks representativeness, and cannot fully explain the performance of the model. In future research, choosing a large data set is a better choice. Besides, although in this study, using the mode to fill missing values has a better effect than the median and mean, using the mode to fill may only be suitable for situations where there are not many missing values. If the data set has many samples and the number of missing values is also large, using the mode to fill may not be an ideal solution. Finally, PCA also has certain limitations. After PCA processing, the output is the original features after linear combination, which leads to a decrease in the interpretability of the decision tree and is not easy for users to understand. This method will also cause unavoidable data loss, especially when the number of principal components retained is small. In addition, since the data set used in this experiment is a small sample data set, this may cause problems when PCA calculates the covariance matrix, affecting the final effect.
4.2. Research summary and outlook
In summary, this study emphasizes the importance of decision trees as the basis of classification models in machine learning, and also describes the general structure of building decision trees. PCA and data cleaning methods are also mentioned. It allows readers to quickly grasp the ideas of building machine learning models. The topic of this study focuses on the classification of mobile phone prices, which is very practical. However, the limitations of this study are also worthy of attention. Future research should look for alternative methods to make up for the above-mentioned deficiencies. Finding more efficient and reliable models is also one of the main research goals of machine learning.
References
[1]. Quinlan, J.R., 1986. Induction of decision trees. Machine learning, 1, pp.81-106.
[2]. Kotsiantis, S.B., 2013. Decision trees: a recent overview. Artificial Intelligence Review, 39, pp.261-283.
[3]. Costa, V.G. and Pedreira, C.E., 2023. Recent advances in decision trees: An updated survey. Artificial Intelligence Review, 56(5), pp.4765-4800.
[4]. De Ville, B., 2013. Decision trees. Wiley Interdisciplinary Reviews: Computational Statistics, 5(6), pp.448-455.
[5]. Abdi, H. and Williams, L.J., 2010. Principal component analysis. Wiley Interdisciplinary Reviews: Computational Statistics, 2(4), pp.433-459.
[6]. Bruni, V., Cardinali, M.L. and Vitulano, D., 2022. A short review on minimum description length: An application to dimension reduction in PCA. Entropy, 24(2), p.269.
[7]. Kuhn, M. and Johnson, K., 2013. Applied Predictive Modeling.
[8]. Feurer, M. and Hutter, F., 2019. Hyperparameter optimization. Automated machine learning: Methods, systems, challenges, pp.3-33.
[9]. Farhangfar, A., Kurgan, L.A. and Pedrycz, W., 2007. A novel framework for imputation of missing values in databases. IEEE Transactions on Systems, Man, and Cybernetics-Part A: Systems and Humans, 37(5), pp.692-709.
Cite this article
Du,L. (2024). The Classification of Mobile Phone Prices Based on Decision Tree. Applied and Computational Engineering,114,116-122.
Data availability
The datasets used and/or analyzed during the current study will be available from the authors upon reasonable request.
Disclaimer/Publisher's Note
The statements, opinions and data contained in all publications are solely those of the individual author(s) and contributor(s) and not of EWA Publishing and/or the editor(s). EWA Publishing and/or the editor(s) disclaim responsibility for any injury to people or property resulting from any ideas, methods, instructions or products referred to in the content.
About volume
Volume title: Proceedings of the 2nd International Conference on Machine Learning and Automation
© 2024 by the author(s). Licensee EWA Publishing, Oxford, UK. This article is an open access article distributed under the terms and
conditions of the Creative Commons Attribution (CC BY) license. Authors who
publish this series agree to the following terms:
1. Authors retain copyright and grant the series right of first publication with the work simultaneously licensed under a Creative Commons
Attribution License that allows others to share the work with an acknowledgment of the work's authorship and initial publication in this
series.
2. Authors are able to enter into separate, additional contractual arrangements for the non-exclusive distribution of the series's published
version of the work (e.g., post it to an institutional repository or publish it in a book), with an acknowledgment of its initial
publication in this series.
3. Authors are permitted and encouraged to post their work online (e.g., in institutional repositories or on their website) prior to and
during the submission process, as it can lead to productive exchanges, as well as earlier and greater citation of published work (See
Open access policy for details).
References
[1]. Quinlan, J.R., 1986. Induction of decision trees. Machine learning, 1, pp.81-106.
[2]. Kotsiantis, S.B., 2013. Decision trees: a recent overview. Artificial Intelligence Review, 39, pp.261-283.
[3]. Costa, V.G. and Pedreira, C.E., 2023. Recent advances in decision trees: An updated survey. Artificial Intelligence Review, 56(5), pp.4765-4800.
[4]. De Ville, B., 2013. Decision trees. Wiley Interdisciplinary Reviews: Computational Statistics, 5(6), pp.448-455.
[5]. Abdi, H. and Williams, L.J., 2010. Principal component analysis. Wiley Interdisciplinary Reviews: Computational Statistics, 2(4), pp.433-459.
[6]. Bruni, V., Cardinali, M.L. and Vitulano, D., 2022. A short review on minimum description length: An application to dimension reduction in PCA. Entropy, 24(2), p.269.
[7]. Kuhn, M. and Johnson, K., 2013. Applied Predictive Modeling.
[8]. Feurer, M. and Hutter, F., 2019. Hyperparameter optimization. Automated machine learning: Methods, systems, challenges, pp.3-33.
[9]. Farhangfar, A., Kurgan, L.A. and Pedrycz, W., 2007. A novel framework for imputation of missing values in databases. IEEE Transactions on Systems, Man, and Cybernetics-Part A: Systems and Humans, 37(5), pp.692-709.