


1. Introduction
With the continuous evolution of financial markets, the characteristics of the stock and bond markets—such as the diversity of involved entities, wide-reaching influence, and strong risk interlinkages—have garnered increasing attention across sectors due to their powerful interactions. Since the onset of the U.S.-China "trade war" in 2018 and the outbreak of the COVID-19 pandemic in 2019, instability in China's financial market has surged, highlighting the tail risk concerns within both stock and bond markets[1]. The price linkages among assets like stocks and bonds have grown stronger.
With advancements in computer and artificial intelligence technologies, an increasing number of scholars are using deep learning methods to study and understand the risk linkages and predictive mechanisms between stock and bond markets. Domestic and international scholars have applied various statistical and econometric methods to stock market research, such as multiple regression analysis, exponential smoothing, the autoregressive integrated moving average (ARIMA) model, and the generalized autoregressive conditional heteroskedasticity (GARCH) model [2]. In order to address the issues of excessive "noise" in financial market data, which leads to overfitting, and the limitations of traditional financial models that mostly rely on linear predictions, making it difficult to study stock market volatility and bond risk, this paper will utilize deep learning to construct more scientific predictive models.Specifically, we employ four models—XGBOOST, Random Forest, GRU, and LSTM—to predict stock price volatility, aiming to uncover the interrelations between the corporate stock and bond markets and the underlying economic mechanisms. This approach offers a new way for risk monitoring and early warning.
2. Risk Linkage between the Stock and Bond Markets
The financial market generally refers to a system formed through the trading of financial assets, resulting in corresponding supply and demand relationships and mechanisms [3]. Nowadays,stocks and bonds have become two of the most favored financial products among investors.
Generally, the stock market can reflect a country's economic conditions in advance, while the bond market, due to its low-risk characteristics, holds a very important position as a safe-haven asset [4]. Consequently, as global financial markets become increasingly integrated, the resonance effect in asset prices has become more pronounced.
Theoretically, the interlinkage between stock and bond markets can be explained from multiple perspectives. First, drastic fluctuations in stock prices directly impact corporate financing capabilities and investor wealth. Therefore, when a company’s stock price plummets, it may face margin calls and other requirements, making bond financing more difficult and increasing default risk.
Furthermore, as information flows freely between markets, investors can promptly capture and respond to this information, which significantly influences both stock and bond markets. For example, when a company's stock price is extremely impacted, it may trigger investor panic, thereby exacerbating stock market volatility. At the same time, the spread of credit risk easily fosters irrational market sentiment , leading investors to misjudge asset values and blindly sell stocks, further amplifying price fluctuations of stock assets [5].
Additionally, Prokasyan and Yin highlighted a bidirectional predictive relationship between stock and bond market returns [6]. Stock market returns can provide an early warning signal before changes in the bond credit market, indicating a lead-lag relationship between the two. Therefore, there is a significant linkage characteristic between the stock market and the securities market.
3. Deep Learning Models and Stock Price Prediction
Due to the high complexity, non-linear constraints, and complex time-series characteristics of financial data, using deep learning models can better combat the issues of "noise" and overfitting in data. In predicting prices of financial market products such as stocks and foreign exchange, numerous scholars domestically and internationally have employed knowledge from various disciplines to construct models for research. Researchers like G. Peter Zhang, Shen Furao, and Kuremoto Takashi have used continuous restricted Boltzmann machines to build enhanced deep belief networks and applied the proposed models to forecast the foreign exchange market, finding that the proposed model provides better predictive accuracy compared to traditional feedforward neural network models [5].
The advantage of deep learning models in stock price prediction also lies in their ability to effectively integrate multiple data sources. For example, various types of data, such as historical stock trading data, commodity prices, and macroeconomic indicators, can be used as inputs and uniformly modeled through a deep learning network. This allows the model to go beyond a single data source and comprehensively consider multiple influencing factors, improving the accuracy and stability of the prediction results. Additionally, by adjusting the network structure and hyperparameters of the model, deep learning models can continuously adapt to market changes, demonstrating strong generalization capability and robustness.
Therefore, this paper compares the predictive performance of four models—SGBOOST, random forest, GRU, and LSTM—to provide investors with a more scientific basis for decision-making.
4. Research Design
4.1. Sample Selection and Data Source
The study selects the Standard & Poor's 500 (S&P 500) as dataset from the Kaggle platform. The research sample includes the historical market data of S&P 500 index constituent stocks from 2000 to the present, covering various indicators such as the opening price, closing price, highest price, lowest price, and trading volume for each stock. The data sample is shown in Table 1:
Table 1. Data Sample
Variable | Meaning |
Date | Indicates the specific trading date. |
Open | The opening price each day, providing an initial market evaluation of the stock. |
High | The highest price reached by the stock during the trading day, reflecting the day's maximum market valuation. |
Low | The lowest price reached by the stock during the trading day, indicating the minimum market valuation. |
Close | The daily closing price, representing the market’s final evaluation of the stock after a day’s trading. |
Volume | The number of shares traded on that day, measuring market attention and activity level for the stock. |
Ticker | Identifies the specific S&P 500 component stock. |
To select the primary features, we initially performed missing data imputation and outlier detection. Missing data due to market closures were filled using linear interpolation to ensure continuity in the time series. Additionally, to avoid the training process being impacted by excessively large or small values, we standardized all numerical values, converting them to a standard normal distribution with a mean of 0 and a standard deviation of 1. This step not only improved training efficiency but also accelerated model convergence.
We selected Apple, Microsoft, Google, Amazon, and Tesla from the dataset as the research samples. Figures 1 and 2 illustrate the daily closing prices and trading volumes of these companies from January 1, 2023, to October 31, 2024.
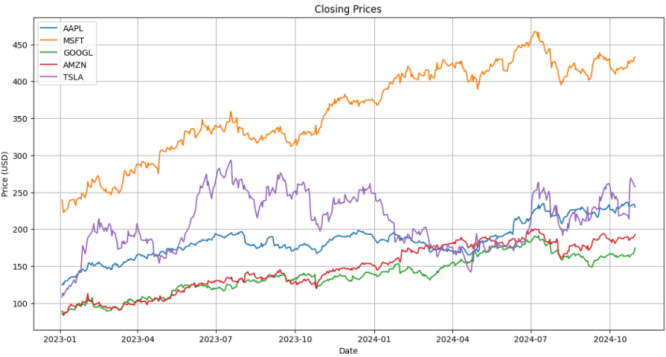
Figure 1. Daily Closing Prices from January 2023 to October 2024
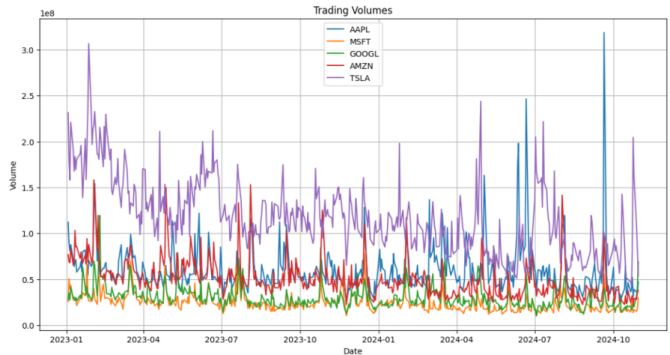
Figure 2. Daily Trading Volumes from January 2023 to October 2024
4.2. Research Methods
Compared with statistical methods, deep learning techniques offer superior nonlinear mapping capabilities: they extract features at specific time points, then use these features for modeling and predicting outcomes[6]. This study applies deep learning models to model and forecast the stock market, evaluating their performance and accuracy under different market conditions. The primary models used in this research are Long Short-Term Memory (LSTM) networks, Random Forest, and other ensemble learning methods.
4.3. Model Principles
This paper utilizes and compares the performance of four models: Long Short-Term Memory (LSTM) networks, Random Forest, GRU, and XGBOOST.
4.3.1. LSTM Network
The Long Short-Term Memory (LSTM) network, a specialized form of Recurrent Neural Network (RNN), is particularly suited for handling and forecasting long-term dependencies in time-series data, making it highly effective for financial market predictions, such as stock price forecasting[7]. Since price fluctuations in the stock market are also a time series problem, LSTM can capture long-term and cyclical price fluctuations. Its gate structure effectively handles long-term and short-term memory, making the model perform exceptionally well in dealing with the periodicity and sudden changes in price fluctuations. The LSTM network is shown in Figure 3.
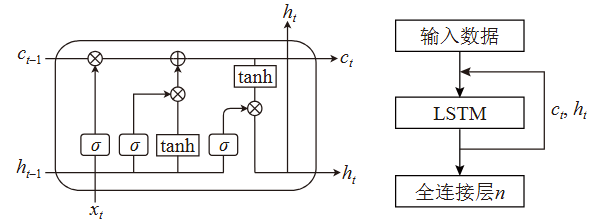
Figure 3. LSTM Network
LSTM determines whether to retain or forget information by introducing structures such as the "Forget Gate," "Input Gate," and "Output Gate." These gating mechanisms allow LSTM to "remember" and "forget" information, thereby effectively learning the long-term and short-term relationships in time series data.
To tailor the model more closely to stock market research, we adjusted the number of hidden layers, learning rate, training epochs, and batch size. This approach balances model complexity while avoiding overfitting, ensures rapid learning in the initial stages, and allows for more stable convergence in later stages, reducing the impact of noise on model gradient updates.
4.3.2. GRU Network
The Gated Recurrent Unit (GRU) is a simplified version of LSTM, offering similar performance but with fewer parameters and higher computational efficiency [8]. GRU combines the forget gate and input gate of LSTM into a single "update gate," and the introduction of the "reset gate" enables the network to process sequential data with lower computational complexity while effectively addressing the vanishing gradient problem. In GRU, the reset gate decides whether to ignore the previous state, while the update gate controls the degree of blending between the current state and the previous mixed state. This allows GRU to capture long-term dependencies and, compared to LSTM, has a simpler structure and higher computational efficiency, making it suitable for the rapidly changing stock market.
4.3.3. Random Forest
The Random Forest model is a Bagging ensemble learning algorithm based on decision trees, proposed by Breiman et al. [9]. First, by randomly selecting node ttt, it finds the feature and corresponding split threshold sss in the feature subset mmm that maximizes information gain or Gini impurity, thereby identifying the optimal attribute. Since a single decision tree is highly sensitive to noise, Random Forest mitigates the effect of noise in financial data and avoids overfitting by randomly drawing multiple subset samples from the original dataset and integrating multiple randomized decision trees to make a final prediction through majority voting. Thus, the random sampling of samples and random selection of features in Random Forest enable it to perform excellently when handling high-dimensional data, effectively addressing noise and feature redundancy issues in the data and enhancing the model's generalization ability.
4.3.4. XGBOOST
The Extreme Gradient Boosting (XGBoost) algorithm is a Boosting ensemble learning algorithm that uses CART models as base learners and is an improvement over Gradient Boosting Decision Trees (GBDT) [9]. XGBoost trains a set of decision trees iteratively. During each iteration, XGBoost builds a new decision tree by fitting the residuals of the previous prediction, thereby continuously correcting previous errors and enabling the model to gradually approach the target value, enhancing its generalization ability. Additionally, the XGBoost model incorporates a regularization term, which helps prevent overfitting on time series data like stock prices, improving the model’s stability and the reliability of its predictions.
4.4. Evaluation Metrics
Since stock price prediction using deep learning can be treated as a regression problem, we use Mean Squared Error (MSE) as the loss function, as shown in Equation (1):
\( MSE(y,\hat{y})=\frac{1}{n}\sum _{i=1}^{n}({y_{i}}-{\hat{y}_{i}}{)^{2}} \) (1)
where \( {y_{i}} \) and \( {\hat{y}_{i}} \) represent the actual value and the predicted value for the iii-th sample, respectively. MSE calculates the error between the true values and predicted values, with smaller MSE values indicating better prediction accuracy.
In addition, this study also uses Root Mean Squared Error (RMSE), Mean Absolute Error (MAE), and Mean Absolute Percentage Error (MAPE) as evaluation metrics, defined in Equations (2-3):
\( RMSE=\sqrt[]{\frac{1}{n}\sum _{i=1}^{n}{({y_{i}}-{\hat{y}_{i}})^{2}}} \) (2)
\( MAE(y,\hat{y})=\frac{1}{n}\sum _{i=1}^{n}∥{y_{i}}-{\hat{y}_{i}}∥ \) (3)
\( MAPE(y,\hat{y})=\frac{1}{n}\sum _{i=1}^{n}\frac{∥{y_{i}}-{\hat{y}_{i}}∥}{∥{y_{i}}∥} \) (4)
Overall, MSE and RMSE are more sensitive to larger errors, while MAE is less sensitive to outliers, reflecting the overall average deviation of the predictions from the actual values. MAPE measures the relative percentage error, providing the average percentage error relative to the true values, which is useful in situations where relative error is a key concern. For business applications, MAPE can offer an intuitive measure of percentage error. In all four metrics, smaller values indicate higher prediction accuracy.
4.5. Results and Analysis
Figures 4 to 7 illustrate the comparison between actual and predicted values across different algorithms. In each figure, the blue points represent actual values, while the red points represent predicted values. The smaller the deviation between these points, the higher the model’s prediction accuracy.
|
|
Figure 4. Comparison of Actual and Predicted Values with XGBOOST | Figure 5. Comparison of Actual and Predicted Values with LSTM |
|
|
Figure 6. Comparison of Actual and Predicted Values with GRU | Figure 7. Comparison of Actual and Predicted Values with Random Forest |
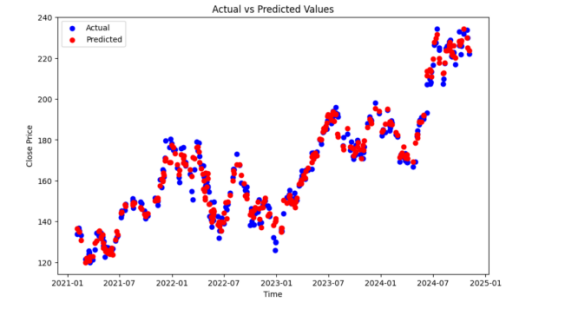
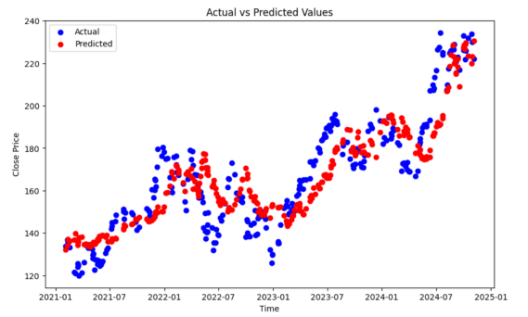
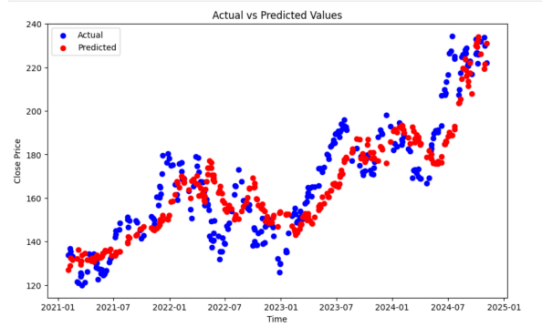
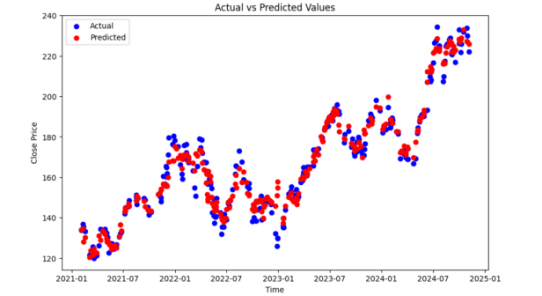
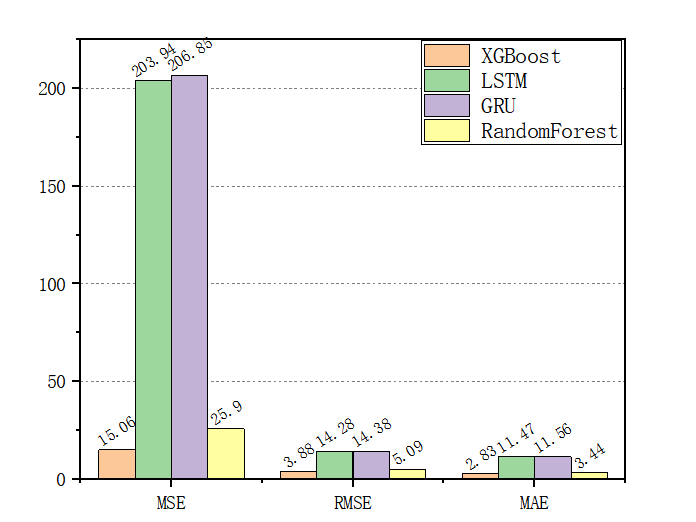
Figure 8. Evaluation Metrics and Corresponding Values
From the scatter plot comparisons of actual and predicted values, along with the evaluation metrics in Figure 8, we can observe that XGBOOST achieved the lowest values for MSE, RMSE, and MAE, indicating superior performance in stock price prediction. The comparison between actual and predicted values further shows that XGBOOST captures fluctuations stably, particularly following large price changes closely.
The prediction error of the Random Forest model is slightly higher than XGBOOST but significantly better than that of LSTM and GRU. Random Forest's ensemble of multiple decision trees resulted in a robust fit to stock price data, particularly excelling in handling data noise and outliers. The charts reveal that Random Forest effectively follows the overall price trend, with prediction deviations remaining within an acceptable range.
LSTM and GRU show significant bias; although both have the advantage of capturing long time sequences, the high complexity of the models in this experiment may have led to poor fitting and delayed response to fluctuations. Specifically, they struggle to quickly adapt to sudden price changes, resulting in higher prediction errors.
5. Conclusion
The results of this experiment demonstrate that traditional ensemble learning models like XGBoost and Random Forest continue to perform well in predicting stock market volatility, especially in handling noisy data and capturing nonlinear relationships. In contrast, deep learning models (such as LSTM and GRU), while advantageous for managing long-term dependencies, may be constrained by data characteristics and model complexity, failing to meet expected outcomes. Future research could explore hybrid models that combine the strengths of ensemble learning and deep learning to further improve the accuracy of stock market volatility predictions and investigate the applicability of these models in bond credit risk analysis.
References
[1]. Yang Zihui, Zhang Pingmiao, Lin Shihan. Research on Risk Linkage and Prediction between Stock Market and Bond Market [J]. Financial Research, 2024(1): 131-149.
[2]. She Junyi. Research on Stock Price Trend Prediction Based on Deep Learning [D]. Jiangsu: Southeast University, 2020.
[3]. Jin Yujia. Research on Linkage Effects and Risk Spillover in Financial Markets [D]. Jilin: Jilin University, 2022.
[4]. Pang Yuze. Analysis of the Correlation between China’s Stock Market and Bond Market [D]. Sichuan: Southwestern University of Finance and Economics, 2017.
[5]. Zhang Min. Research on Stock Price Prediction Based on One-Dimensional CNN-LSTM Hybrid Neural Network [D]. Shanghai: Shanghai University of Finance and Economics, 2020.
[6]. Zhang Ruixue, Hao Yongtao. Research on Stock Price Prediction Based on Deep Learning [J]. Computer Knowledge and Technology, 2023, 19(33): 8-10.
[7]. Xie Lin. Research on Stock Price Prediction Based on LSTM-XGBoost Combined Model [D]. Central University for Nationalities, 2022. DOI:10.27667/d.cnki.gzymu.2022.000045.
[8]. Hao Qijun. Research on Stock Price Prediction Based on CNN-GRU Model with Joint Loss Function [D]: [Master’s Thesis]. Jinan: Shandong University of Finance and Economics, 2023.
[9]. Ren Guangyu. Research on Bond Default Risk Prediction Based on Machine Learning [D]. Sichuan: Southwestern University of Finance and Economics, 2021.
Cite this article
Dong,B. (2024). Prediction of Stock Market Volatility and Bond Risk Based on Deep Learning. Applied and Computational Engineering,114,203-209.
Data availability
The datasets used and/or analyzed during the current study will be available from the authors upon reasonable request.
Disclaimer/Publisher's Note
The statements, opinions and data contained in all publications are solely those of the individual author(s) and contributor(s) and not of EWA Publishing and/or the editor(s). EWA Publishing and/or the editor(s) disclaim responsibility for any injury to people or property resulting from any ideas, methods, instructions or products referred to in the content.
About volume
Volume title: Proceedings of the 2nd International Conference on Machine Learning and Automation
© 2024 by the author(s). Licensee EWA Publishing, Oxford, UK. This article is an open access article distributed under the terms and
conditions of the Creative Commons Attribution (CC BY) license. Authors who
publish this series agree to the following terms:
1. Authors retain copyright and grant the series right of first publication with the work simultaneously licensed under a Creative Commons
Attribution License that allows others to share the work with an acknowledgment of the work's authorship and initial publication in this
series.
2. Authors are able to enter into separate, additional contractual arrangements for the non-exclusive distribution of the series's published
version of the work (e.g., post it to an institutional repository or publish it in a book), with an acknowledgment of its initial
publication in this series.
3. Authors are permitted and encouraged to post their work online (e.g., in institutional repositories or on their website) prior to and
during the submission process, as it can lead to productive exchanges, as well as earlier and greater citation of published work (See
Open access policy for details).
References
[1]. Yang Zihui, Zhang Pingmiao, Lin Shihan. Research on Risk Linkage and Prediction between Stock Market and Bond Market [J]. Financial Research, 2024(1): 131-149.
[2]. She Junyi. Research on Stock Price Trend Prediction Based on Deep Learning [D]. Jiangsu: Southeast University, 2020.
[3]. Jin Yujia. Research on Linkage Effects and Risk Spillover in Financial Markets [D]. Jilin: Jilin University, 2022.
[4]. Pang Yuze. Analysis of the Correlation between China’s Stock Market and Bond Market [D]. Sichuan: Southwestern University of Finance and Economics, 2017.
[5]. Zhang Min. Research on Stock Price Prediction Based on One-Dimensional CNN-LSTM Hybrid Neural Network [D]. Shanghai: Shanghai University of Finance and Economics, 2020.
[6]. Zhang Ruixue, Hao Yongtao. Research on Stock Price Prediction Based on Deep Learning [J]. Computer Knowledge and Technology, 2023, 19(33): 8-10.
[7]. Xie Lin. Research on Stock Price Prediction Based on LSTM-XGBoost Combined Model [D]. Central University for Nationalities, 2022. DOI:10.27667/d.cnki.gzymu.2022.000045.
[8]. Hao Qijun. Research on Stock Price Prediction Based on CNN-GRU Model with Joint Loss Function [D]: [Master’s Thesis]. Jinan: Shandong University of Finance and Economics, 2023.
[9]. Ren Guangyu. Research on Bond Default Risk Prediction Based on Machine Learning [D]. Sichuan: Southwestern University of Finance and Economics, 2021.