


1. Introduction
1.1. Background
As the smartphone market evolves rapidly, consumers, retailers and manufacturers are increasingly concerned about whether smartphone price is reasonable. Accurate price prediction can offer valuable insights in this context. A wide range of methods can be applied for price prediction, with numerous machine learning techniques having been successfully employed for this purpose. As a simple and useful model, Decision Tree can provide a basic price range prediction through classification. On the other hand, Support Vector Regression (SVR) has an outstanding performance due to its ability to effectively handle nonlinear relationships which is commonly seen among smartphones’ features. Combining these two models together for price prediction is more likely to provide a promising result.
1.2. Literature Review
Previous research has highlighted the efficiency of machine learning methods in price prediction. Decision trees are widely utilized in classification tasks due to their interpretability and ease of use [1]. Meanwhile, SVR has demonstrated superior performance in capturing complex relationships in regression tasks [2]. Studies have showcased the effectiveness of these models in various applications.
Also, in this paper, scikit-learn offers substantial advantages in implementing and comparing the Decision Tree and SVR models. It is a user-friendly Python library offering a wide range of machine learning algorithms and tools for data preprocessing, model selection, and evaluation [3].
1.3. Research Objectives
This study aims to evaluate the performance of Decision Tree and SVR models in predicting smartphone prices. We have two objectives for this research: To assess and compare the prediction accuracy of both models as well as their combination, and to determine the most influential features affecting smartphone prices and evaluate prediction accuracy.
2. Methods and data set
2.1. Decision Tree
Decision Tree is a non-parametric supervised learning method used for classification and regression. It can derive rules based on provided features and their labels. In this task, we employ the model for classification, aiming to derive a set of if-then-else decision rules. The deeper the tree, the more complex the rules, and the better the model fits the data.
We create a tree and define its nodes by calculating one of its algorithm-based values such as Information Entropy, Information Gain, Gain Ratio and Gini Impurity [4]. The most commonly used value is Information Gain for Iterative Dichotomiser 3 (ID3) .
Information Entropy and Gini Impurity and be calculated by equations 2.1:
\( E(t)=-\sum _{i=0}^{n}p(i|t){log_{2}}p(i|t) \)
\( G(t)=1-\sum _{i=0}^{n}{p(i|t)^{2}} \) (2.1)
Where \( p(i|t) \) is the probability of class i in set t.
Information Gain can be calculated by equation 2.2:
\( G(A)=-\sum _{i=1}^{m}{p_{i}}{log_{2}}({p_{i}})-\sum _{j=1}^{v}\frac{|{D_{j}}|}{|D|}(-\sum _{i=1}^{j}{p_{i}}{log_{2}}({p_{i}})) \) (2.2)
Where \( {p_{i}} \) is the probability of the i-th class appearing in the data set, \( {D_{j}} \) represents the subset of data set D where the value of attribute A is j, ∣ \( {D_{j}} \) ∣ is the size of subset \( {D_{j}} \) , and ∣D∣ is the size of the entire data set D.
2.2. SVR
SVR is a type of Support Vector Machine (SVM) designed specifically for regression tasks, whereas SVM is typically used for classification. It captures the complex relationships between the input features and the output values. The model minimizes the error function, balancing prediction accuracy and model complexity. The SVR model for regression can be written as the following function:
\( f(x)={x^{T}}β+{β_{0}} \) (2.3)
The coefficients \( β \) and the constant term \( {β_{0}} \) are used to adjust the function to fit the data.
To find β, we have to minimize error based on the following function as the objective function:
\( H(β,{β_{0}})=\sum _{i=1}^{N}C({y_{i}}-f({x_{i}}))+\frac{λ}{2}{||β||^{2}} \) (2.4)
The first term is a sum of a general error measure for each data point, which quantifies the difference between the actual target values and the predicted values. λ is a regularization parameter that controls the trade-off between fitting the data and keeping the model simple.
Another important function of SVR is its loss function. It separates SVR from other regression models. The loss function can be defined as:
\( Loss(ŷ, y)=\begin{cases} \begin{array}{c} 0 , if |y-ŷ | ≤ϵ \\ |y-ŷ |-ϵ , otherwise \end{array} \end{cases} \) (2.5)
\( ŷ \) is the is the predicted value of the target variable by the SVR model. Y is the actual value of the target variable.
It can be concluded that SVR tries to find the nearest line by considering the distance between each point and a line. It ignores the loss \( |y-ŷ | \) unless it exceeds \( ϵ \) . It minimizes the loss between predicted values and actual values within a certain threshold which is defined by \( ϵ \) .
When it comes to dealing with nonlinear relationships, kernel function has to be utilized. It transforms the features into higher dimension so as to find their linear relationship. There are various commonly used kernel functions, including but not limited to [5]:
\( K({x_{i}},{x_{j}})=γ{{x_{i}}^{T}}{x_{j}} , Linear Kernel \)
\( K({x_{i}},{x_{j}})={{{(γx_{i}}^{T}}{x_{j}})^{d}} \) , Polynomial Kernel
\( K({x_{i}},{x_{j}})=exp({γ||x-{c_{j}}||^{2}}) \) , RBF Kernel(2.6)
Therefore, we have to define three hyperparameters when using SVR for prediction: C in the objective function, \( ϵ \) in the loss function and \( γ \) in the kernel function. The SVR model is tuned by adjusting hyperparameters such as the kernel function, regularization parameter (C), loss function threshold (ϵ), and kernel coefficient (γ).
We use coefficient of determination ( \( {R^{2}} \) ) to estimate the performance [6]:
\( {R^{2}}=1-\frac{\sum _{i=1}^{n}{{(y_{i}}-ŷ )^{2}}}{\sum _{i=1}^{n}{({y_{i}}-\overline{y})^{2}}} \) (2.5)
To be specific, the value of \( {R^{2}} \) coefficient is always between 1 and 0. A higher R²value indicates a better fit of the model to the data. The goal is to train an SVR model and optimize its hyperparameters to maximize the \( {R^{2}} \) coefficient.
2.3. Principal Component Analysis (PCA)
PCA is a robust statistical technique used to identify patterns in high dimension data. It can find all representative components in a data set and can reduce their number of dimensions through compressing. Little information will be lost and the relation among them will become much more available.
Performing PCA requires several steps: subtract the mean, calculate the covariance matrix, its eigenvectors and its eigenvalues and derive the new data set. [7] PCA library form scikit-learn is used in this research to calculate these values.
2.4. Data set and Pre-processing
The data set used in this study was downloaded from Kaggle [8]. It consists of 980 smartphone records. The original data set had 25 columns, and 24 of which are features. After deleting all string type features and some features that are seldom considered when producing or purchasing a phone, PCA was used so as to decrease the number of features. In this study, PCA was applied to reduce the number of features from 25 to eight, based on their relevance to smartphone prices.
After cleaning and processing the data, the final features used for prediction includes 5G capability, number of cores, processor speed, battery capacity, RAM capacity, internal memory, screen size, and refresh rate. The blanks in those features are filled with the mode of its column. Also, all features were standardized using ‘StandardScaler’ from scikit-learn to ensure that they are on a similar scale before applying two models. The data set was split into training and testing sets in an 80:20 ratio, with price labeled into three categories: low, medium, and high. Low refers to price lower than 25000 (INR), medium between 25000 and 100000 and high bigger than 100000.
3. Results
3.1. Hyperparameter Tuning
To optimize the two models, hyperparameters should be adjusted to a decent value. A good way to tune hyperparameter is to apply Grid Search, which is also provided by scikit-learn.
We tested all combinations of hyperparameters and output for Decision Tree model and selected the best one based on its accuracy. There are three influential hyperparameters: Maximum tree depth, Minimum number of samples per leaf node, and Minimum number of samples required to split a node.
We also tested all combinations of available hyperparameters for SVR and return the combination-based on maximizing the \( {R^{2}} \) coefficient during cross-validation. Accordingly, there are four hyperparameters need to be adjusted: the kernel function (`kernel`), C (`C`), \( ϵ \) (`epsilon`) and \( γ \) (`gamma`).
3.2. Feature Importance Analysis
To find out the feature that contributes most to the price prediction, we analyzed their importance when using two different models. The absolute values of these coefficients were used to rank the features based on their importance. This analysis helps us identify the key factor that determine the price of a smartphone, providing insights for both consumers and manufacturers.
When calculating coefficients of the decision tree and SVR model, the importance rankings of Decision Tree and SVR are shown in figure 1 and figure 2.
|
|
Figure 1: Importance Ranking of Decision Tree’s Features | Figure 2: Importance Ranking of SVR’s Features |
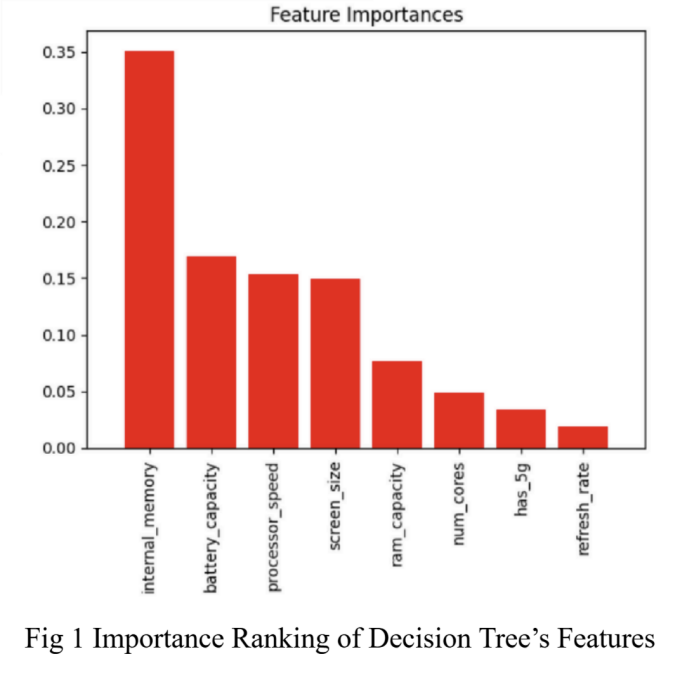
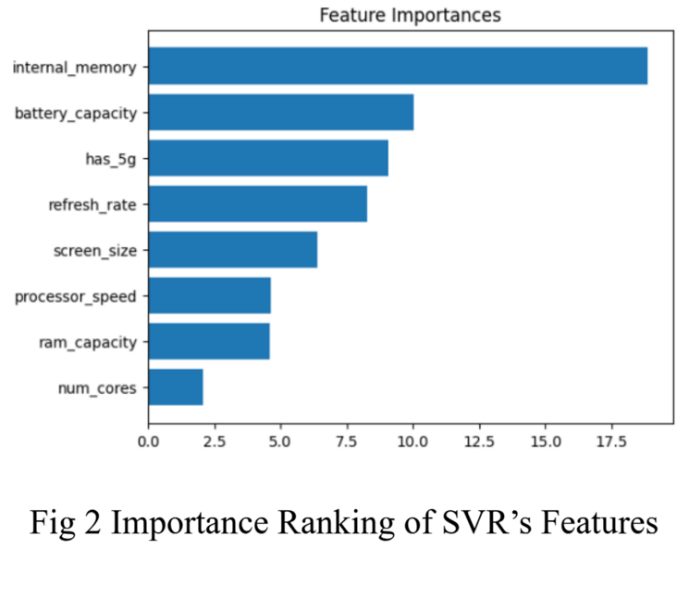
Figure 1 shows the importance ranking of Decision Tree’s features. Accordingly, internal memory, battery capacity and processor speed have top three biggest impacts on phone price when using Decision Tree for prediction.
Figure 2 shows the importance ranking of SVR’s features. Accordingly, internal memory, battery capacity and whether the phone has a 5g function have top three biggest impacts on phone price when using SVR for prediction.
The similarity of feature importance between these two models reveals that internal memory and battery capacity are probably the biggest factor influencing the price of a phone in real life.
3.3. Results of Hyperparameter Tuning
Hyperparameter tuning was performed using Grid Search for both Decision Tree and SVR models. For the Decision Tree model, the best hyperparameters selected were:
• Maximum tree depth: 5
• Minimum number of samples per leaf node: 1
• Minimum number of samples required to split a node:10
The model achieved an accuracy of 85.2%.
For SVR, the best hyperparameters were:
• Kernel: Polynomial
• C: 10
• Epsilon: 0.2
• Gamma: Scale
The SVR model achieved an R²score of 0.34 on the training set and 0.46 on the testing set, indicating moderate predictive performance on unseen data.
3.4. Phased Analysis and Conclusions
The Decision Tree model gives out a promising result. It fits the training data very well with high accuracy. The SVR model demonstrated a decent fit to the training data, as proved by the \( {R^{2}} \) scores ( \( {R^{2}} \) = 0.67). Also, the performance on the testing set is crucial for assessing the model’s ability of dealing with unseen data, and its \( {R^{2}} \) score is even higher ( \( {R^{2}} \) = 0.77). The polynomial kernel was chosen as the best option among the tested kernels, indicating that a decent model is crucial for this particular data set. The feature importance analysis highlighted that processor speed, internal memory, and RAM capacity were the most influential factors in determining smartphone prices for both models. These insights aligns with consumer expectations regarding performance and storage capacity.
Comparing these two models, we can tell that although SVR’s performance is not so bad, decision tree fits the classification version task so well even the task was primarily a regression task. It can be concluded that even facing a complex task, a relatively simple model or method may perform better than a complex one.
3.5. Further Study on Combination of the Two Models
Although decision tree cannot predict the exact price, it still offers accurate classification. While SVR gives the exact number, its result does not seem to be satisfying. In order to have both advantages, combining these two models is believed to be a feasible approach. As we have given three price labels depending on the price level, we also separate the data set into three parts accordingly. Three independent SVR models can be trained through each part of the data set, and the combination of them is able to compose a full SVR model which can be utilized to tell the exact price after receiving the price label by using the classification decision tree model.
Therefore, we used the decision tree trained in part II and trained three more SVR models. The training and tuning method is the same as those in part II. The range of GridSearch when tuning hyperparameters are slightly changed.
The best hyperparameters of three different SVR models are listed in the table:
Table 1: Best hyperparameters of three different SVR models
Low | Medium | High | |
Kernel | Linear | Linear | Polynomial |
Epsilon | 0.2 | 0.01 | 0.015 |
Gamma | Scale | Scale | 1 |
C | 10 | 1010 | 100 |
Training \( {R^{2}} \) | 0.67 | 0.24 | 0.77 |
Testing \( {R^{2}} \) | 0.58 | 0.33 | 0.23 |
Table 1 summaries the best hyperparameters of three different SVR models.
4. Discussion
4.1. Model Complexity and Prevention of Overfitting
One concern with decision tree and SVR is the potential for overfitting. Decision Tree models are prone to overfitting, but through pruning, we achieved comparable performance on both training and test data, suggesting that a simpler model may suffice. Therefore, the decision tree was chosen as the better option, suggesting that a simpler model may be sufficient to capture the essential relationships in the data.
For SVR, overfitting is a concern when using more complex kernel functions, such as the polynomial kernel. When using a simple linear kernel function, lower complexity makes it less possible to become overfitted, but it can still become underfitted. It is important to consider the trade-off between model complexity and predictive accuracy. To prevent overfitting, future work could explore the use of more sophisticated kernel functions or regularization techniques or larger data sets while maintaining high predictive power.
4.2. Impact of Individual Features
For both decision tree and SVR, the feature importance analysis consistently identified processor speed, internal memory, and RAM capacity as critical factors. This aligns with consumers’ preferences and industry trend, where faster processors and larger storage capacities drive up smartphone prices. Battery capacity also emerged as a significant factor, reflecting its importance to customers. This also reveals that our study can be put into practice for it resembles the truth.
4.3. Model Interpretability
Decision Tree is easy to learn and easy to use. It is highly interpretable as a simple model, and its interpretability makes it an undoubtfully powerful tool for analysis of customer preference. This specific feature outcompetes other complex models that fit well when facing other tasks.
While SVR is known for its being robust and effective, it may lack interpretability compared to simpler models. For complex kernel function, such as polynomial kernel function used in this task, alternative approaches can be taken into consideration and used to gain insights into the model's decision-making process.
4.4. Brief Analysis of Combination Model
While Decision Tree provides accurate classification, SVR offers more precise price predictions but with less overall accuracy. When inputting eight features into the combined model, the Decision Tree would provide the price label to the SVR who predicts the exact price. The combined model performs better than the two single models, especially for low-priced smartphones.
5. Conclusion
In conclusion, the Decision Tree model proved to be an effective tool for smartphone price prediction, , outperforming SVR in classification tasks. Considering the complexity of the problem, the model achieved reasonable predictive accuracy. However, the combination of both models showed promise for improving predictive accuracy, particularly for low-priced devices. SVR can become both underfitted or overfitted because the data size of medium and high price label is way too small. Furthermore, the lack of more complex pre-processing can be another reason for this problem. The findings suggest that further work should focus on other pre-processing method and increasing the data set size to improve SVR performance. Additionally, having more detailed user reviews might enhance the predictive power of the model.
References
[1]. Martin Krzywinski and Naomi Altman (2017). Classification and Regression Trees, Nature Methods, 757-758.
[2]. Trevor Hastie, Robert Tibshirani and Jerome Friedman, The Elements of Statistical Learning - Data Mining, Inference, and Prediction, 2nd ed., Springer, 434.
[3]. Pedregosa, F., Varoquaux, G., Gramfort, A., Michel, V., Thirion, B., Grisel, O., ... & Duchesnay, É. (2011). Scikit-learn: Machine learning in Python. the Journal of machine Learning research, 12, 2825-2830.
[4]. Ibomoiye Domor Mienye, Yanxia Sun, Zenghui Wang (2019). Prediction Performance of Improved Decision Tree-based Algorithms: A Review, SMPM, 699-700.
[5]. Christopher M. Bishop, Pattern Recognition and Machine Learning, Springer, 296.
[6]. Davide Chicco, Matthijs J. Warrens, Giuseppe Jurman (2021). The coefficient of determination R-squared is more informative than SMAPE, MAE, MAPE, MSE and RMSE in regression analysis evaluation, PeerJ Comput Sci, 5.
[7]. Lindsay I Smith (2002). A tutorial on Principal Components Analysis, February 26, 12.
[8]. https://www.kaggle.com/datasets/jenilhareshbhaighori/smartphone-data-analysis-using/data
Cite this article
Li,X. (2024). Smartphone Price Prediction Using Decision Tree and Support Vector Regression (SVR). Applied and Computational Engineering,115,37-43.
Data availability
The datasets used and/or analyzed during the current study will be available from the authors upon reasonable request.
Disclaimer/Publisher's Note
The statements, opinions and data contained in all publications are solely those of the individual author(s) and contributor(s) and not of EWA Publishing and/or the editor(s). EWA Publishing and/or the editor(s) disclaim responsibility for any injury to people or property resulting from any ideas, methods, instructions or products referred to in the content.
About volume
Volume title: Proceedings of the 5th International Conference on Signal Processing and Machine Learning
© 2024 by the author(s). Licensee EWA Publishing, Oxford, UK. This article is an open access article distributed under the terms and
conditions of the Creative Commons Attribution (CC BY) license. Authors who
publish this series agree to the following terms:
1. Authors retain copyright and grant the series right of first publication with the work simultaneously licensed under a Creative Commons
Attribution License that allows others to share the work with an acknowledgment of the work's authorship and initial publication in this
series.
2. Authors are able to enter into separate, additional contractual arrangements for the non-exclusive distribution of the series's published
version of the work (e.g., post it to an institutional repository or publish it in a book), with an acknowledgment of its initial
publication in this series.
3. Authors are permitted and encouraged to post their work online (e.g., in institutional repositories or on their website) prior to and
during the submission process, as it can lead to productive exchanges, as well as earlier and greater citation of published work (See
Open access policy for details).
References
[1]. Martin Krzywinski and Naomi Altman (2017). Classification and Regression Trees, Nature Methods, 757-758.
[2]. Trevor Hastie, Robert Tibshirani and Jerome Friedman, The Elements of Statistical Learning - Data Mining, Inference, and Prediction, 2nd ed., Springer, 434.
[3]. Pedregosa, F., Varoquaux, G., Gramfort, A., Michel, V., Thirion, B., Grisel, O., ... & Duchesnay, É. (2011). Scikit-learn: Machine learning in Python. the Journal of machine Learning research, 12, 2825-2830.
[4]. Ibomoiye Domor Mienye, Yanxia Sun, Zenghui Wang (2019). Prediction Performance of Improved Decision Tree-based Algorithms: A Review, SMPM, 699-700.
[5]. Christopher M. Bishop, Pattern Recognition and Machine Learning, Springer, 296.
[6]. Davide Chicco, Matthijs J. Warrens, Giuseppe Jurman (2021). The coefficient of determination R-squared is more informative than SMAPE, MAE, MAPE, MSE and RMSE in regression analysis evaluation, PeerJ Comput Sci, 5.
[7]. Lindsay I Smith (2002). A tutorial on Principal Components Analysis, February 26, 12.
[8]. https://www.kaggle.com/datasets/jenilhareshbhaighori/smartphone-data-analysis-using/data