


1. Introduction
With the vigorous development of the global coffee market and increasingly refined consumer preferences, vending machines, as an important part of the modern retail model, have shown great market potential and commercial value in the field of coffee sales. However, how to accurately predict the sales volume of coffee in vending machines in order to balance supply and demand, reduce inventory backlog, and improve customer satisfaction is a key issue that the industry needs to solve urgently.
Currently, there is a lot of research focusing on the analysis and research of the coffee market. Machine learning technologies such as linear regression, XGBoost, and LSTM have demonstrated powerful capabilities in coffee market price prediction [1]. Binary classification and random forest can be used to predict the quality of coffee beans and derive the sustainable growth of the coffee market [2]. The coffee crop yield estimation method based on deep learning is helpful for precision agriculture [3]. However, when processing data with significant time series characteristics such as vending machine sales, it may face challenges of computational complexity and insufficient interpretability. In contrast, the Autoregressive Integrated Moving Average (ARIMA) model has become the first choice for this research method due to its simple and effective structure, easy interpretation, and good adaptability to time series data.
Through an in-depth analysis of the German ground coffee retail market, the limitations of traditional structural models in predicting retailer pricing choices in a multi-product environment are revealed [4]. This finding not only emphasizes the importance of developing customized prediction models for different sales channels but also provides a direct background and motivation for the research of this article. This article hopes to provide a more accurate and practical solution for forecasting vending machine coffee sales by building and optimizing the ARIMA model.
Further, the impact of product, price, place, and promotion (4Ps marketing mix) on customer satisfaction and loyalty in the Krabi coffee shop industry in Thailand [5]. This perspective emphasizes that when constructing an ARIMA model, it is essential to not only account for the time series characteristics of historical sales data but also to fully incorporate the potential effects of marketing mix factors on sales. By introducing appropriate external variables or adjusting model parameters, this article strives to make the prediction results closer to the actual sales situation.
Some literature respectively pointed out the uneven distribution of profits in the coffee supply chain and the multiple determinants of the marketability of kava coffee [6, 7]. These studies reveal the complexity and variability of the coffee market, further emphasizing the importance of accurately forecasting sales. By using the ARIMA model for sales forecasting, this article aims to help vending machine operators better grasp market dynamics and optimize inventory management strategies, thereby improving operational efficiency and market competitiveness.
Brand image plays a central role in promoting customers' repurchase intention, and factors such as product quality, service quality, and price rationality play a supporting role in the brand image [8]. The impact of product quality, price, and service quality on coffee purchasing decisions [9]. This finding provides important implications for the prediction model of this article: when predicting coffee sales, researchers must not only pay attention to the changing trends of the sales data itself but also consider how these non-data factors indirectly affect customer behavior and purchasing decisions. Sales volume.
Finally, related literature explores the impact of resale price maintenance on cartel stability and retailer loss incentives [10]. Although this research mainly focuses on the organizational structure and price mechanism of the coffee market, it also reflects the potential impact of market demand, price elasticity, and other factors on sales volume. When constructing the ARIMA model, this article will fully consider the changing trends and interactive relationships of these macro market factors to improve the accuracy and practicality of the forecast model.
This article focuses on forecasting vending machine coffee sales based on the ARIMA (Autoregressive Integral Moving Average) model, aiming to explore an efficient and accurate forecasting method. Based on the above research background, the research in this paper is not only of theoretical significance but also of important practical value. By in-depth analysis of the key factors affecting sales and building a scientific and reasonable prediction model, this article hopes to provide effective decision support tools for vending machine operators to help them achieve sustainable development in a highly competitive market environment.
2. Methods
2.1. Data
The Coffee Sales dataset used in this article comes from the actual sales records of a vending machine operator, covering daily coffee sales data over a long period of time. This dataset records in detail the date and corresponding sales (money) of each transaction, providing a solid data foundation for building an ARIMA model. Through an in-depth analysis of these data, the study aims to reveal the time series law of coffee sales and make predictions for future sales based on this.
Table 1 shows the different types of variables, among which are the date of sale of coffee and the corresponding sales amount. In terms of indicator selection, this article focuses on two core variables: date and sales. Date, as a time index in time series analysis, is the basis for building an ARIMA model; while sales directly reflect the sales of coffee and are the main target of prediction. The study initially carried out the required preprocessing on sales, such as missing value processing, outlier detection, correction, etc., to guarantee the correctness and integrity of the data in order to better satisfy the requirements of the ARIMA model.
Table 1: Different types of variables
Term | Type | Range |
Date | Numeric | 2024/3/1 10:15:00 to 2024/9/5 21:27:30 |
Money | Numeric | 0 to 362 |
2.2. Method
This paper uses the ARIMA (Autoregressive Integrated Moving Average) model to predict the sales of vending machine coffee. A traditional statistical technique for predicting time series is the ARIMA model. With p representing the autoregressive term's order, d the difference order, and q the moving average term's order, its general form can be written as ARIMA (p, d, q).
Difference order (d): In order to convert a non-stationary time series into a stationary series, it is usually necessary to perform difference processing on the original data. The difference formula is:
\( nabladxt=(1-L)dxt \) (1)
Autoregressive term (AR): explains how current values and past values are linearly related. The formula for the autoregressive part is:
\( phi(L)xt=ϕ1xt-1+ϕ2xt-2+⋯+ϕpxt-p \) (2)
Moving average (MA): To smooth the time series' random oscillations, the random error term's lag value is added. This is the formula for the moving average component:
\( theta(L)ϵt=θ1ϵt-1+θ2ϵt-2+⋯+θqϵt-q \) (3)
Combining the above two parts, the complete formula of the ARIMA model is:
\( phi(L)(1-L)dxt=θ(L)ϵt \) (4)
2.3. Preprocessing
According to the Arima model, the model's residuals must be white noise, meaning they must not exhibit autocorrelation. The Q statistic test can be used to test for white noise (original hypothesis: the residuals are white noise). To check if the residuals' first 6-order autocorrelation coefficients pass the white noise test, for instance, Q6 is utilized. Generally speaking, if the relevant p-value is higher than 0.1, it passes the white noise test (or fails it). Q6 can be examined directly in most situations. The model fits badly if the white noise assumption is rejected (p<0.05); if not, it is typically deemed to be usable ordinarily.
The Ljung-Box test (LB test) calculates the autocorrelation coefficients of a series of lag periods and constructs a statistic (Q statistic) to test whether these autocorrelation coefficients are jointly zero, thereby determining whether the sequence is white noise (that is, the current value of the sequence is equal to Past values are not relevant). If the Q statistic is significant, the null hypothesis (the sequence is white noise) is rejected and it is considered that the sequence has autocorrelation. The formula of its statistic Q(m) is:
\( Q(m)=n(n+2)\sum _{k=1}^{m}\frac{p_{k}^{2}}{n-k} \) (5)
AIC and BIC values were used to screen and compare various models in accordance with the information criterion. By calculating the above two values multiple times and analyzing their changes, the model-building process can be optimized. The ideal model is ultimately determined to be the following when considering money and the AIC information criterion (the lower the value, the better): ARIMA(3, 3), and its model formula is:
\( y(t)=41.398-0.146*y(t-1)-0.176*y(t-2)+0.835*y(t-3)+0.210*ε(t-1)+ 0.257*ε(t-2)-0.744*ε(t-3) \) (6)
3. Results and Discussion
3.1. White Noise Test
The model Q statistic information (LB test), including the statistic value and p-value, is displayed in Table 2 below. This table shows the corresponding p-values of different orders of Q statistics in this model. In addition, this table only shows part of the data.
Table 2: Model Q statistics table
item | statistics | p-value |
Q6 | 7.718 | 0.259 |
Q7 | 8.262 | 0.310 |
Q8 | 9.570 | 0.297 |
Q9 | 13.213 | 0.153 |
Q10 | 13.847 | 0.180 |
Usually, it is sufficient to analyze Q6. The null hypothesis cannot be disapproved because the p-value for Q6 is higher than 0.1, according to the Q statistic results. The model essentially satisfies the conditions, and its residual is white noise.
3.2. ARIMA(3, 3)
By comparing different AIC and BIC values and obtaining the lowest value, the optimal model is ARIMA (3, 3). The ARIMA (3, 3) model parameter table is shown in Table 3 below, where the coefficients corresponding to the symbols c, α1, α2, α3, β1, β2, and β3 participate in the model formula.
Table 3: ARIMA (3, 3) model parameter table
item | symbol | coefficient | standard error | z-value | p-value | 95% confidence interval |
Constant | c | 41.398 | 28.477 | 1.454 | 0.146 | -14.415 ~ 97.211 |
AR | α1 | -0.146 | 0.112 | -1.313 | 0.189 | -0.365 ~ 0.072 |
α2 | -0.176 | 0.110 | -1.603 | 0.109 | -0.392 ~ 0.039 | |
α3 | 0.835 | 0.112 | 7.482 | 0.000 | 0.616 ~ 1.053 | |
MA | β1 | 0.210 | 0.142 | 1.479 | 0.139 | -0.068 ~ 0.488 |
β2 | 0.257 | 0.137 | 1.870 | 0.062 | -0.012 ~ 0.526 | |
β3 | -0.744 | 0.140 | -5.319 | 0.000 | -1.018 ~ -0.470 |
Note: AIC value = 6233.469; BIC value = 6267.948
3.3. Prediction Results and Real Results
On August 31st at 11:34:33 (time 550), an ARMA (3, 3) model was applied to train the dataset. This model provided data-fitting results and predictions for the next 17 data points. Additionally, 17 actual data items from September 1, 2024, at 9:34:00 (time 551) to September 5, 2024, at 21:27:00 (time 567) were used to verify the accuracy of the prediction results. Figure 1 shows the comparison between the real data and the data fitting results, and also shows the forecasts of 17 data items, including the 95% upper limit (Forecast 95% UL) and the 95% lower limit (Forecast 95% LL). As shown in Figure 1, the actual value and the fitted value are roughly similar, and the fit is good. The forecast results are also consistent with the distribution and within a reasonable range.
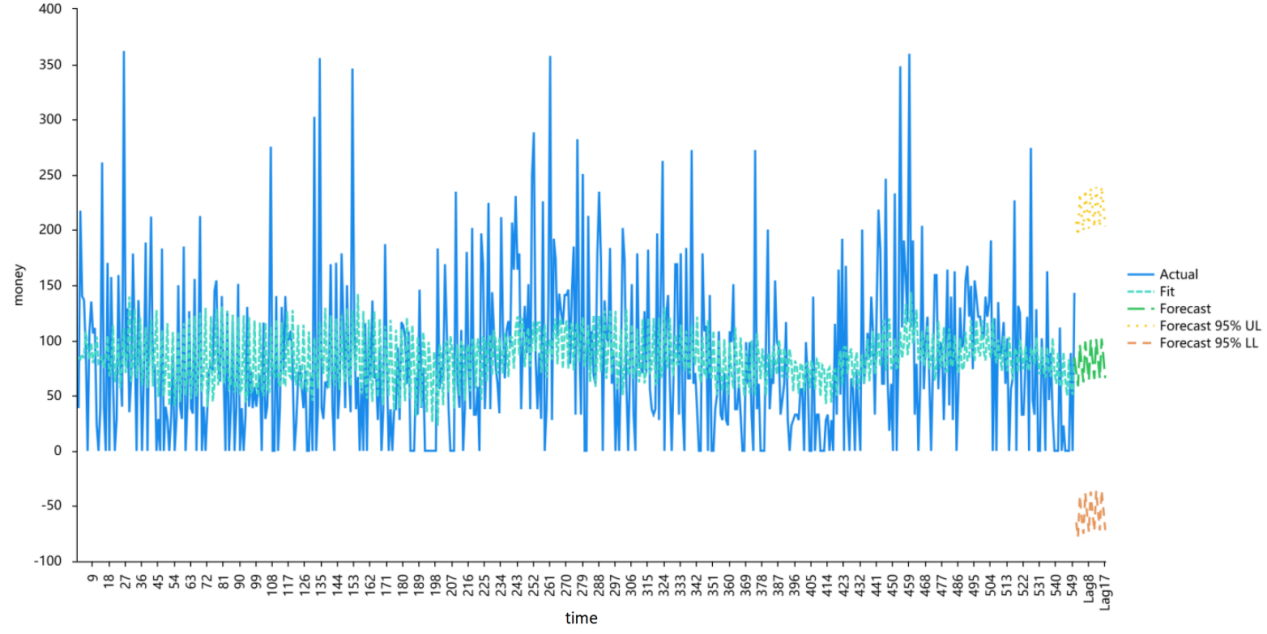
Figure 1: Money model fitting and prediction
Table 4 shows the comparison between the predicted value and the true value (only part of the data), thus obtaining the absolute error.
Table 4: compares the forecast value with the actual value
item | forecast | actual | Absolute error |
Time556 | 98.981 | 93.56 | 5.421 |
Time557 | 79.879 | 27.92 | 51.959 |
Time558 | 64.034 | 111.68 | 47.646 |
Time559 | 100.545 | 346.32 | 245.775 |
Time560 | 82.048 | 78.86 | 3.188 |
Time561 | 65.090 | 88.66 | 23.57 |
Time562 | 101.313 | 111.68 | 10.367 |
The obtained data is statistically analyzed, and the root mean square error (RMSE) of the prediction results is = 68.9416.
To determine if the model residual sequence exhibits serial correlation, the Lagrange multiplier test (Breush-Godfrey LM test) is employed. First, the null hypothesis (H0) of the LM test states that there is no serial correlation in the sequence, while the alternative hypothesis (H1) states that there is. Second, there are two statistics available from the LM test: F and T * R square. The F statistic is typically employed. Third, the null hypothesis is rejected, indicating a serial correlation, if the matching p-value is less than 0.05. Conversely, a p-value of more than 0.05 indicates that there is no serial connection because it is near the null hypothesis.
Table 5 shows the residual LM test of the prediction results of this paper.
Table 5: LM test of the residual term
F-statistic | 1.524 | p-value | 0.127 |
T *R2 statistic | 15.119 | p-value | 0.128 |
The data in Table 5 show that the p-values are all greater than 0.05, indicating that there is no serial correlation in the residual sequence and it conforms to the time series model.
4. Conclusion
This paper used the ARIMA model to conduct an in-depth analysis and forecast of vending machine coffee sales data and verified whether the residual sequence of the model is white noise through the Ljung-Box Q test, thereby evaluating the model's fitting effect. Through detailed data preprocessing, parameter estimation, and model verification processes, the study successfully constructed an ARIMA model that can accurately predict future coffee sales.
First, the reliability of the data source and the preprocessing of the data laid a solid foundation for subsequent modeling analysis. This study carefully checked the missing values and outliers in the data and processed them accordingly to ensure the integrity and accuracy of the data.
Secondly, in terms of method selection, the ARIMA model has become our preferred tool for coffee sales forecasting due to its powerful ability in time series analysis. The non-stationary time series is converted into a stationary series through differential processing, and combined with the AIC information criterion (the lower the value, the better), the optimal model is finally found to be ARIMA (3, 3). During the model training process, historical data was used to optimize the model, and the Ljung-Box Q test was used to verify that the model residual sequence had no autocorrelation, indicating that the model fitting effect was good.
Finally, in terms of prediction results, the ARIMA model showed high accuracy and reliability. The study used the trained model to predict future coffee sales and analyzed the rationality and application value of the prediction results. Prediction results not only help vending machine operators to better formulate sales strategies and inventory management plans but also provide useful references and reference for future research.
In summary, this paper has achieved remarkable results in the study of vending machine coffee sales forecasting based on the ARIMA model. Through scientific methods and rigorous analysis, this study has successfully constructed an ARIMA model that can accurately predict coffee sales, providing strong support for the operation management and decision support of the vending machine industry. Continuing to explore more advanced time series analysis methods and forecasting models to further improve the accuracy and practicality of forecasts is the future research direction.
References
[1]. Fofanah, A. J. (2021). Machine learning model approaches for price prediction in the coffee market using linear regression, XGB, and LSTM techniques. International Journal of Scientific Research in Science and Technology, 8(6).
[2]. Kim, J. Y. (2022). Coffee bean quality prediction using machine learning. SSRN.
[3]. Rivera Palacio, J. C., Bunn, C., Rahn, E., Little-Savage, D., Schmidt, P., & Ryo, M. (Year). Co-developing a deep learning-based crop yield estimation method in collaboration with thousands of smallholder coffee producers. SSRN..
[4]. Kuhlmann, R. (2020). Estimating counterfactuals as a test of structural models: The case of the German coffee cartel. SSRN.
[5]. Limna, P., Kraiwanit, T., Jangjarat, K., & Maskran, P. (2023). The antecedent attributes of customer satisfaction and loyalty in the coffee shop business domain. Journal of Production, Operations Management and Economics, 3(4), 15–25.
[6]. Kaitlin, [first initial if available]., Sagan, M., & Kennedy, S. (2021). Responsible coffee sourcing: Towards a living income for producers. SSRN.
[7]. Bushi, T. B. (2020). Determinants of marketability of Kaffa coffee. International Journal of Creative Research Thoughts (IJCRT), 18.
[8]. Ratasuk, A., & Buranasompob, A. (2021). Contributions of marketing factors on customer repurchase intentions in convenience store coffee shops in Bangkok and the mediating role of brand image. Asian Administration & Management Review, 4(2), 11-14.
[9]. Sofian, M. M. L. (2023). The influence of product quality, price, and service quality on the purchase decision of MSME products (Janji Jiwa Coffee) among students. SSRN..
[10]. Rickert, D., & Holler, E. (2022). How resale price maintenance and loss leading affect upstream cartel stability: Anatomy of a coffee cartel. International Journal of Industrial Organization, Forthcoming.
Cite this article
Chen,Z. (2024). Coffee Sales Prediction for Vending Machines Based on ARIMA Model. Applied and Computational Engineering,115,56-62.
Data availability
The datasets used and/or analyzed during the current study will be available from the authors upon reasonable request.
Disclaimer/Publisher's Note
The statements, opinions and data contained in all publications are solely those of the individual author(s) and contributor(s) and not of EWA Publishing and/or the editor(s). EWA Publishing and/or the editor(s) disclaim responsibility for any injury to people or property resulting from any ideas, methods, instructions or products referred to in the content.
About volume
Volume title: Proceedings of the 5th International Conference on Signal Processing and Machine Learning
© 2024 by the author(s). Licensee EWA Publishing, Oxford, UK. This article is an open access article distributed under the terms and
conditions of the Creative Commons Attribution (CC BY) license. Authors who
publish this series agree to the following terms:
1. Authors retain copyright and grant the series right of first publication with the work simultaneously licensed under a Creative Commons
Attribution License that allows others to share the work with an acknowledgment of the work's authorship and initial publication in this
series.
2. Authors are able to enter into separate, additional contractual arrangements for the non-exclusive distribution of the series's published
version of the work (e.g., post it to an institutional repository or publish it in a book), with an acknowledgment of its initial
publication in this series.
3. Authors are permitted and encouraged to post their work online (e.g., in institutional repositories or on their website) prior to and
during the submission process, as it can lead to productive exchanges, as well as earlier and greater citation of published work (See
Open access policy for details).
References
[1]. Fofanah, A. J. (2021). Machine learning model approaches for price prediction in the coffee market using linear regression, XGB, and LSTM techniques. International Journal of Scientific Research in Science and Technology, 8(6).
[2]. Kim, J. Y. (2022). Coffee bean quality prediction using machine learning. SSRN.
[3]. Rivera Palacio, J. C., Bunn, C., Rahn, E., Little-Savage, D., Schmidt, P., & Ryo, M. (Year). Co-developing a deep learning-based crop yield estimation method in collaboration with thousands of smallholder coffee producers. SSRN..
[4]. Kuhlmann, R. (2020). Estimating counterfactuals as a test of structural models: The case of the German coffee cartel. SSRN.
[5]. Limna, P., Kraiwanit, T., Jangjarat, K., & Maskran, P. (2023). The antecedent attributes of customer satisfaction and loyalty in the coffee shop business domain. Journal of Production, Operations Management and Economics, 3(4), 15–25.
[6]. Kaitlin, [first initial if available]., Sagan, M., & Kennedy, S. (2021). Responsible coffee sourcing: Towards a living income for producers. SSRN.
[7]. Bushi, T. B. (2020). Determinants of marketability of Kaffa coffee. International Journal of Creative Research Thoughts (IJCRT), 18.
[8]. Ratasuk, A., & Buranasompob, A. (2021). Contributions of marketing factors on customer repurchase intentions in convenience store coffee shops in Bangkok and the mediating role of brand image. Asian Administration & Management Review, 4(2), 11-14.
[9]. Sofian, M. M. L. (2023). The influence of product quality, price, and service quality on the purchase decision of MSME products (Janji Jiwa Coffee) among students. SSRN..
[10]. Rickert, D., & Holler, E. (2022). How resale price maintenance and loss leading affect upstream cartel stability: Anatomy of a coffee cartel. International Journal of Industrial Organization, Forthcoming.