


1. Introduction
Since the early 2000s, Xi'an, a major city in Northwest China, has experienced rapid urbanization, leading to significant environmental changes, including a marked increase in urban temperatures compared to the surrounding rural areas [1]. The temperature difference in Xi'an is especially pronounced during the summer months. For example, in the summer of 2016, the average temperature in the centre of Xi'an was almost 3℃ higher than in nearby rural areas, and the urban heat island effect became particularly pronounced [2]. This phenomenon has caused great inconvenience to the lives of city-dwelling residents, especially for households without air conditioning, where scorching hot nights seem even more difficult. This problem is further exacerbated by global climate change, which makes the challenge of facing high urban temperatures even more severe for residents. Besides, these overlapping effects are leading to higher temperatures, which in turn affect energy consumption, public health, and the overall quality of life for residents [3]. The accumulation of greenhouse gases, such as carbon dioxide and methane, exacerbates the urban heat island effect in Xi'an. These gases trap heat in the atmosphere, causing temperatures to rise. For example, increased levels of carbon dioxide led to a particularly hot 2017 with soaring temperatures [4]. Buildings, roads, and concrete surfaces in the city absorb and retain excess heat, especially at night, creating hot spots in the city [4]. It is observed that those areas with less vegetation tended to maintain hot temperatures longer after sunset, a phenomenon that undoubtedly caused problems for citizens in their daily lives.
The aim of this study is to understand how the greenhouse effect exacerbates the urban heat island effect in Xi'an and to explore its impacts on energy consumption, public health, and residents' quality of life [5]. By comparing temperature changes in the city centre and the suburbs, people can better understand the wider impacts of climate change on Xi'an's urban environment. In addition, this study may provide illuminating suggestions for dealing with these impacts, such as expanding the area of green space and improving building design, in order to mitigate the impacts of high temperatures and enhance the city's ability to cope [6].
2. Methods
2.1. Data collection
This study quantitatively analyzed the role of UHI intensity and greenhouse effect in Xi'an underware, with data.
Temperature records over the past 10 years from data of the China Meteorological Administration were analyzed to quantify UHI intensity in Xi'an. National temperature records together with information on spatial variability in surface temperatures were combined to better understand the patterns of change, as well as overall heating island bias [7].
Key air pollutants, such as carbon dioxide (CO2), and PM 2.5. Those 5 levels were then collected to investigate their link with the upcoming urban heat implications. This data helped analyse the impact of pollution on the urban thermal environment [7].
This article uses satellite remote sensing data from the National Cryosphere Desert Data Center of the Chinese Academy of Sciences to analyze surface temperature in Xi'an. The data were rich in geographic reach and helpful for learning more about where these UHIs tend to form [8].
2.2. Data analysis
First, this study counts and plots the temperature over time (python) of Xi'an through an average annual mean temperature data from 2010 to 2020.
This facilitated to emphasize the long-run trends additionally and manifest that Greenhouse result is attracted by Urbanization leading in escalation of temperatures. In GIS, this study also analyzes differences in the surface temperature of urban centres and suburbs surrounding them. This happened, for example in 2016 when the temperatures were distinctively higher especially during summer to that of city centre [9].
In the air pollutant data, this study particularly observes CO2 and PM2.5. Discover whether a city is how hot on each of these 5 levels. The most extreme CO2 concentrations occurred during the warmest years-indicating a correlation between emissions and global warming. Effect of Urban Construction and Traffic Growth on UHI and Pollution in Xi'an The comprehensive Kano analysis results showed that the main effect from pollution along with urban growth is obviously to exacerbate what already exists for both causes [11].
Figure 1 to Figure 3 show the average temperature, CO2 emissions and PM2.5 levels in Xi’an from 2010 to 2020.
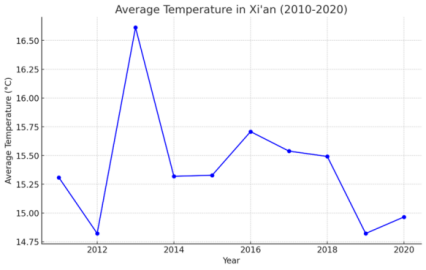
Figure 1: Average Temperature in Xi'an.
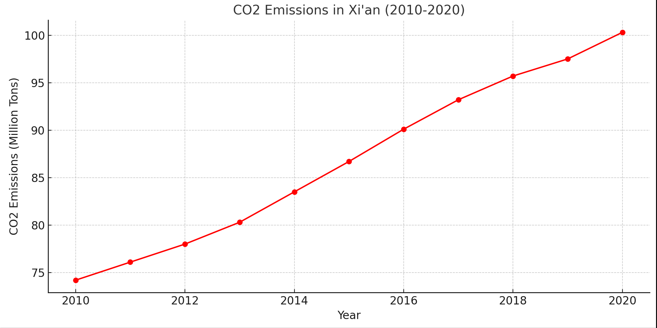
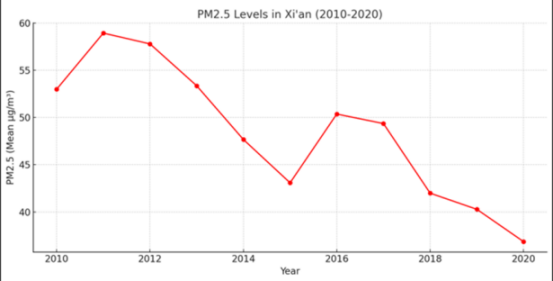
Figure 2: CO2 emissions in Xi'an. Figure 3: PM2.5 levels in Xi'an.
Figure 4 to Figure 14 are the surface temperature pictures of Geographic Information System (GIS) in Xi'an from 2010 to 2020.
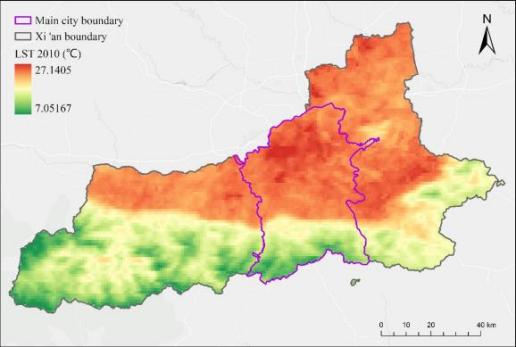
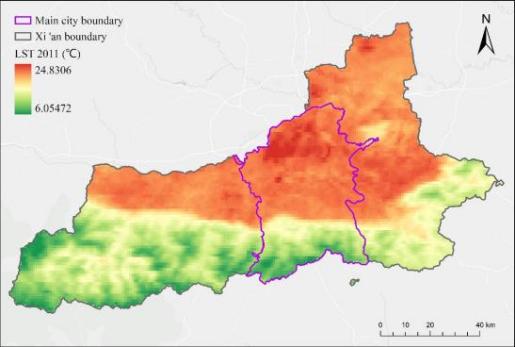
Figure 4: Surface temperature in Xi'an 2010. Figure 5: Surface temperature in Xi’an 2011.
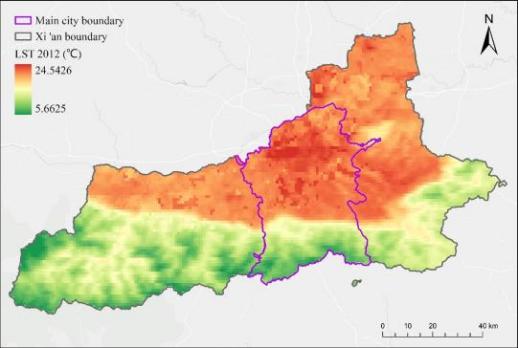
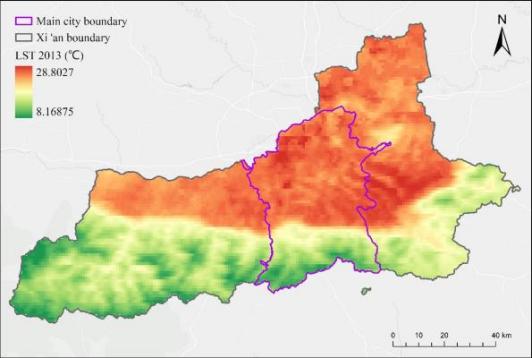
Figure 6: Surface temperature in Xi’an 2012. Figure 7: Surface temperature in Xi’an 2013.
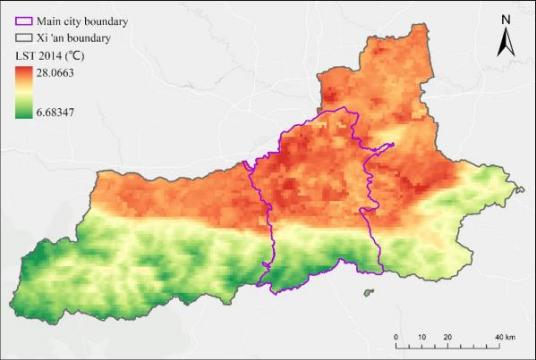
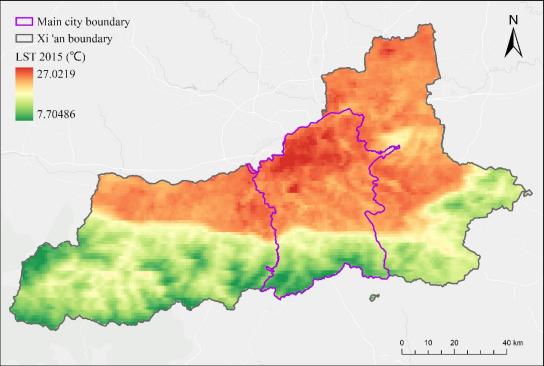
Figure 8: Surface temperature in Xi’an 2014. Figure 9: Surface temperature in Xi’an 2015.
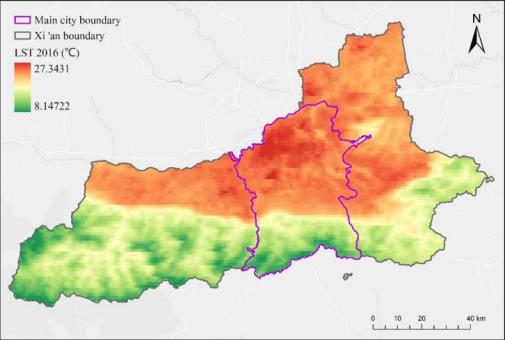
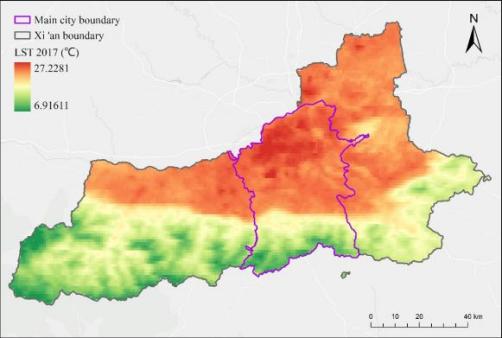
Figure 10: Surface temperature in Xi’an 2016. Figure 11: Surface temperature in Xi’an 2017.

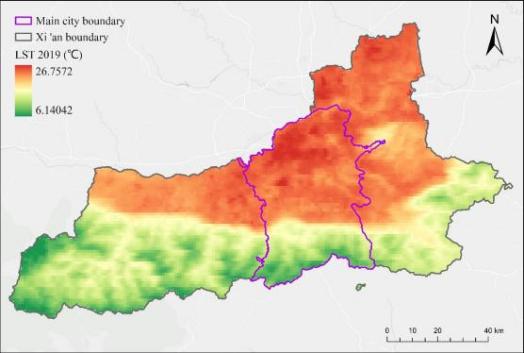
Figure 12: Surface temperature in Xi’an 2018. Figure13: Surface temperature in Xi’an 2019.
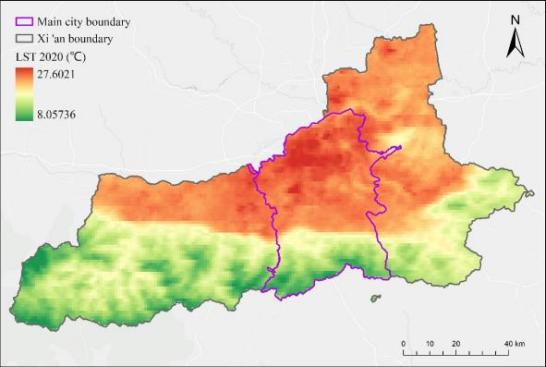
Figure 14: Surface temperature in Xi'an 2020.
3. Results
3.1. Temperature trends
The mid-year time-averaged temperatures were consistently fluctuating (Figure 1), particularly higher peaks are observed in the years of 2013 and 2016.
Differences between periods are more challenging to attribute directly: the fact that temperatures in 1971-1980 were different from those of this century does not necessarily mean there has been a warming trend (unless it can be shown by all statistical tests applied), because other external factors, such as peculiarities due unusual weather patterns or variations in atmospheric circulation may account for temperature changes besides just an UHI effect [11]. These extreme heat events, particularly in the absence of other confounding factors confirm that UHI still plays a significant role on shaping local climate.
These two events coincided with an increase in CO2 emissions, that could potentially have had some effect on changes to temperature patterns. This is also possible: that change in the jet stream increased probabilities of extreme heat events as well. Moreover, chronic urban sprawl and the associated rise in construction-related pollution levels probably aid in intensifying these trends by displacing natural cooling aspects like green spaces and canopies [12].
3.2. Spatial distribution of the UHI effect
Geographic Information System (GIS) analysis (Figure 4 to Figure 14) indicates that the industrial sectors and city centre of Xi'an, particularly the Beilin and Yanta Districts, are where the UHI effect is most noticeable. Due to the heavy foot traffic in these places, there are a lot of businesses and traffic jams, which greatly increase the buildup of heat. For example, the concrete surfaces, lack of green spaces, and constant car emissions raised the temperature in the high-rise residential complexes in Xiaozhai and the industrial clusters in Weiyang District [10].
The average surface temperature in central Xi'an peaked in 2013 at 28.8°C, and by 2020 it had slightly decreased to 27.6°C. This data is for the period between 2010 and 2020.
However, temperatures in the suburbs increased steadily, rising from 8.17°C in 2013 to 8.6°C by 2020. While suburban temperatures are still lower than those in urban areas, the city's slow growth is gradually raising suburban temperatures, indicating that the effects of high temperatures are still spreading [13].
3.3. Relationship between the greenhouse effect and UHI
The results of correlation study show a significant positive correlation between metropolitan temperatures and carbon dioxide (CO2) concentrations. Figure 2 shows that Xi'an's CO2 emissions climbed significantly between 2010 and 2020, reaching about 100 million tonnes by that year, in line with the observed variations in temperature. Despite varying trends in temperature, including a peak in 2014 and a decline in 2018, the urban heat island effect has been amplified by the general rise in CO2 levels, which has led to higher city temperatures [14].
Additionally, Figure 3 suggests that PM2.5 concentrations were relevant. Even though there was a progressive decrease in PM2.5 levels between 2010 and 2020, which resulted in better air quality, the greenhouse effect was maintained by the continuous rise in CO2 emissions. This implies that while lowering particulate matter improves air quality, long-term warming is still caused by greenhouse gases [14].
The greenhouse effect is most noticeable in the winter when trapped heat decreases the rate at which the nocturnal air cools. The urban heat island effect of Xi'an is exacerbated by both global climatic effects and urbanization, which is the cause of the city's ongoing warming [15].
4. Discussion
The above studies combine the uncertainty and sensitivity analysis of urban heat island effect (UHI) in Xi'an, It shows that The greenhouse effects has played important role on aggravating UHI; it challenges inhabitant living environment series problems, ecological requirement result from public health aspect to energy use demand. While the temperature data is consistent with global warming, its year-to-year changes are correlated with urbanization and CO2 levels; although after having peaked in about 2014 it has been declining still compared as a function of year it can be said to follows cycles that have both constant-amplitude periodicity (repeatable pattern) throughout that time range being studied, i.e from 2010-2020. The most recent representation on large scale shows an emerging increased variation rate in terms of percentage by which land surface temperatures were rising relative though slightly delayed effect due primarily because they do not reflect true effects--urban emissions increasing at alarming rates UHI continuing their slow march upward… from thence comes cohesion! While lower PM2.5. Although air quality is on the up at 5 levels, mounting greenhouse gas emissions aren't making things any cooler in town. Increased urban temperatures in the summer also symbolize a feedback between civilian dedication and emissions to warming local conditions [16].
As extreme heat events happen more often, the risks for at-risk populations - especially older people and those with respiratory conditions - are increasing. Furthermore, greenhouse gases do not only increase daytime temperatures but also impair nighttime cooling that impacts heat-related health risks in hot climates [17].
This increasing energy demand to run air conditioning throughout hotter periods has boosted both absolute and per person electricity consumption (i.e., size of the larger macroeconony) so now helps maintain a positive feedback loop supporting worse UHI effects in future: Create new problems; exploit reaction technique, Jobsian-style.
The industrial restructuring in Xi'an which is based on the sustainable energy presents a serious challenge [18].
Spatial analysis showed that the UHI effect was strongest in the densely built-up areas of central city and industrial zones, because these areas abundant building development has caused a significant increase heat storage with many vehicle emissions energy consumption. Similarly, the relatively smaller rise in suburban temperatures does nevertheless indicate a growing warmth that promises to compound UHI impacts due to continued urban expansion [19].
Expanding urban green spaces or using sustainable building practices like reflective and green roofs could, furthermore, effectively alleviate the UHI effect [20]. Promotion of public transport and discouraging private vehicle use creates to reduce carbon emission which contributes toward mitigate heat in urban area [21].
In conclusion, it is important to note that the urban–rural thermal difference and greenhouse effect should be concerned together in order to mitigate both aspects of the UHI. To reduce the future ill effects of climate change on the city and its dwellers, urban planning should be coupled with public health actions [22] complements by initiatives for sustainable energy pathways.
5. Conclusion
This study highlights the results as an example of the major oscillations, rather than just a general trend for increasing temperatures identified by this study throughout historical temperature data. Rapid urban expansion, resulting in increased greenhouse gas emissions [22], has exacerbated the "urban heat island (UHI) effect", which has important implications for public health, energy consumption and sustainable urban development [23].
Vulnerable groups (the elderly), those with existing health problems and children among other demographics, are at risk of these extreme heat events that have become more frequent in recent years. When air conditioning becomes more common due to hotter summers, the increased energy needed actually releases even more greenhouse gasses, which also exercises a positive feedback affecting both the atmospheric and UHI [24]. Spatial analysis demonstrates that the UHI effect is stronger in both city center and industrial sections, which has spread along urbanization development to suburban areas [25]. The result will probably be increased stress on infrastructure and the environment [26], which is a final but vital reason why botanic gardens need to concern themselves with urban agriculture as exemplified by these young case-study facilities.
Addressing those challenges require the creation of more green spaces, supporting a sustainable built environment, and improving public transit [27]. These actions contribute to local and global climate goals by reducing heat buildup as well a greenhouse gas emissions [28]. In China, at the provincial level in Shandong is a pressing example [10]; and doing something about urbanization or solving global environmental problem unequivocally necessitates integrated action of planning for restricted locality, public health concern as well to sustainable energy strategy succinctly described by an specific case in Chinese city Xi'an [29]. Xi'an could therefore look towards a more sustainable and resilient future for its citizens through the implementation of such measures [30].
References
[1]. Chen, R., et al. (2020) Reduction of urban heat island and associated greenhouse gas emissions. Mitig Adapt Strateg Glob Change 25, 689-711. https://doi.org/10.1007/s11027-019-09886-1.
[2]. Chapman, S., et al. The impact of urbanization and climate change on urban temperatures: a systematic review. Landscape Ecol, 32, 1921-1935.
[3]. Galdies, C., et al. (2020). Urban Heat Island Effect, Extreme Temperatures and Climate Change: A Case Study of Hong Kong SAR. In: Leal Filho, W., Nagy, G., Borga, M., Chávez Muñoz, P., Magnuszewski, A. (eds) Climate Change, Hazards and Adaptation Options. Climate Change Management. Springer, Cham.
[4]. Halim, M.A., et al. (2022) Greenhouse gases and green roofs: carbon dioxide and methane fluxes in relation to substrate characteristics. Urban Ecosyst, 25, 487-498.
[5]. Zheng, Y., et al. (2024) Assessing Building Energy Savings and the Greenhouse Gas Mitigation Potential of Green Roofs in Shanghai Using a GIS-Based Approach. Sustainability, 16, 8150.
[6]. Arifwidodo, S.D., et al. (2021). Understanding the Implications of Urban Heat Island Effects on Household Energy Consumption and Public Health in Southeast Asian Cities: Evidence from Thailand and Indonesia. In. Advances in 21st Century Human Settlements. Springer, Singapore.
[7]. China Meteorological Administration. (2024). CO2 emissions, PM2.5 levels, and temperature data. Retrieved from https://data.cma.cn.
[8]. National Cryosphere Desert Data Center. (2024). Satellite Remote Sensing Data. Retrieved from http://www.ncdc.ac.cn/portal/.
[9]. Amindin, A., et al. (2021) Spatial and temporal analysis of urban heat island using Landsat satellite images. Environ Sci Pollut Res, 28, 41439-41450.
[10]. Sidiqui, P., et al. (2022) Urban Heat Island vulnerability mapping using advanced GIS data and tools. J Earth Syst Sci, 131, 266.
[11]. Li, J., & Wang, Y. (2021). Temperature trends and urban heat island effects in Xi'an. Atmospheric Environment, 246, 118076.
[12]. Mo, G., et al. (2024) Spatiotemporal changes of urban heat island effect relative to land surface temperature: a case study of Jinan City, China. Environ Sci Pollut Res, 31, 51902-51920 .
[13]. Quan, J. (2019) Enhanced geographic information system-based mapping of local climate zones in Beijing, China. Sci. China Technol. Sci. 62, 2243-2260.
[14]. IPCC. (2007) Climate Change 2007: Synthesis Report. Contribution of Working Groups I, II and III to the Fourth Assessment Report of the Intergovernmental Panel on Climate Change. IPCC, Geneva, Switzerland, pp.104 .
[15]. Joy B. Winbourne, et al. (2020). Tree Transpiration and Urban Temperatures: Current Understanding, Implications, and Future Research Directions, BioScience, Volume 70, Issue 7, July, pp.576–588.
[16]. U.S. Environmental Protection Agency. (2021). Heat Island Impacts. U.S. EPA. https://www.epa.gov/heatislands/heat-island-impacts.
[17]. BMJ. (2020). Impact of Extreme Heat on Global Public Health. British Medical Journal. https://www.bmj.com.
[18]. United Nations Environment Programme and International Energy Agency. (2020). Cooling Emissions and Policy Synthesis Report. UNEP, Nairobi, and IEA, Paris. https://www.iea.org/reports/cooling-emissions-and-policy-synthesis-report.
[19]. Jeremy Gregory, Hessam Azarijafari. (2021). Urban Heat Islands. Massachusetts Institute of Technology, MIT Climate Portal, April 16. Retrieved from https://climate.mit.edu/explainers/urban-heat-islands.
[20]. Cheela, V.R.S., et al. (2021). Combating Urban Heat Island Effect - A Review of Reflective Pavements and Tree Shading Strategies. Buildings, 11, 93.
[21]. Irfeey, A.M.M., et al. (2023). Sustainable Mitigation Strategies for Urban Heat Island Effects in Urban Areas. Sustainability, 15, 10767.
[22]. MacLachlan A., et al. (2021) Sustainable City Planning: A Data-Driven Approach for Mitigating Urban Heat. Front. Built Environ. 6:519599.
[23]. Hasan Rashed, A. (2023). The Impacts of Unsustainable Urbanization on the Environment. Sustainable Regional Planning, Publisher: IntechOpen, pp.1-12.
[24]. Aboulnaga, M., et al. (2024). Understanding Urban Heat Island Effect: Causes, Impacts, Factors, and Strategies for Better Livability and Climate Change Mitigation and Adaptation. In: Livable Cities. Springer, Cham.
[25]. Chen, M.; et al. (2020). Influence of Urban Scale and Urban Expansion on the Urban Heat Island Effect in Metropolitan Areas: Case Study of Beijing–Tianjin–Hebei Urban Agglomeration. Remote Sens, 12, 3491.
[26]. Bindajam, A.A., et al. (2024) Evaluating the impact of urbanization on the urban heat islands through integrated radius and non-linear regression approach. Environ Sci Pollut Res, 31, 44120–44135.
[27]. Kumar, A., et al. (2023). Urban Green Spaces for Environmental Sustainability and Climate Resilience. The Palgrave Handbook of Socio-ecological Resilience in the Face of Climate Change. Palgrave Macmillan, Singapore. https://doi.org/10.1007/978-981-99-2206-2_23.
[28]. Azizi, L., Kouddane, N. (2024) The green city as a driver of sustainable development. J. Umm Al-Qura Univ. Eng.Archit. https://doi.org/10.1007/s43995-024-00077-x.
[29]. Gianluca Crispi, Rashid Abubakar. (2022). Urban Planning Law for Climate Smart Cities: The Urban Law Module of the Law and Climate Change Toolkit. United Nations Human Settlements Programme, UN-Habitat, pp.122. https://www.unhabitat.org.
[30]. Mohanty, M. (2020). Sustainable Urban Planning and Making Sustainable Cities. In: Leal Filho, W., Azul, A., Brandli, L., Özuyar, P., Wall, T. (eds) Sustainable Cities and Communities. Encyclopedia of the UN Sustainable Development Goals. Springer, Cham. https://doi.org/10.1007/978-3-319-71061-7_62-1.
Cite this article
Wang,Y. (2025). The Profound Impact of the Greenhouse Effect on Urban Environments Based on Mechanisms and Mitigation Strategies. Applied and Computational Engineering,130,1-8.
Data availability
The datasets used and/or analyzed during the current study will be available from the authors upon reasonable request.
Disclaimer/Publisher's Note
The statements, opinions and data contained in all publications are solely those of the individual author(s) and contributor(s) and not of EWA Publishing and/or the editor(s). EWA Publishing and/or the editor(s) disclaim responsibility for any injury to people or property resulting from any ideas, methods, instructions or products referred to in the content.
About volume
Volume title: Proceedings of the 5th International Conference on Materials Chemistry and Environmental Engineering
© 2024 by the author(s). Licensee EWA Publishing, Oxford, UK. This article is an open access article distributed under the terms and
conditions of the Creative Commons Attribution (CC BY) license. Authors who
publish this series agree to the following terms:
1. Authors retain copyright and grant the series right of first publication with the work simultaneously licensed under a Creative Commons
Attribution License that allows others to share the work with an acknowledgment of the work's authorship and initial publication in this
series.
2. Authors are able to enter into separate, additional contractual arrangements for the non-exclusive distribution of the series's published
version of the work (e.g., post it to an institutional repository or publish it in a book), with an acknowledgment of its initial
publication in this series.
3. Authors are permitted and encouraged to post their work online (e.g., in institutional repositories or on their website) prior to and
during the submission process, as it can lead to productive exchanges, as well as earlier and greater citation of published work (See
Open access policy for details).
References
[1]. Chen, R., et al. (2020) Reduction of urban heat island and associated greenhouse gas emissions. Mitig Adapt Strateg Glob Change 25, 689-711. https://doi.org/10.1007/s11027-019-09886-1.
[2]. Chapman, S., et al. The impact of urbanization and climate change on urban temperatures: a systematic review. Landscape Ecol, 32, 1921-1935.
[3]. Galdies, C., et al. (2020). Urban Heat Island Effect, Extreme Temperatures and Climate Change: A Case Study of Hong Kong SAR. In: Leal Filho, W., Nagy, G., Borga, M., Chávez Muñoz, P., Magnuszewski, A. (eds) Climate Change, Hazards and Adaptation Options. Climate Change Management. Springer, Cham.
[4]. Halim, M.A., et al. (2022) Greenhouse gases and green roofs: carbon dioxide and methane fluxes in relation to substrate characteristics. Urban Ecosyst, 25, 487-498.
[5]. Zheng, Y., et al. (2024) Assessing Building Energy Savings and the Greenhouse Gas Mitigation Potential of Green Roofs in Shanghai Using a GIS-Based Approach. Sustainability, 16, 8150.
[6]. Arifwidodo, S.D., et al. (2021). Understanding the Implications of Urban Heat Island Effects on Household Energy Consumption and Public Health in Southeast Asian Cities: Evidence from Thailand and Indonesia. In. Advances in 21st Century Human Settlements. Springer, Singapore.
[7]. China Meteorological Administration. (2024). CO2 emissions, PM2.5 levels, and temperature data. Retrieved from https://data.cma.cn.
[8]. National Cryosphere Desert Data Center. (2024). Satellite Remote Sensing Data. Retrieved from http://www.ncdc.ac.cn/portal/.
[9]. Amindin, A., et al. (2021) Spatial and temporal analysis of urban heat island using Landsat satellite images. Environ Sci Pollut Res, 28, 41439-41450.
[10]. Sidiqui, P., et al. (2022) Urban Heat Island vulnerability mapping using advanced GIS data and tools. J Earth Syst Sci, 131, 266.
[11]. Li, J., & Wang, Y. (2021). Temperature trends and urban heat island effects in Xi'an. Atmospheric Environment, 246, 118076.
[12]. Mo, G., et al. (2024) Spatiotemporal changes of urban heat island effect relative to land surface temperature: a case study of Jinan City, China. Environ Sci Pollut Res, 31, 51902-51920 .
[13]. Quan, J. (2019) Enhanced geographic information system-based mapping of local climate zones in Beijing, China. Sci. China Technol. Sci. 62, 2243-2260.
[14]. IPCC. (2007) Climate Change 2007: Synthesis Report. Contribution of Working Groups I, II and III to the Fourth Assessment Report of the Intergovernmental Panel on Climate Change. IPCC, Geneva, Switzerland, pp.104 .
[15]. Joy B. Winbourne, et al. (2020). Tree Transpiration and Urban Temperatures: Current Understanding, Implications, and Future Research Directions, BioScience, Volume 70, Issue 7, July, pp.576–588.
[16]. U.S. Environmental Protection Agency. (2021). Heat Island Impacts. U.S. EPA. https://www.epa.gov/heatislands/heat-island-impacts.
[17]. BMJ. (2020). Impact of Extreme Heat on Global Public Health. British Medical Journal. https://www.bmj.com.
[18]. United Nations Environment Programme and International Energy Agency. (2020). Cooling Emissions and Policy Synthesis Report. UNEP, Nairobi, and IEA, Paris. https://www.iea.org/reports/cooling-emissions-and-policy-synthesis-report.
[19]. Jeremy Gregory, Hessam Azarijafari. (2021). Urban Heat Islands. Massachusetts Institute of Technology, MIT Climate Portal, April 16. Retrieved from https://climate.mit.edu/explainers/urban-heat-islands.
[20]. Cheela, V.R.S., et al. (2021). Combating Urban Heat Island Effect - A Review of Reflective Pavements and Tree Shading Strategies. Buildings, 11, 93.
[21]. Irfeey, A.M.M., et al. (2023). Sustainable Mitigation Strategies for Urban Heat Island Effects in Urban Areas. Sustainability, 15, 10767.
[22]. MacLachlan A., et al. (2021) Sustainable City Planning: A Data-Driven Approach for Mitigating Urban Heat. Front. Built Environ. 6:519599.
[23]. Hasan Rashed, A. (2023). The Impacts of Unsustainable Urbanization on the Environment. Sustainable Regional Planning, Publisher: IntechOpen, pp.1-12.
[24]. Aboulnaga, M., et al. (2024). Understanding Urban Heat Island Effect: Causes, Impacts, Factors, and Strategies for Better Livability and Climate Change Mitigation and Adaptation. In: Livable Cities. Springer, Cham.
[25]. Chen, M.; et al. (2020). Influence of Urban Scale and Urban Expansion on the Urban Heat Island Effect in Metropolitan Areas: Case Study of Beijing–Tianjin–Hebei Urban Agglomeration. Remote Sens, 12, 3491.
[26]. Bindajam, A.A., et al. (2024) Evaluating the impact of urbanization on the urban heat islands through integrated radius and non-linear regression approach. Environ Sci Pollut Res, 31, 44120–44135.
[27]. Kumar, A., et al. (2023). Urban Green Spaces for Environmental Sustainability and Climate Resilience. The Palgrave Handbook of Socio-ecological Resilience in the Face of Climate Change. Palgrave Macmillan, Singapore. https://doi.org/10.1007/978-981-99-2206-2_23.
[28]. Azizi, L., Kouddane, N. (2024) The green city as a driver of sustainable development. J. Umm Al-Qura Univ. Eng.Archit. https://doi.org/10.1007/s43995-024-00077-x.
[29]. Gianluca Crispi, Rashid Abubakar. (2022). Urban Planning Law for Climate Smart Cities: The Urban Law Module of the Law and Climate Change Toolkit. United Nations Human Settlements Programme, UN-Habitat, pp.122. https://www.unhabitat.org.
[30]. Mohanty, M. (2020). Sustainable Urban Planning and Making Sustainable Cities. In: Leal Filho, W., Azul, A., Brandli, L., Özuyar, P., Wall, T. (eds) Sustainable Cities and Communities. Encyclopedia of the UN Sustainable Development Goals. Springer, Cham. https://doi.org/10.1007/978-3-319-71061-7_62-1.