


1. Introduction
As a risk management tool, health insurance plays a vital role in the medical security system of modern society [1]. With the aging of the population and the continuous rise of medical costs, accurate prediction of health insurance premiums is particularly important [2]. The reasonable pricing of insurance premiums not only affects the profitability of insurance companies, but also directly affects the economic burden of insurance holders and their ability to obtain medical security. In the past, traditional premium forecasting mainly relied on statistical methods and rules of thumb, but these methods often lacked sufficient dynamic and flexibility to effectively capture complex health risk factors and changes in policyholder behavior [3]. Therefore, researchers began to seek more advanced technical means to improve the accuracy and real-time performance of premium prediction, so as to provide more reasonable solutions for insurance companies and their customers [4].
In recent years, machine learning algorithms have been widely used in various fields, including health insurance premium prediction, due to their superior performance in big data analysis [5]. Compared with traditional statistical methods, machine learning models can automatically identify potential patterns and rules by analyzing a large amount of historical data [6]. Instead of relying solely on previous assumptions, these models use feature engineering to introduce more variables into the analysis, such as the policyholder's age, gender, health status, lifestyle, and past claims records. Through these multi-dimensional data, machine learning algorithms can build more complex and accurate prediction models, thus making premium pricing more personalized to meet the needs of different policyholders [7].
The use of machine learning in health insurance premium forecasting is mainly reflected in several aspects. First, it significantly improves prediction accuracy. Using algorithms such as decision trees [8], random forests [9], gradient hoists (GBM) [10], deep learning, etc., can process large amounts of nonlinear data and capture complex interactions, which are difficult to achieve with traditional methods. Second, machine learning is highly adaptable. As market conditions and user behavior change, models can be constantly updated through online and incremental learning to maintain the accuracy and relevance of their predictions. In addition, machine learning can automatically select features and identify the most influential factors to guide insurance companies' decisions in areas such as product design and marketing, improving overall operational efficiency. In this paper, a variety of machine learning algorithms are used to predict health insurance premiums, and the effects of various machine learning algorithms on health insurance premium prediction are compared and analyzed.
2. Data set introduction
The data set used in this article is an open source data set on Kaggle, and the health insurance data set is a very classic data set, consisting of basic information and health insurance costs of 1338 customers. The purpose of this dataset is to build a medical cost prediction model through the relationship between basic customer information and insurance cost, and provide better services for insurance companies. The dataset contains a number of key characteristics, such as age, gender, BMI, number of children, and whether the customer smokes [11]. Select some data sets for display, and the results are shown in Table 1.
Table 1: Partial dataset.
Age | Sex | Bmi | Children | Smoker | Region | Id | Charges |
24 | male | 23.655 | 0 | no | northwest | 693 | 2352.96845 |
28 | female | 26.51 | 2 | no | southeast | 1297 | 4340.4409 |
51 | male | 39.7 | 1 | no | southwest | 634 | 9391.346 |
47 | male | 36.08 | 1 | yes | southeast | 1022 | 42211.1382 |
46 | female | 28.9 | 2 | no | southwest | 178 | 8823.279 |
3. Statistical analysis of data
The distribution trends and proportions of age, BMI and premium are shown in Figures 1, 2 and 3, respectively:
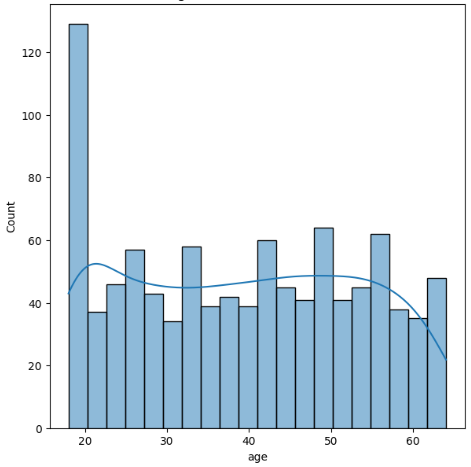
Figure 1: Age.
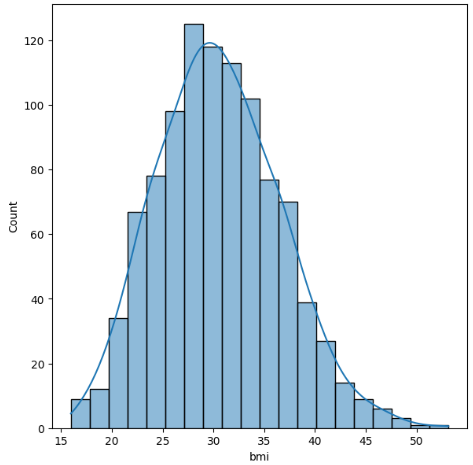
Figure 2: Bmi.
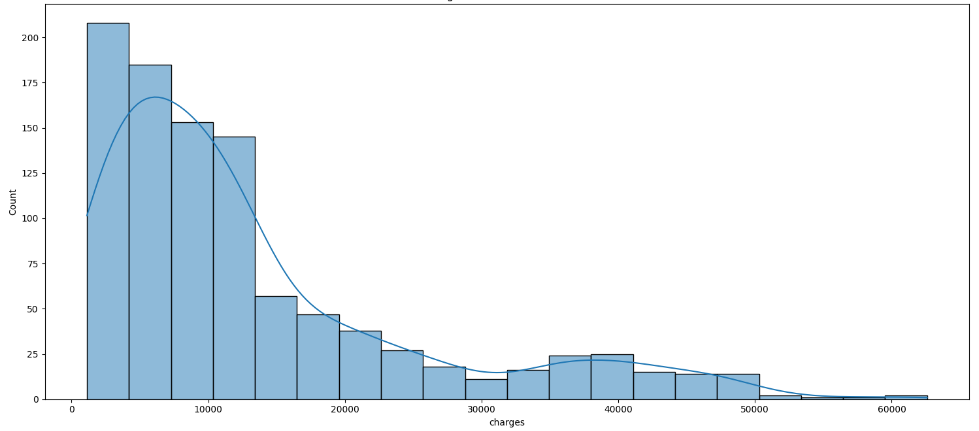
Figure 3: Charges.
From the above figure it can be observed that the dataset includes all age groups and is well balanced across the age groups. BMI is normally distributed in the dataset in the fee column most of the premiums are below 13500.
4. Method
4.1. Linear regression model
Linear regression is a commonly used statistical method that aims to establish a linear relationship between independent variables (features) and dependent variables (target variables). The basic idea is to describe this relationship by fitting a straight line so that the line can predict the value of the dependent variable as accurately as possible. By analyzing the available data, the linear regression model tries to find the right parameters to minimize the error between the predicted value and the actual observed value. This linear relationship can not only describe data trends, but also be used to predict the future, so it is widely used in many fields such as economics, medicine, and engineering [12]. The schematic diagram of the linear regression model is shown in Figure 4.
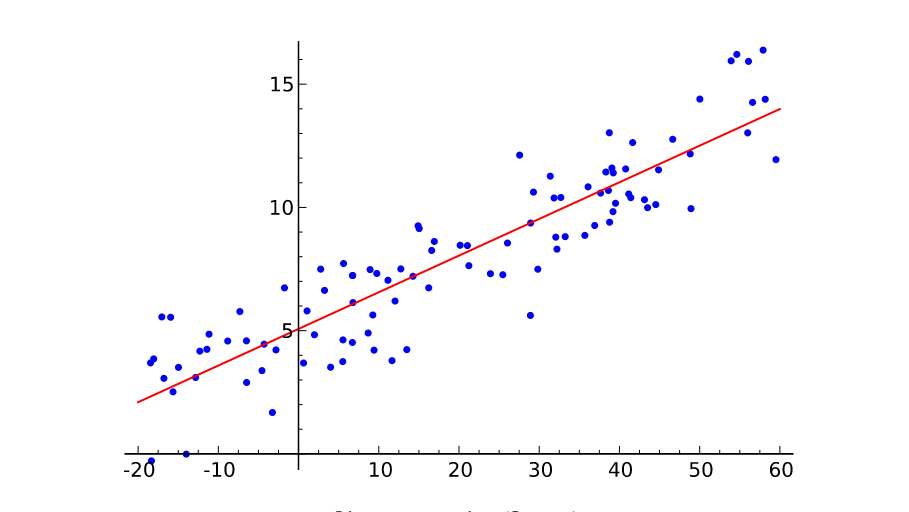
Figure 4: The schematic diagram of the linear regression model.
In the process of training a linear regression model, the most important step is to determine the weight of each feature, which is the regression coefficient. The method usually uses least squares, which is designed to find the parameters that minimize the difference between the predicted and true values. During the calculation, the model evaluates the error between the results predicted with the current parameters and the actual data, and continuously adjusts these parameters until the error is minimal. Therefore, the linear regression model can automatically learn the best fitting line suitable for a specific data set through this optimization process, which makes the model more powerful in predicting new data.
4.2. Decision tree model
Decision tree is a supervised learning algorithm that is widely used in classification and regression tasks. This model uses a series of simple decision rules to divide the data into different categories or predicted values. The basic idea of decision tree construction is to start from the root node and gradually segment the data set according to different values of features until a certain stopping condition is reached (such as reaching a specified depth or the number of node samples is too small). Each node represents the test of a feature, each branch represents the value of the feature, and each leaf node corresponds to the final category or numerical prediction. Through this hierarchical structure, decision trees can visually represent the data decision process [13]. The principle of decision tree model is shown in Figure 5.
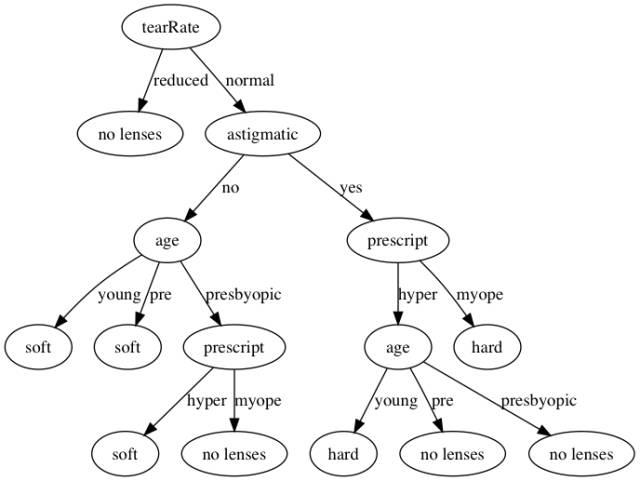
Figure 5: The principle of decision tree model.
When constructing a decision tree, choosing the features to split is a key step. Typically, criteria such as information gain, Gini coefficient, or mean square error are used to evaluate the partitioning effect of each feature. Information gain measures how much the uncertainty of the data is reduced after selecting a feature as the basis for splitting. Specifically, the greater the information gain, the more significant the improvement of this feature to the classification effect. Therefore, the decision tree will preferentially select the features with the highest information gain or other evaluation indicators for splitting. By continuously applying this process, the decision tree is gradually formed, eventually producing a model that can effectively classify or predict new data[14].
4.3. Random forest model
Random forest is an ensemble learning method mainly used for classification and regression tasks. It works by building multiple decision trees and combining their results to improve the accuracy and stability of the model. The basic idea behind random forests is "the wisdom of many trees." Specifically, a random forest starts by randomly selecting several samples from the original data set (sampling with put back) to build multiple decision trees, and each tree randomly selects features to divide during construction, thus increasing the diversity of the model. Finally, the random forest improves the accuracy and robustness of its predictions by aggregating the predictions of all trees (using a voting mechanism for the classification task and averaging for the regression task) to arrive at the final prediction result [15]. The schematic diagram of the random forest algorithm is shown in Figure 6.
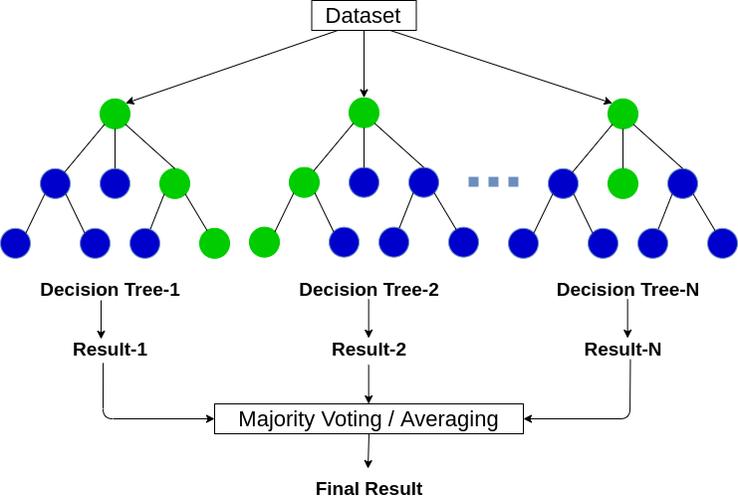
Figure 6: The schematic diagram of the random forest algorithm.
In a random forest, randomness is introduced into the construction process of each tree, and the split nodes are determined by randomly selecting features. This is different from the feature selection of traditional decision trees, which weakens the correlation between trees and reduces the overfitting risk of the model. In the construction of each tree, a part of the features is usually randomly selected from the total feature set, which helps to reduce the dependence of the model on different features and improve the generalization ability of the model. Because each tree is trained on a different subset of samples and features, random forests are able to efficiently capture the diversity of data and ultimately form a powerful integrated model.
5. Result
The training set, validation set and test set are divided according to 6:2:2, the training set is used to train the model, the validation set is used to validate the results of the training, and the test set is used for the testing of the model, and the results are shown in Table 2 and Figure 7.
Table 2: Model evaluation.
Model | Training Set R2 Scores | Test Set R2 Scores |
Linear Regression | 0.7486 | 0.7584 |
Decision Tree Regressor | 0.9872 | 0.7097 |
Random Forest Regressor | 0.9665 | 0.8564 |
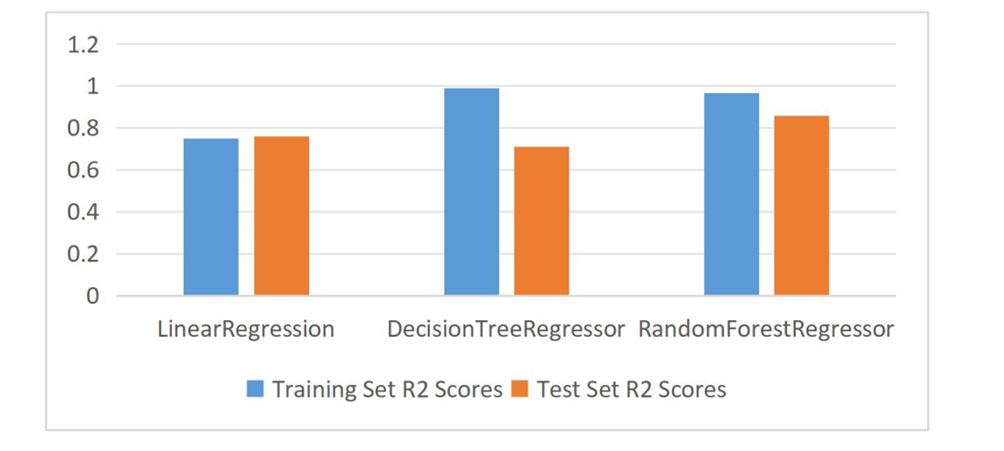
Figure 7: Model evaluation.
From the above figure, it can be seen that the random forest regression has the best prediction effect, with a model score of 0.8564, which is the best prediction effect of the three models; followed by the linear regression model, with a model score of 0.7584; and the worst prediction effect is the decision tree, with a model score of 0.7097.
6. Conclusion
In this study, we applied a variety of machine learning algorithms to predict health insurance premiums, and compared the performance of each model on this task. The selected open source data set provides a rich data base for the research and facilitates the implementation of different prediction algorithms. We focused on using three different machine learning models: linear regression, decision trees, and random forests.
First of all, as a basic statistical learning method, the main advantages of linear regression model lie in its simplicity and high interpretability. We conducted linear regression modeling on the data, and finally obtained a model score of 0.7584. This indicates that linear regression models are effective in predicting health insurance premiums, but their linear assumptions about the data may limit their ability to capture complex relationships.
Next, we use the decision tree model to make predictions. The decision tree can predict the target variable by constructing the tree structure and judging the feature condition. In this experiment, the model score of decision tree is 0.7097, which is relatively low performance. Although decision trees can handle nonlinear relationships and are easy to understand, they are sensitive to noise in the data, which can easily lead to overfitting, especially in the case of small data sets or more features, which can affect their overall performance.
After the experiment, the score of the random forest model is 0.8564, which is significantly better than the other two models. This result demonstrates the power of random forests in dealing with complex data sets, especially when there are multiple relationships between features. Because it combines the predictions of multiple trees, the random forest effectively reduces the risk of overfitting that can occur in a single decision tree and enhances the generalization ability of the final model.
In summary, the results of this study show that the random forest model performs best in the prediction of health insurance premiums, demonstrating the effectiveness of ensemble learning methods when dealing with complex data. Therefore, we can conclude that random forest model is a better choice when facing the problem of health insurance premium prediction.
References
[1]. Ugochukwu O ,Elochukwu U .Machine learning for an explainable cost prediction of medical insurance[J].Machine Learning with Applications,2024,15100516-.
[2]. Ridzuan, Ahmad Nur Azam Ahmad, et al. "Health Insurance Premium Pricing Using Machine Learning Methods." Journal of Advanced Research in Applied Sciences and Engineering Technology 41.1 (2024): 134-141.
[3]. Nurahmed H T ,Mekashaw E B .Dropout rate and associated factors of community-based health insurance beneficiaries in Ethiopia: a systematic review and meta-analysis[J].BMC Public Health,2023,23(1):2425-2425.
[4]. C R K V ,A J C R V V ,Michel O .Risk Adjustment in Health Insurance Markets: Do Not Overlook the Real Healthy.[J].Medical care,2023,
[5]. Siegfried G ,Juliane T ,Stefanie S , et al.Decreasing COPD-related incidences and hospital admissions in a German health insurance population[J].Scientific Reports, 2023,13(1): 21293-21293.
[6]. Vicky V ,L J W ,Michelle K .Experiences of low-income college students in selection of health insurance, access, and quality of care.[J].Journal of American college health : J of ACH,2023,11-10.
[7]. S. A M ,Katia B ,Michelle K , et al.Access to Specialized Care Across the Lifespan in Tetralogy of Fallot[J].CJC Pediatric and Congenital Heart Disease,2023,2(6PA):267-282.
[8]. Jungtaek L .Effects of private health insurance on healthcare services during the MERS Pandemic: Evidence from Korea[J].Heliyon,2023,9(12):e22241-e22241.
[9]. Okensama L ,E B A ,A K H , et al.United States insurance coverage of immediate lymphatic reconstruction.[J].Journal of surgical oncology,2023,
[10]. HealthPartners Debuts 2024 Medicare Advantage Plans[J].Manufacturing Close - Up,2023.
[11]. Patra, Gagan Kumar, et al. "An Analysis and Prediction of Health Insurance Costs Using Machine Learning-Based Regressor Techniques." Journal of Data Analysis and Information Processing 12.4 (2024): 581-596.
[12]. Nabanoba, Christine, and Henry Zakumumpa. "Experiences of membership in munno mubulwadde (your friend indeed)-a novel community-based health insurance scheme in Luwero district in rural central Uganda." BMC Health Services Research 24.1 (2024): 89.
[13]. Yu, Haiyan, et al. "Personalized algorithmic pricing decision support tool for health insurance: The case of stratifying gestational diabetes mellitus into two groups." Information & Management 61.3 (2024): 103945.
[14]. Hong, Long, and Corina Mommaerts. "Time aggregation in health insurance deductibles." American Economic Journal: Economic Policy 16.2 (2024): 270-299.
[15]. Fossen, Frank M., et al. "The cost of health insurance and entry into entrepreneurship." Small Business Economics (2024): 1-23.
Cite this article
Gao,D. (2025). Health Insurance Premium Prediction Based on Multiple Machine Learning Algorithms. Applied and Computational Engineering,100,146-153.
Data availability
The datasets used and/or analyzed during the current study will be available from the authors upon reasonable request.
Disclaimer/Publisher's Note
The statements, opinions and data contained in all publications are solely those of the individual author(s) and contributor(s) and not of EWA Publishing and/or the editor(s). EWA Publishing and/or the editor(s) disclaim responsibility for any injury to people or property resulting from any ideas, methods, instructions or products referred to in the content.
About volume
Volume title: Proceedings of the 5th International Conference on Signal Processing and Machine Learning
© 2024 by the author(s). Licensee EWA Publishing, Oxford, UK. This article is an open access article distributed under the terms and
conditions of the Creative Commons Attribution (CC BY) license. Authors who
publish this series agree to the following terms:
1. Authors retain copyright and grant the series right of first publication with the work simultaneously licensed under a Creative Commons
Attribution License that allows others to share the work with an acknowledgment of the work's authorship and initial publication in this
series.
2. Authors are able to enter into separate, additional contractual arrangements for the non-exclusive distribution of the series's published
version of the work (e.g., post it to an institutional repository or publish it in a book), with an acknowledgment of its initial
publication in this series.
3. Authors are permitted and encouraged to post their work online (e.g., in institutional repositories or on their website) prior to and
during the submission process, as it can lead to productive exchanges, as well as earlier and greater citation of published work (See
Open access policy for details).
References
[1]. Ugochukwu O ,Elochukwu U .Machine learning for an explainable cost prediction of medical insurance[J].Machine Learning with Applications,2024,15100516-.
[2]. Ridzuan, Ahmad Nur Azam Ahmad, et al. "Health Insurance Premium Pricing Using Machine Learning Methods." Journal of Advanced Research in Applied Sciences and Engineering Technology 41.1 (2024): 134-141.
[3]. Nurahmed H T ,Mekashaw E B .Dropout rate and associated factors of community-based health insurance beneficiaries in Ethiopia: a systematic review and meta-analysis[J].BMC Public Health,2023,23(1):2425-2425.
[4]. C R K V ,A J C R V V ,Michel O .Risk Adjustment in Health Insurance Markets: Do Not Overlook the Real Healthy.[J].Medical care,2023,
[5]. Siegfried G ,Juliane T ,Stefanie S , et al.Decreasing COPD-related incidences and hospital admissions in a German health insurance population[J].Scientific Reports, 2023,13(1): 21293-21293.
[6]. Vicky V ,L J W ,Michelle K .Experiences of low-income college students in selection of health insurance, access, and quality of care.[J].Journal of American college health : J of ACH,2023,11-10.
[7]. S. A M ,Katia B ,Michelle K , et al.Access to Specialized Care Across the Lifespan in Tetralogy of Fallot[J].CJC Pediatric and Congenital Heart Disease,2023,2(6PA):267-282.
[8]. Jungtaek L .Effects of private health insurance on healthcare services during the MERS Pandemic: Evidence from Korea[J].Heliyon,2023,9(12):e22241-e22241.
[9]. Okensama L ,E B A ,A K H , et al.United States insurance coverage of immediate lymphatic reconstruction.[J].Journal of surgical oncology,2023,
[10]. HealthPartners Debuts 2024 Medicare Advantage Plans[J].Manufacturing Close - Up,2023.
[11]. Patra, Gagan Kumar, et al. "An Analysis and Prediction of Health Insurance Costs Using Machine Learning-Based Regressor Techniques." Journal of Data Analysis and Information Processing 12.4 (2024): 581-596.
[12]. Nabanoba, Christine, and Henry Zakumumpa. "Experiences of membership in munno mubulwadde (your friend indeed)-a novel community-based health insurance scheme in Luwero district in rural central Uganda." BMC Health Services Research 24.1 (2024): 89.
[13]. Yu, Haiyan, et al. "Personalized algorithmic pricing decision support tool for health insurance: The case of stratifying gestational diabetes mellitus into two groups." Information & Management 61.3 (2024): 103945.
[14]. Hong, Long, and Corina Mommaerts. "Time aggregation in health insurance deductibles." American Economic Journal: Economic Policy 16.2 (2024): 270-299.
[15]. Fossen, Frank M., et al. "The cost of health insurance and entry into entrepreneurship." Small Business Economics (2024): 1-23.