


1. Introduction
According to an article published on EDFS Notes, over 75 percent of US households own at least one credit card in 2019 [1, 2] and the number is also expected to keep increasing in the future. Credit cards have become an important part of the US society and economy because it is such a convenient way to do day-to-day transactions and it helps people to build their credit scores, earn cash back, and get many other great benefits. However, credit cards also have many downsides, one of them being security concerns. Credit cards allow criminals to fake credit card holders’ identities and steal money even without having physical cards. Because of that, millions of dollars are spent by businesses worldwide every year on credit card fraud detection, which is a huge cost. There are various technologies that are currently being widely used to prevent credit card fraud and this research is focused on machine learning [3].
Machine learning is an approach for computers to learn and identify patterns from a set of training data and then make predictions on the new input data [4] and, it is being utilized in many different fields nowadays, such as healthcare, finance, environment, marketing, etc.
Credit card fraud detection is a problem where transactions are categorized into two different categories -- fraud or non-fraud, and machine learning is a great way to solve problems like this because a machine learning model only needs to be trained once and then it can continuously take in new transactional data in real-time and make a prediction for each transaction. Depending on the demand, a model can also be continuously trained and learned with new data available and even be retrained with the latest data if it no longer makes accurate predictions. However, there are some difficulties and questions that might occur during the process of applying machine learning to detect fraudulent transactions in real life, such as how to handle the highly imbalanced dataset, which algorithm works best for detecting fraudulent transactions, and how to limit the number of false categorizations.
This research compares the performance of different machine-learning algorithms in classifying fraudulent and non-fraudulent transactions and introduces techniques like undersampling and oversampling and how they affect the performance of the algorithms.
2. Introduction
2.1. Dataset
The data is gathered from real credit card transactions that occurred in September 2013 in Europe, and the dataset can be accessed on Kaggle by anyone[3].
The dataset includes 30 features and 1 label. Due to privacy issues, the 28 features in the dataset other than “Time” and “Amount” had already been transformed by PCA before the dataset was publicized and the dataset only contains numeral values. For the features, “Time” denotes the number of seconds passed by after the first transaction in the dataset occurred and “Amount” denotes the amount of money that was involved in each transaction. For the label, “Class” denotes the type of the transaction, 1 for fraudulent and 0 for non-fraudulent.
The first step of the data-processing was to apply RobustScaler, which is a scaler that helps to minimize the effect of outlier values in the data, to scale the values in features “Time” and “Amount”.
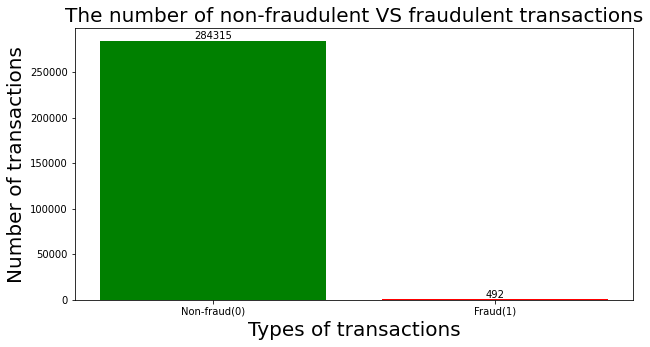
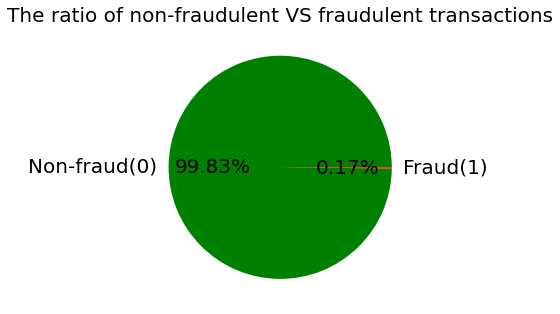
Figure 1 and Figure 2 show the total number and ratio of the two types of transactions in the dataset, which visualize the fact that the class distribution is highly skewed and it might cause problems like machine learning models not being able to fully understand the characteristics of fraudulent transactions and biasedly categorizing fraudulent transactions as legit transactions. There are various ways to handle the unbalanced data and techniques such as random undersampling and smote oversampling are applied in this research.
|
Figure 1. The total number of legit and fraudulent transactions. |
| |
Figure 2. The ratio of legit and fraudulent transactions. | |
2.2. Undersampling and oversampling
Random undersampling is a technique that randomly selects and deletes data in the majority class of a dataset and stops until the amount of data in the majority and minority classes is equivalent [5]. Generally, the benefit of applying undersampling to the training data is that it prevents machine learning algorithms from biasing toward the majority class, but the downside is that a lot of critical information about the majority class is lost during the process.
Oversampling is a technique that creates new data in the minority class of a dataset until the minority class and majority classes have the same amount of data. Smote, which stands for Synthetic Minority Oversampling Technique, is one of the most common methods to implement oversampling, and the principle behind smote is that it randomly picks an instance from the minority class and locates the k closest minority class data points of the instance. Then, it chooses one of the k closest instances and multiple the difference between the two instances by a random value between zero and one, and a new artificial data instance is then created for the minority class [6, 7].
The advantage of smote oversampling is that it creates similar data points based on the minority class instead of just duplicating the existing data, and it doesn’t cause information loss like undersampling. Smote oversampling also has disadvantages such as overfitting and noisy data
\( {x^{ \prime }}= x + rand(0, 1)* |x - {x_{k}}|\ \ \ (1) \)
2.3. Machine learning Algorithms
2.3.1. Gaussian Naive Bayes. The calculation for Bayes’ Theorem:
\( P(A | B) = \frac{P(B | A) \cdot P(A)}{P(B)}\ \ \ (2) \)
Gaussian Naive Bayes is based on the Bayes theorem, which is a mathematical way to calculate the probability of an event given other conditions [8, 9]. Gaussian Naive Bayes assumes that the features of the dataset are all with continuous values and the algorithm is often used when the distributions of the features are normal according to the Gaussian distribution.
2.3.2. Logistic Regression. The Sigmoid function is calculated as:
\( S(x)= \frac{1}{1 + {e^{-x}}}\ \ \ (3) \)
Logistic Regression is often used to solve problems where there are only two different types of outcomes, and the possible outcomes are predefined. The algorithm analyses the relationship between different variables in a dataset and then uses the Sigmoid function, which helps to convert the predicted values to numerical numbers between 0 to 1, to calculate the probability of the outcomes [10, 11].
2.3.3. SVM. Support vector machine (SVM) is originally invented with the intention to solve classification problems with only two classes. The basic principle behind SVM is that it finds the best boundary that separates the data into two different classes and then uses the boundary to make predictions on the new input data.
2.3.4. Random Forest. Random Forest contains a specified number of decision trees and what each decision tree do is it starts from a root node and then makes splits based on the given variables and conditions, and the input data gets divided into correct categories once it reaches the bottom of the decision tree. The prediction of the random forest is decided based on the major result made by all the decision trees in the algorithm. Also, Random Forest with enough decision trees has a lower chance of overfitting compared to other machine learning algorithms. The disadvantage of Random Forest is that the more trees a random forest has, the more computational power and space it requires to train the algorithm and make predictions after the algorithm was trained.
2.3.5. Sequential Neural Networks. Neural Network is an algorithm that was invented based on how the neurons work in human brains. The algorithm is constructed by the order of an input layer, some hidden layers, and an output layer. The architecture of the entire model plays an important role in the performance of the algorithm, such as the number of hidden layers in the network and the number of neurons for each hidden layer.
2.4. Performance metrics
There is no fixed metric to measure how well a machine learning algorithm performs in solving different types of problems and when deciding which metric to take, factors like the class distribution of the dataset and what particular case of the problem is being focused on all need to be taken into consideration.
As previously discovered, the dataset being used in the research is extremely imbalanced because fraudulent transactions only take up a small portion of all transactions in real-life situations. In this case, accuracy is not the best metric to measure the performance because even if the algorithms predicted all transactions as non-fraudulent transactions, the accuracy would still be over 99%, which is very misleading and does not show the true performance of the algorithms.
It is desired to catch as many fraudulent transactions as possible and try to minimize the number of false categorizations at the same time. Therefore, recall should be the first priority and precision should be the second priority of how the performance of the algorithms is evaluated.
3. Result
The training and test sets cover 80% and 20% of the entire dataset respectively. Thus, there are 227845 and 56962 records in the training and test datasets. The number of legit and fraudulent transactions is 227457 and 388 in the training data, and 56858 and 104 in the testing data.
For the base case, the algorithms were trained with the original training dataset because it gives a baseline to compare the results after the training data was undersampled and oversampled. The results in Figure 3 show the performance of the algorithms on the test dataset.
As Table 1 has shown, the Gaussian Naive Bayes has the lowest precision of 7% for fraudulent transactions among all five machine learning algorithms, but it has the highest recall of 83%. Overall, random forest performed the best because it has 99% precision for fraudulent transactions, which is the greatest in comparison to the other algorithms, and 81% for recall, which is only 2% less than the Gaussian Naive Bayes
Figure 3. Confusion matrix results on original training dataset. |
Table 1. Comparison between the performance of different machine learning algorithms without the use of undersampling and oversampling.
Non-fraud | Fraud | |||||
Precision | Recall | F1-score | Precision | Recall | F1-score | |
Gaussian Naive Bayes | 1.00 | 0.98 | 0.99 | 0.07 | 0.83 | 0.12 |
Logistic Regression | 1.00 | 1.00 | 1.00 | 0.87 | 0.60 | 0.71 |
SVM | 1.00 | 1.00 | 1.00 | 0.96 | 0.70 | 0.81 |
Random Forest | 1.00 | 1.00 | 1.00 | 0.99 | 0.81 | 0.89 |
Neural Network | 1.00 | 1.00 | 1.00 | 0.90 | 0.76 | 0.82 |
Table 2 and Figure 4 demonstrate how well the machine learning algorithms work after random undersampling was acted on the training set. The precisions of all the algorithms for fraudulent transactions are less or equal to 10%, which is extremely low and has decreased dramatically compared to the results from the base case. The recall for fraudulent transactions has increased for all the algorithms, especially for the logistic regression, SVM, and sequential neural network algorithms. The logistic regression, SVM, and sequential neural networks have increased by 34%, 18%, and 14% in precision.
Figure 4. Confusion matrix results on undersampling dataset. |
Table 2. Comparison between the performance of different algorithms with undersampling applied.
Non-fraud | Fraud | |||||
Precision | Recall | F1-score | Precision | Recall | F1-score | |
Gaussian Naive Bayes | 1.00 | 0.98 | 0.99 | 0.06 | 0.87 | 0.12 |
Logistic Regression | 1.00 | 0.95 | 0.98 | 0.04 | 0.94 | 0.07 |
SVM | 1.00 | 0.98 | 0.99 | 0.10 | 0.88 | 0.18 |
Random Forest | 1.00 | 0.97 | 0.98 | 0.05 | 0.90 | 0.10 |
Neural Network | 1.00 | 0.94 | 0.97 | 0.03 | 0.90 | 0.05 |
After oversampling was applied to the training dataset, the Gaussian Naive Bayes, Logistic Regression, and SVM algorithms performed very similarly to when undersampling was applied where precision is extremely low and some improvements in the recall compared to the base case. Results are shown in Table 3 and Figure 5. The random forest’s recall for fraudulent transactions improved by 3% but the precision decreased by 8%, and the sequential neural network increased by 7% in recall and decreased by 5% in precision. Smote oversampling increased the overall performance of Random Forest and Neural Network if it is considered that the recall was improved without a huge decrease in the precision.
Figure 5. Confusion matrix results on oversampling dataset. |
Table 3. Comparison between the performance of different algorithms with oversampling applied.
Non-fraud | Fraud | |||||
Precision | Recall | F1-score | Precision | Recall | F1-score | |
Gaussian Naive Bayes | 1.00 | 0.98 | 0.99 | 0.06 | 0.87 | 0.12 |
Logistic Regression | 1.00 | 0.95 | 0.98 | 0.04 | 0.94 | 0.07 |
SVM | 1.00 | 0.98 | 0.99 | 0.10 | 0.88 | 0.18 |
Random Forest | 1.00 | 0.97 | 0.98 | 0.05 | 0.90 | 0.10 |
Neural Network | 1.00 | 0.94 | 0.97 | 0.03 | 0.90 | 0.05 |
4. Discussion
The Random Forest algorithm performs the best compared to all other algorithms tested in the research and the results are considered to be excellent in the case of the dataset that was applied where most of the values in the dataset are anonymous. Undoubtedly there are plenty of more methods that can make an improvement in the performance of the Random Forest algorithm further. For example, increasing the number of trees but the downside of that is it makes the training and predicting process of the algorithm slower, so it is critical to find a balance between speed and performance based on what problem is being tackled. Also, the performance may be enhanced by altering the value of the largest number of features to be taken into account for each node split in the tree, and it is necessary to understand the degree of the correlation between the features in the dataset in order to find the most optimal value.
5. Conclusion
The research applied a dataset obtained from Kaggle, which contains credit card transactions made by European credit card holders, and used recall and precision as the priority metrics to analyze and compare the performance of the machine learning algorithms including Gaussian Naive Bayes, Logistic Regression, SVM, Random Forest, and Sequential Neural Network. In addition, the research evaluated the effect of random undersampling and smote oversampling on the performance of the algorithms. For the base case, Random Forest performed the best with 99% in precision and 81% in recall. After random undersampling was applied to the training dataset, there was an improvement in the recall for all the algorithms, but the precisions became extremely low, which make the models unusable in real life. After smote oversampling was applied, Random Forest once again had the best overall performance with 91% in precision and 84% in recall. In conclusion, Random Forest is the best algorithm for credit card fraud detection because it had the highest recall while keeping the precision over 90% at the same time. Random undersampling did not help the algorithms to perform better because it sacrificed the performance in precision hugely to gain some improvements in recall. The Neural Network and Random Forest algorithms performed better as a result of smote oversampling.
This research is helpful for people who are new to machine learning and trying to apply machine learning to detect credit fraud because the research introduced many different algorithms and compared their performance as well as what metric should be utilized to measure the performance in the case of credit card fraud detection. In addition, techniques like random undersampling and smote oversampling were introduced and applied in the research, which helps the readers to understand how the techniques work, when to use them, and how they affect the performance of the algorithms. The research is also a good reference and learning material for people who are interested in solving classification problems like email spam, text spam, cancer detection, etc.
There are many things that the research could be improved and be explored more. One thing is the dataset used in the research because there was information loss during the PCA transformation and many of the values in the dataset are anonymous due to confidential issues. If there is a way to obtain a dataset that provides more background information about the data, it will create more ways and opportunities to optimize the performance of the algorithms. Also, there are many more algorithms that have not been tested in the research and that’s something that could definitely be explored more in future work
References
[1]. Delamaire, L., Abdou, H., & Pointon, J. (2009). Credit card fraud and detection techniques: a review. Banks and Bank systems, 4(2), 57-68.
[2]. Bhattacharyya, S., Jha, S., Tharakunnel, K., & Westland, J. C. (2011). Data mining for credit card fraud: A comparative study. Decision support systems, 50(3), 602-613.
[3]. Machine Learning Group ULB (2017) Credit Card Fraud Detection, RUL: https://www.kaggle.com/datasets/mlg-ulb/creditcardfraud
[4]. Koza, J. R., Bennett, F. H., Andre, D., & Keane, M. A. (1996). Automated design of both the topology and sizing of analog electrical circuits using genetic programming. In Artificial intelligence in design’96, 151-170.
[5]. Mohammed, R., Rawashdeh, J., & Abdullah, M. (2020). Machine learning with oversampling and undersampling techniques: overview study and experimental results. In 2020 11th international conference on information and communication systems, 243-248.
[6]. Thabtah, F., Hammoud, S., Kamalov, F., & Gonsalves, A. (2020). Data imbalance in classification: Experimental evaluation. Information Sciences, 513, 429-441.
[7]. Japkowicz, N., & Stephen, S. (2002). The class imbalance problem: A systematic study. Intelligent data analysis, 6(5), 429-449.
[8]. Jahromi, A. H., & Taheri, M. (2017). A non-parametric mixture of Gaussian naive Bayes classifiers based on local independent features. In 2017 Artificial intelligence and signal processing conference, 209-212.
[9]. Webb, G. I., Keogh, E., & Miikkulainen, R. (2010). Naïve Bayes. Encyclopedia of machine learning, 15, 713-714.
[10]. LaValley, M. P. (2008). Logistic regression. Circulation, 117(18), 2395-2399.
[11]. DeMaris, A. (1995). A tutorial in logistic regression. Journal of Marriage and the Family, 956-968.
Cite this article
Chen,Z. (2023). Performance comparison of machine learning algorithms for credit card fraud detection. Applied and Computational Engineering,6,599-607.
Data availability
The datasets used and/or analyzed during the current study will be available from the authors upon reasonable request.
Disclaimer/Publisher's Note
The statements, opinions and data contained in all publications are solely those of the individual author(s) and contributor(s) and not of EWA Publishing and/or the editor(s). EWA Publishing and/or the editor(s) disclaim responsibility for any injury to people or property resulting from any ideas, methods, instructions or products referred to in the content.
About volume
Volume title: Proceedings of the 3rd International Conference on Signal Processing and Machine Learning
© 2024 by the author(s). Licensee EWA Publishing, Oxford, UK. This article is an open access article distributed under the terms and
conditions of the Creative Commons Attribution (CC BY) license. Authors who
publish this series agree to the following terms:
1. Authors retain copyright and grant the series right of first publication with the work simultaneously licensed under a Creative Commons
Attribution License that allows others to share the work with an acknowledgment of the work's authorship and initial publication in this
series.
2. Authors are able to enter into separate, additional contractual arrangements for the non-exclusive distribution of the series's published
version of the work (e.g., post it to an institutional repository or publish it in a book), with an acknowledgment of its initial
publication in this series.
3. Authors are permitted and encouraged to post their work online (e.g., in institutional repositories or on their website) prior to and
during the submission process, as it can lead to productive exchanges, as well as earlier and greater citation of published work (See
Open access policy for details).
References
[1]. Delamaire, L., Abdou, H., & Pointon, J. (2009). Credit card fraud and detection techniques: a review. Banks and Bank systems, 4(2), 57-68.
[2]. Bhattacharyya, S., Jha, S., Tharakunnel, K., & Westland, J. C. (2011). Data mining for credit card fraud: A comparative study. Decision support systems, 50(3), 602-613.
[3]. Machine Learning Group ULB (2017) Credit Card Fraud Detection, RUL: https://www.kaggle.com/datasets/mlg-ulb/creditcardfraud
[4]. Koza, J. R., Bennett, F. H., Andre, D., & Keane, M. A. (1996). Automated design of both the topology and sizing of analog electrical circuits using genetic programming. In Artificial intelligence in design’96, 151-170.
[5]. Mohammed, R., Rawashdeh, J., & Abdullah, M. (2020). Machine learning with oversampling and undersampling techniques: overview study and experimental results. In 2020 11th international conference on information and communication systems, 243-248.
[6]. Thabtah, F., Hammoud, S., Kamalov, F., & Gonsalves, A. (2020). Data imbalance in classification: Experimental evaluation. Information Sciences, 513, 429-441.
[7]. Japkowicz, N., & Stephen, S. (2002). The class imbalance problem: A systematic study. Intelligent data analysis, 6(5), 429-449.
[8]. Jahromi, A. H., & Taheri, M. (2017). A non-parametric mixture of Gaussian naive Bayes classifiers based on local independent features. In 2017 Artificial intelligence and signal processing conference, 209-212.
[9]. Webb, G. I., Keogh, E., & Miikkulainen, R. (2010). Naïve Bayes. Encyclopedia of machine learning, 15, 713-714.
[10]. LaValley, M. P. (2008). Logistic regression. Circulation, 117(18), 2395-2399.
[11]. DeMaris, A. (1995). A tutorial in logistic regression. Journal of Marriage and the Family, 956-968.