


1. Introduction
Breast cancer, as the most prevalent malignant tumor among women worldwide, significantly threatens women's health and lives [1]. A thorough understanding of the molecular characteristics of breast cancer is essential for achieving early diagnosis, precision treatment, and accurate prognostic evaluation. Among the various pathological types of breast cancer, invasive ductal carcinoma (IDC), ductal carcinoma in situ (DCIS), and lobular carcinoma in situ (LCIS) are common types, exhibiting notable differences in clinical manifestations, disease progression, and prognosis [2].
IDC, the most common invasive subtype of breast cancer, is characterized by cancer cells breaching the basement membrane and invading surrounding normal tissues, demonstrating aggressive invasiveness and metastatic potential, resulting in relatively poor clinical prognosis. Conversely, DCIS is a non-invasive breast cancer type in which cancer cells are confined within the ductal structures without penetration of the basement membrane. It is generally regarded as an early stage of breast cancer, and timely detection and treatment typically result in a favorable prognosis. LCIS, similarly, is a non-invasive lesion with cancer cells limited to the lobules. Although LCIS does not inevitably progress to invasive cancer, it is clinically considered a precancerous marker with a certain association to the subsequent development of invasive breast cancer. Despite clear pathological differences among IDC, DCIS, and LCIS, their distinctions at the molecular level remain incompletely understood.
Therefore, identifying molecular markers capable of accurately distinguishing IDC, DCIS, and LCIS holds significant clinical value. On one hand, it could facilitate more precise early diagnosis of breast cancer, particularly in cases where imaging examinations are inconclusive or pathological morphology is ambiguous. Detecting specific molecular markers can improve diagnostic accuracy, enabling timely treatment initiation. On the other hand, molecular marker differentiation can provide a theoretical basis for individualized breast cancer treatment, allowing more targeted therapeutic strategies tailored to specific breast cancer subtypes, thus improving treatment efficacy and reducing recurrence risk. Additionally, these molecular markers may serve as potential prognostic indicators, assisting clinicians in more accurately predicting disease progression and patient survival outcomes, ultimately optimizing clinical management strategies.
In recent years, the rapid advancement of spatial transcriptomics (ST) technology has offered a novel perspective and powerful tools for identifying breast cancer molecular markers [3]. Spatial transcriptomics, an emerging high-throughput technique, can simultaneously capture gene expression information and spatial location from tissue sections, enabling comprehensive gene expression analyses of cells and their microenvironments within complex tissue samples. Unlike traditional transcriptomic analyses, spatial transcriptomics not only reveals gene expression profiles across different cell types and tissue regions but also deeply investigates how spatial structure influences gene expression patterns. This is invaluable for understanding the interactions between tumor cells and their surrounding microenvironment and elucidating the mechanisms underlying tumor initiation, progression, and metastasis.
In this study, breast cancer spatial transcriptomics data combined with manual annotation and machine learning methods were employed to identify molecular markers that can effectively distinguish IDC from DCIS/LCIS.
2. Spatial Transcriptomics
In the study of the molecular mechanisms of breast cancer, differences in gene expression patterns provide crucial biomarkers for tumor initiation, progression, and treatment. Traditional gene expression analysis methods although capable of delivering abundant gene expression data, often struggle to capture the complex relationships between different cells within the tumor microenvironment due to their limited spatial resolution and cellular heterogeneity. Spatial transcriptomics technology offers a groundbreaking solution to this problem by enabling the acquisition of single-cell gene expression information at the tissue section level, thus facilitating an in-depth investigation of the interactions among various cell types within tumor tissues and the origins of tumor heterogeneity.
Image-based spatial transcriptomics technologies primarily rely on fluorescence in situ hybridization principles, detecting spatial expression patterns of specific genes through high-precision microscopic imaging. MERFISH [4] and seqFISH [5] are representative techniques within this category. MERFISH employs barcode-encoding strategies, enabling the detection of thousands of genes at the single-cell level with high spatial resolution, making it particularly suitable for analyzing cellular types and spatial interactions within complex tissues. seqFISH, meanwhile, enhances gene detection throughput significantly through multiple rounds of hybridization and imaging, allowing repeated examinations of individual cells. Although imaging-based approaches benefit from high spatial resolution and low background noise, their application is often limited to targeted gene studies or small-scale spatial transcriptomics analyses due to issues like photobleaching, complex probe design, and limitations in the number of detectable genes.
In contrast, sequencing-based spatial transcriptomics utilizes spatial barcode strategies to integrate spatial information from tissue sections with high-throughput sequencing, achieving spatial resolution at the whole-transcriptome level. Slide-seq and 10X Visium are widely applied examples of this method. Slide-seq constructs a spatial array using DNA barcode microbeads approximately 10μm in diameter, transferring RNA information via tissue slices, thereby preserving spatial information for subsequent sequencing analysis. This method provides relatively high spatial resolution and is suited for large-scale tissue sample research. The 10X Visium technique employs slides pre-coated with barcode probes, simultaneously capturing the expression of thousands of genes, and can be integrated with immunohistochemistry techniques to further enhance histological context information. Despite the advantages of high throughput and comprehensive transcriptome coverage, sequencing-based methods still face limitations such as higher sequencing costs and relatively lower spatial resolution.
3. Dataset
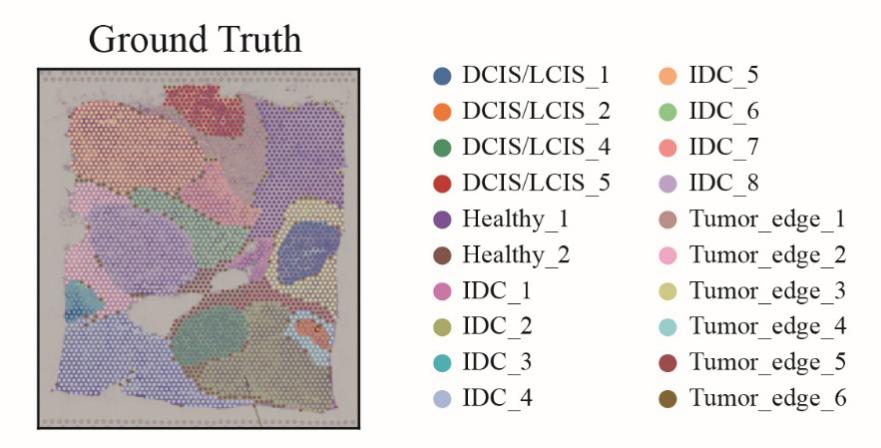
Figure 1: The illustration of spatial transcriptomics data for breast cancer.
This study utilized breast cancer spatial transcriptomics data to perform gene expression analysis, aiming to identify molecular differences between IDC and DCIS/LCIS. The dataset originated from a breast cancer research project conducted in 2018, involving 600 female patients aged 25 to 75 years. Initially, the dataset contained 1,100 breast ultrasound images, which after preprocessing resulted in 780 images categorized into normal, benign, and malignant types, with malignant images further classified into IDC and DCIS/LCIS. For our analysis, we selected one high-quality tissue slice containing gene expression information from 3,798 cells and 36,601 genes [6]. This dataset is available at https://support.10xgenomics.com/spatial-gene-expression/datasets/1.1.0/V1_Breast_Cancer_Block_A_Section_1.
Figure 1 illustrates various regions of the breast cancer tissue slice, with distinct colors differentiating IDC, DCIS/LCIS, healthy tissue, and tumor edges. The figure clearly demonstrates distinct spatial distribution patterns for IDC and DCIS/LCIS within the tissue slice. IDC regions display heterogeneous and invasive characteristics, represented by dispersed color patterns (IDC_1 through IDC_8), whereas DCIS/LCIS regions appear more concentrated and localized, primarily indicated by DCIS/LCIS_1, DCIS/LCIS_2, etc. Healthy tissues (Healthy_1 and Healthy_2) exhibit clear boundaries separating them from tumor regions, while tumor edges (Tumor_edge_1 through Tumor_edge_6) represent transitional spatial characteristics positioned between healthy and tumor tissues.
The spatial interactions among different cell types reflect the complexity of breast cancer tissues. IDC cells may interact with adjacent healthy tissues and tumor edge cells, which could influence the invasive and metastatic processes of IDC. Conversely, although DCIS/LCIS cells appear relatively confined, the presence of tumor edge cells around these regions suggests potential pathways for their progression to invasive cancer under specific conditions. This visual representation provides intuitive insights into the spatial distribution and interactions among different breast cancer cell types, offering critical spatial context for subsequent molecular marker identification and the construction of classification models based on spatial transcriptomics data.
4. Analysis
Following data preprocessing, molecular differences between IDC and DCIS/LCIS were identified through gene expression analysis. Using the DEsingle [7], significant differentially expressed genes (DEGs) were screened based on statistical significance (p-value threshold of 0.05). These DEGs are not only statistically relevant but may also play critical roles in the molecular mechanisms differentiating IDC from DCIS/LCIS, providing important candidates for subsequent feature selection and classification modeling.
To classify IDC and DCIS/LCIS accurately, several machine learning algorithms, including random forest, decision tree, support vector machine (SVM), and logistic regression, were employed. The random forest algorithm, an ensemble learning method based on decision trees, achieves high classification accuracy and reduces overfitting through majority voting among numerous trees. The decision tree model, on the other hand, offers interpretability but can be prone to overfitting. Support vector machines (SVMs) are effective for classifying high-dimensional data and are particularly advantageous in small sample scenarios, though they are computationally intensive and sensitive to hyperparameter tuning. Logistic regression, a widely used linear classification model, provides simplicity in implementation but may perform less effectively with complex nonlinear data.
For the analysis, the identified DEGs served as candidate features. The dataset was partitioned into training (for sufficient model training) and validation sets to evaluate generalization ability, ensuring reliable classification performance. The random forest method, which consistently demonstrated superior performance in multiple tests, was selected as the benchmark model. Further optimization of the feature set was conducted using recursive feature elimination (RFE). Subsequently, decision tree, SVM, and logistic regression models were trained and evaluated using the optimized set of features to ensure robustness and comparative assessment. This comprehensive analytical strategy provided crucial insights into molecular distinctions among IDC, DCIS, and LCIS, enhancing classification accuracy and facilitating the selection of clinically relevant molecular markers.
5. Results
We first performed functional enrichment analysis on the differentially expressed genes (DEGs) to explore the molecular distinctions between IDC and DCIS/LCIS.
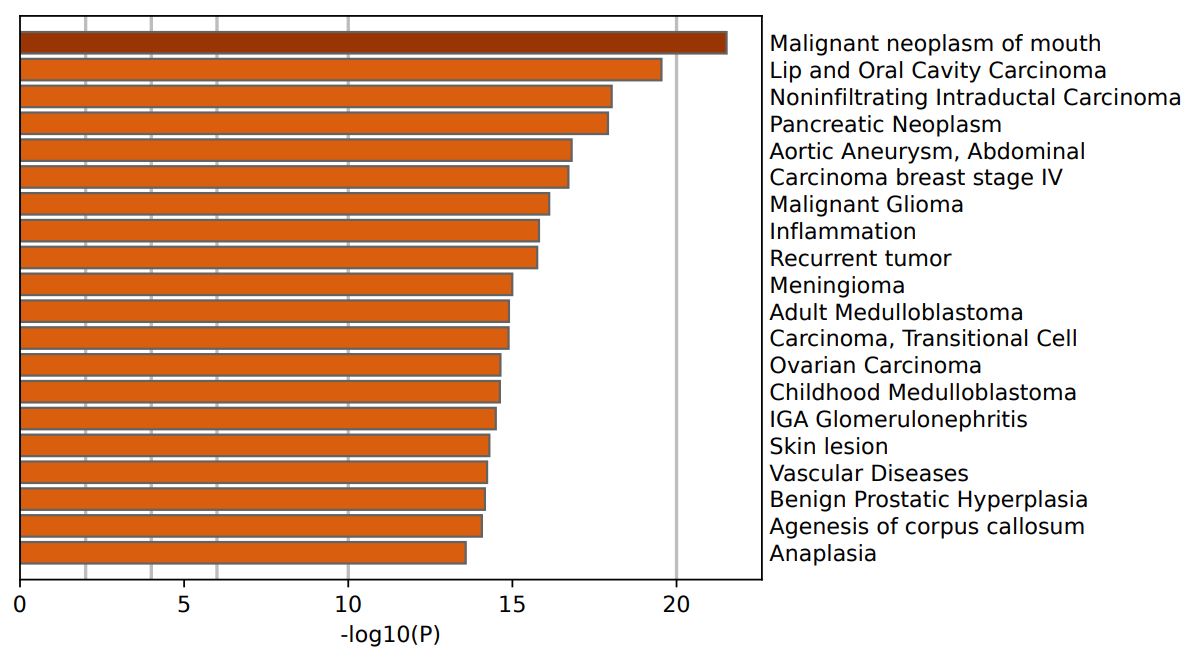
Figure 2: The result of GO analysis based on DisGeNET.
Initially, disease association analysis was conducted using the DisGeNET database [8]. The results revealed significant enrichment of DEGs in various disease-related pathways, notably including oral malignant tumors, lip and oral cancer, non-invasive ductal carcinoma (IDC), pancreatic tumors, abdominal aortic aneurysms, stage IV breast cancer, and malignant glioma. Notably, the enrichment of non-invasive ductal carcinoma (IDC) ranked prominently, underscoring a close association between identified DEGs and IDC, thus reinforcing the focal direction of our research. Although enrichment related to other malignancies, such as oral and pancreatic tumors, appeared in the analysis, their relevance was relatively lower, and the related genes did not exhibit significant differential expression between IDC and DCIS. This observation suggests that while certain biological processes may be common across cancers, these gene features are not predominant in the context of our study, further emphasizing the specificity and representativeness of our selected genes in IDC and DCIS.
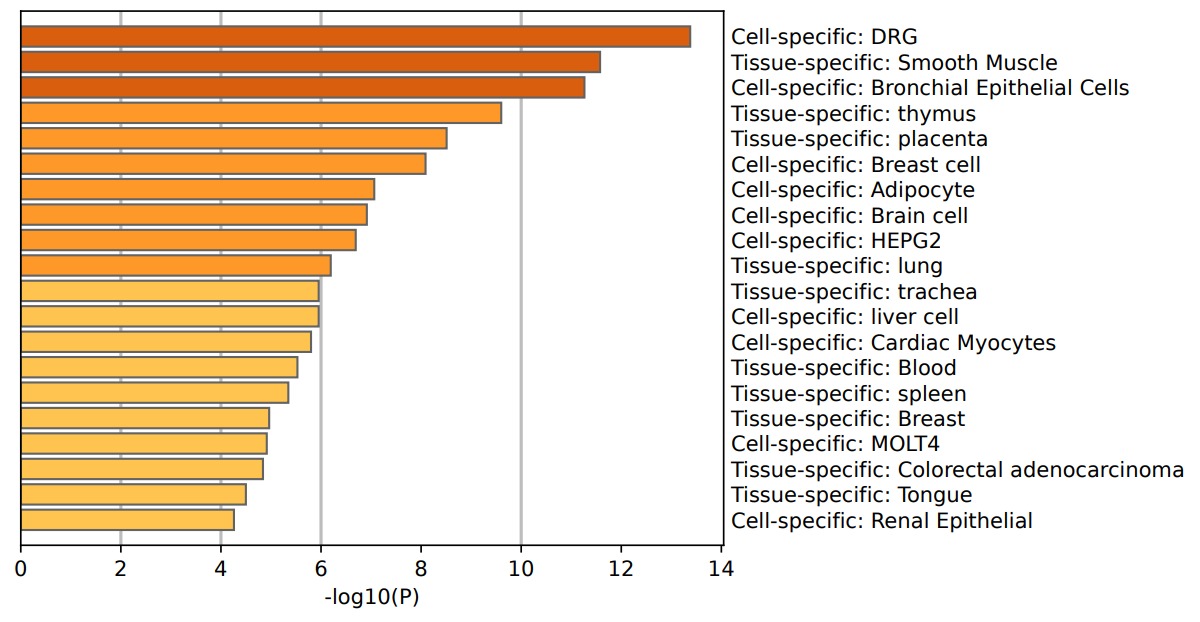
Figure 3: The result of GO analysis based on PaGenBase.
Subsequently, cell and tissue-specific enrichment analysis was performed using the PaGenBase database [9] to investigate the preferential expression of DEGs across various cell types and tissues. Results indicated significant enrichment in breast cells, adipocytes, bronchial epithelial cells, dorsal root ganglion cells (DRG), brain cells, and HEPG2 cells. The pronounced enrichment of breast cell-related genes confirmed their critical role in the IDC and DCIS/LCIS microenvironment. Regarding tissue specificity, DEGs primarily enriched in smooth muscle, thymus, placenta, and lung tissues, indicating some cross-tissue expression patterns but still predominantly centered around breast tissue. These findings collectively demonstrated strong breast cancer relevance and specific cell and tissue expression, thus providing theoretical support for identifying molecular markers distinguishing IDC from DCIS/LCIS.
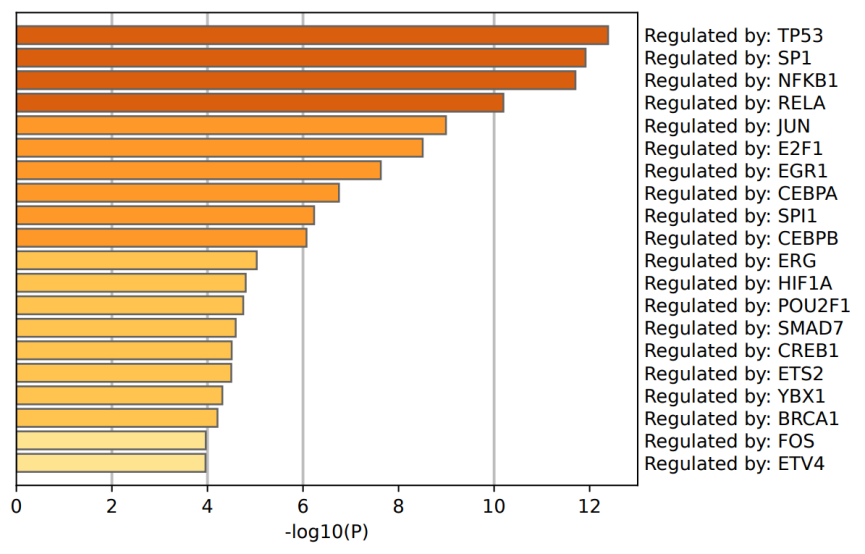
Figure 4: The result of GO analysis based on TRRUST.
Further, transcription factor regulatory network analysis using the TRRUST database [10] identified upstream transcriptional regulators of DEGs, predominantly involving TP53, SP1, and NFKB1. TP53, a classical tumor suppressor, showed extensive regulatory influence, with significant expression differences of its downstream target genes between IDC and DCIS, highlighting its pivotal role in breast cancer initiation and progression. SP1 and NFKB1, important transcription factors involved in cell cycle regulation and immune response, respectively, also emerged prominently. Additionally, transcription factors like RELA, JUN, and E2F1 were implicated, revealing potential molecular distinctions in cell cycle progression, migration, and invasion capabilities between IDC and DCIS. Overall, these transcription factors, along with their regulated targets, formed a differential transcriptional regulatory network, revealing intrinsic molecular heterogeneity between the two breast cancer subtypes.
Random Forest classification was further employed to distinguish IDC from DCIS samples, achieving high accuracy (95.78%) and robust performance across training and validation datasets. For comparative assessment and validation, Decision Tree, Support Vector Machine (SVM), and Logistic Regression models were also applied. The Decision Tree model demonstrated a test accuracy of 93.57%, with intuitive interpretability but susceptibility to overfitting. SVM exhibited an accuracy of 94.99%, performing effectively on high-dimensional data but showing sensitivity to outliers, affecting generalizability. Logistic Regression had the lowest accuracy (89.67%), reflecting limitations in handling complex nonlinear relationships inherent in IDC and DCIS expression patterns. Therefore, Random Forest was selected as the optimal model for classification between IDC and DCIS. To enhance model simplicity and interpretability, the ten most representative genes were identified from the top 100 high-importance features as potential biomarkers: MGP, ALB, S100G, KRT37, SERPINA3, AC087379.2, ZNF350-AS1, IGHG3, IGHG4, and IGKC. Further biological interpretation was performed for MGP, ALB, S100G, AC087379.2, and ZNF350-AS1. MGP (Matrix Gla Protein), highly expressed in breast cancer, is implicated in extracellular matrix remodeling, facilitating cancer cell migration and invasion. ALB (Albumin), abundant in plasma, has expression levels closely correlated with tumor prognosis, with lower expression reflecting high malignancy and metastatic potential. S100G (S100 Calcium Binding Protein G), an S100 family member, exhibits high expression in breast cancer cells, regulating proliferation and migration. AC087379.2, though less studied, shows upregulation in multiple cancers, possibly involved in tumor progression via cell cycle regulation pathways. ZNF350-AS1, a long non-coding RNA, exhibits high expression across various tumors, potentially influencing invasion and metastasis through transcriptional regulation of tumor suppressors, garnering increasing attention in breast cancer research. These critical genes demonstrate substantial discriminative capability between IDC and DCIS and likely play central roles in breast cancer pathogenesis, presenting promising clinical translation potential.
6. Discussion and Conclusion
This study employed spatial transcriptomics technology to perform an in-depth analysis of gene expression differences between IDC and DCIS, successfully identifying a series of potential molecular biomarkers distinguishing these breast cancer subtypes. Through differential gene expression analysis, combined with machine learning methods, we effectively screened candidate molecular markers significantly correlated with IDC and DCIS, developing a reliable molecular foundation for classification.
In clinical breast cancer diagnosis, early detection and precise diagnosis are crucial factors in enhancing cure rates and reducing mortality. Although current diagnostic methods primarily include imaging and pathological examinations, certain breast cancer types present challenges, particularly cases with ambiguous imaging results or indistinct pathological features. Detection of specific molecular markers could significantly enhance diagnostic accuracy for these early-stage tumors, thus providing patients with valuable treatment opportunities.
Our findings demonstrate the potential of machine learning algorithms in identifying molecular markers significantly correlated with IDC and DCIS from extensive gene expression datasets. These markers offer unprecedented insights into tumor biology, particularly regarding the dynamic interactions between tumor cells and their microenvironment, thereby providing novel possibilities for early detection. The use of spatial transcriptomics to visualize these interactions at the cellular level surpasses conventional pathology in revealing tumor heterogeneity and interactions within the tumor microenvironment.
Furthermore, the identified molecular markers are not only valuable for early diagnosis but also instrumental in informing personalized therapeutic strategies. The integration of these markers into clinical practice could substantially improve treatment planning by identifying aggressive or metastatic potential, thus facilitating more accurate prognoses and preventing overtreatment or missed diagnoses.
In conclusion, this research not only sheds new light on the molecular distinctions between IDC and DCIS but also presents novel opportunities for the early detection, precise treatment, and prognostic assessment of breast cancer. With continued development and refinement, spatial transcriptomics holds considerable promise for broader applications across various cancer types, greatly enhancing early diagnosis and individualized treatment capabilities.
References
[1]. S. Libson and M. Lippman, “A review of clinical aspects of breast cancer,” International Review of Psychiatry, vol. 26, no. 1, pp. 4–15, Feb. 2014, doi: 10.3109/09540261.2013.852971.
[2]. J. Wang et al., “Progression from ductal carcinoma in situ to invasive breast cancer: molecular features and clinical significance,” Sig Transduct Target Ther, vol. 9, no. 1, pp. 1–28, Apr. 2024, doi: 10.1038/s41392-024-01779-3.
[3]. L. Moses and L. Pachter, “Museum of spatial transcriptomics,” Nat Methods, vol. 19, no. 5, pp. 534–546, May 2022, doi: 10.1038/s41592-022-01409-2.
[4]. P. Androvic et al., “Spatial Transcriptomics-correlated Electron Microscopy maps transcriptional and ultrastructural responses to brain injury,” Nat Commun, vol. 14, no. 1, p. 4115, Jul. 2023, doi: 10.1038/s41467-023-39447-9.
[5]. D. Dar, N. Dar, L. Cai, and D. K. Newman, “Spatial transcriptomics of planktonic and sessile bacterial populations at single-cell resolution,” Science, vol. 373, no. 6556, p. eabi4882, Aug. 2021, doi: 10.1126/science.abi4882.
[6]. X. Sun et al., “SpaGRA: Graph augmentation facilitates domain identification for spatially resolved transcriptomics,” Journal of Genetics and Genomics, Oct. 2024, doi: 10.1016/j.jgg.2024.09.015.
[7]. Z. Miao, K. Deng, X. Wang, and X. Zhang, “DEsingle for detecting three types of differential expression in single-cell RNA-seq data,” Bioinformatics, vol. 34, no. 18, pp. 3223–3224, Sep. 2018, doi: 10.1093/bioinformatics/bty332.
[8]. J. Piñero et al., “DisGeNET: a comprehensive platform integrating information on human disease-associated genes and variants,” Nucleic Acids Research, vol. 45, no. D1, pp. D833–D839, Jan. 2017, doi: 10.1093/nar/gkw943.
[9]. J.-B. Pan et al., “PaGenBase: A Pattern Gene Database for the Global and Dynamic Understanding of Gene Function,” PLOS ONE, vol. 8, no. 12, p. e80747, Dec. 2013, doi: 10.1371/journal.pone.0080747.
[10]. H. Han et al., “TRRUST: a reference database of human transcriptional regulatory interactions,” Sci Rep, vol. 5, no. 1, p. 11432, Jun. 2015, doi: 10.1038/srep11432.
Cite this article
Zhou,J. (2025). Identification of Molecular Markers to Classify IDC and DCIS/LCIS in Breast Cancer Using Spatial Transcriptomics. Applied and Computational Engineering,150,1-8.
Data availability
The datasets used and/or analyzed during the current study will be available from the authors upon reasonable request.
Disclaimer/Publisher's Note
The statements, opinions and data contained in all publications are solely those of the individual author(s) and contributor(s) and not of EWA Publishing and/or the editor(s). EWA Publishing and/or the editor(s) disclaim responsibility for any injury to people or property resulting from any ideas, methods, instructions or products referred to in the content.
About volume
Volume title: Proceedings of the 3rd International Conference on Software Engineering and Machine Learning
© 2024 by the author(s). Licensee EWA Publishing, Oxford, UK. This article is an open access article distributed under the terms and
conditions of the Creative Commons Attribution (CC BY) license. Authors who
publish this series agree to the following terms:
1. Authors retain copyright and grant the series right of first publication with the work simultaneously licensed under a Creative Commons
Attribution License that allows others to share the work with an acknowledgment of the work's authorship and initial publication in this
series.
2. Authors are able to enter into separate, additional contractual arrangements for the non-exclusive distribution of the series's published
version of the work (e.g., post it to an institutional repository or publish it in a book), with an acknowledgment of its initial
publication in this series.
3. Authors are permitted and encouraged to post their work online (e.g., in institutional repositories or on their website) prior to and
during the submission process, as it can lead to productive exchanges, as well as earlier and greater citation of published work (See
Open access policy for details).
References
[1]. S. Libson and M. Lippman, “A review of clinical aspects of breast cancer,” International Review of Psychiatry, vol. 26, no. 1, pp. 4–15, Feb. 2014, doi: 10.3109/09540261.2013.852971.
[2]. J. Wang et al., “Progression from ductal carcinoma in situ to invasive breast cancer: molecular features and clinical significance,” Sig Transduct Target Ther, vol. 9, no. 1, pp. 1–28, Apr. 2024, doi: 10.1038/s41392-024-01779-3.
[3]. L. Moses and L. Pachter, “Museum of spatial transcriptomics,” Nat Methods, vol. 19, no. 5, pp. 534–546, May 2022, doi: 10.1038/s41592-022-01409-2.
[4]. P. Androvic et al., “Spatial Transcriptomics-correlated Electron Microscopy maps transcriptional and ultrastructural responses to brain injury,” Nat Commun, vol. 14, no. 1, p. 4115, Jul. 2023, doi: 10.1038/s41467-023-39447-9.
[5]. D. Dar, N. Dar, L. Cai, and D. K. Newman, “Spatial transcriptomics of planktonic and sessile bacterial populations at single-cell resolution,” Science, vol. 373, no. 6556, p. eabi4882, Aug. 2021, doi: 10.1126/science.abi4882.
[6]. X. Sun et al., “SpaGRA: Graph augmentation facilitates domain identification for spatially resolved transcriptomics,” Journal of Genetics and Genomics, Oct. 2024, doi: 10.1016/j.jgg.2024.09.015.
[7]. Z. Miao, K. Deng, X. Wang, and X. Zhang, “DEsingle for detecting three types of differential expression in single-cell RNA-seq data,” Bioinformatics, vol. 34, no. 18, pp. 3223–3224, Sep. 2018, doi: 10.1093/bioinformatics/bty332.
[8]. J. Piñero et al., “DisGeNET: a comprehensive platform integrating information on human disease-associated genes and variants,” Nucleic Acids Research, vol. 45, no. D1, pp. D833–D839, Jan. 2017, doi: 10.1093/nar/gkw943.
[9]. J.-B. Pan et al., “PaGenBase: A Pattern Gene Database for the Global and Dynamic Understanding of Gene Function,” PLOS ONE, vol. 8, no. 12, p. e80747, Dec. 2013, doi: 10.1371/journal.pone.0080747.
[10]. H. Han et al., “TRRUST: a reference database of human transcriptional regulatory interactions,” Sci Rep, vol. 5, no. 1, p. 11432, Jun. 2015, doi: 10.1038/srep11432.