


1. Introduction
With the over consumption of traditional energy leading to environmental pollution, climate change, and other related issues, the use of clean energy, especially wind energy, has gradually become a global focus. As an important renewable energy source, wind energy is widely used worldwide due to its sustainability and low carbon emissions [1]. However, the volatility and unpredictability of wind energy present significant challenges in power system scheduling and grid stability maintenance, making accurate wind power forecasting a critical issue that needs to be addressed. Although current wind power forecasting methods have achieved some success, they generally face challenges in balancing prediction accuracy and real-time performance. Therefore, improving the accuracy and stability of wind power forecasting has become an urgent research demand [2].
To address this, this paper proposes an improved chaotic-enhanced bidirectional LSTM model for wind power forecasting. By introducing chaotic signals from the Lorenz attractor to enhance the feature representation of the input data and leveraging the temporal modeling capabilities of bidirectional LSTM, the forecasting accuracy of wind power is further improved. Specifically, chaotic signals are concatenated with wind power time-series data and input into the bidirectional LSTM network for modeling, yielding more accurate prediction results. Bidirectional LSTM enhances the modeling ability of time-series data by simultaneously considering both past and future information, while chaotic enhancement captures hidden patterns in the data through the introduction of complex nonlinear systems, improving the model’s generalization ability [3].
This study experimentally compares the new model with popular baseline models in time-series forecasting, demonstrating the superiority of the improved model and providing an efficient, accurate, and promising solution for wind power forecasting. The structure of the paper is as follows: Section 2 reviews related research on bidirectional LSTM and chaotic enhancement in time-series forecasting. Section 3 introduces the principles and methodology of the chaotic-enhanced bidirectional LSTM fusion model. Section 4 presents experimental validation and performance evaluation of the model in wind power forecasting. Finally, Section 5 summarizes the key findings, discusses the limitations of the research, and outlines future research directions.
2. Literature review
In recent years, research on wind power forecasting has involved various methods, including numerical prediction, statistical methods, machine learning techniques, and hybrid models. These approaches have made significant progress in improving prediction accuracy and reducing computational costs, providing important support for wind farm planning and operation. Machine learning, in particular, has demonstrated its strong advantages in handling wind power data, which exhibits high randomness and is significantly influenced by environmental factors [4]. Jinxia Zhang et al. used the Long Short-Term Memory (LSTM) model for wind power forecasting, demonstrating that LSTM outperforms other machine learning models, such as Support Vector Machines (SVM), in terms of accuracy [5]. Xiang Zhao et al. proposed a method combining attention mechanisms with LSTM, achieving high accuracy with an average RMSE of 6.12 and an average MAE of 4.51 [6]. Dai Ge introduced a hybrid CNN-LSTM approach, which showed that this method outperforms the individual LSTM or CNN models in terms of prediction accuracy and stability [7]. These studies indicate that machine learning techniques have broad application prospects in wind power forecasting and can effectively improve the scheduling efficiency of power systems, thereby facilitating the integration of wind power into the energy market.
However, despite the promising outcomes of existing research, some limitations remain. First, many studies have not effectively addressed the complex dynamic features of wind power data, particularly the nonlinear and temporal fluctuations commonly found in such data. Although traditional LSTM models can capture temporal dependencies in time series data, the inherent randomness and volatility of wind power often result in suboptimal forecasting accuracy. Second, existing hybrid models still face challenges, such as high computational complexity and model overfitting, when handling complex nonlinear dynamic systems. This is especially problematic when the dataset is small or when environmental conditions change dramatically, leading to instability and reduced accuracy in predictions.
Héctor Rodríguez Rangel et al. used machine learning methods to predict chaotic meteorological data, improving forecasting accuracy [8]. A. Trevisan et al. combined chaos-enhancement theory with weather forecasting and found that chaos theory tools could enhance atmospheric predictability and state estimation in weather forecasting [9]. Since weather exhibits unpredictability and chaotic fluctuations, applying chaos-enhancement theory to explore time series signals with similar properties has high value. So, to address these issues, this paper proposes a wind power forecasting method based on Bidirectional Long Short-Term Memory networks enhanced by chaos theory.
3. Research Methods
3.1. Data Collection
For wind power forecasting, obtaining a reliable and comprehensive dataset is crucial to training effective models. As shown in Figure 1, the dataset used in this study is sourced from the National Grid, containing wind power data collected every 15 minutes from early 2019 to the end of 2020. These data have been preprocessed, normalized, and missing values have been removed.
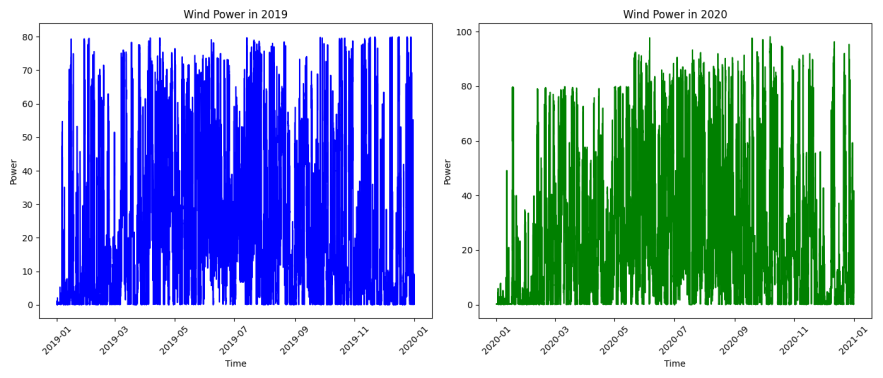
Figure 1: The State Grid Wind Power Dataset (presented separately by year)
3.2. Research Method
3.2.1. Bidirectional LSTM Model
Bidirectional Long Short-Term Memory (Bidirectional LSTM) is an extension of the Long Short-Term Memory (LSTM) network. As shown in Figure 2, it enhances the understanding of context by transmitting information in both directions of the time sequence. LSTM itself is a neural network structure designed to address the gradient vanishing and gradient explosion problems commonly encountered by traditional Recurrent Neural Networks (RNNs) when processing long sequences. Bidirectional LSTM, on the other hand, further strengthens the ability to model sequential data [10].
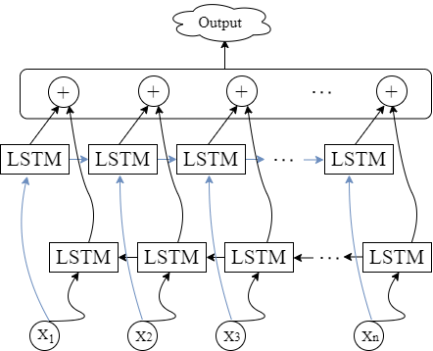
Figure 2: Bidirectional LSTM Structure Diagram
3.2.2. Chaos Enhancement Theory
Chaos signals are typically generated by chaotic systems, with the Lorenz attractor being one of the most commonly used chaotic systems. Lorentz attractor is a typical three-dimensional chaotic system, whose trajectory presents complex spiral motion and self similar structure in phase space, and can simulate multi-scale coupling phenomena in the real world (such as wind power is affected by weather, load and other factors). In contrast, logistic map is a two-dimensional simple chaotic system, which mainly reflects the nonlinear oscillation driven by a single parameter, and it is difficult to describe the multivariable interaction [11]. In this study, we use the Lorenz attractor to generate enhanced signals.
The equations of the Lorenz attractor are as follows:
\( \begin{cases} \begin{array}{c} \frac{dx}{dt}=σ(y-x) \\ \frac{dy}{dt}=x(ρ-z)-y \\ \frac{dz}{dt}=xy-βz \end{array} \end{cases} \) (1)
The constant parameters are: These equations describe a three-dimensional dynamic system, and the trajectory of this system exhibits chaotic behavior under certain conditions.
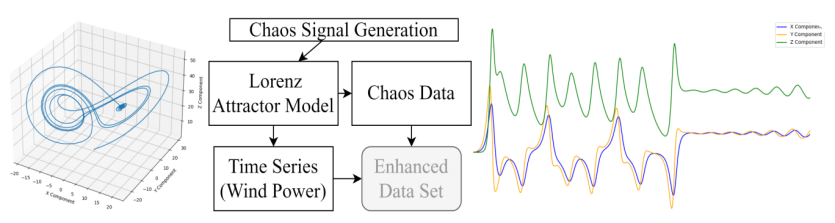
Figure 3: Chaos Data Enhancement Process
It can be seen from Figure 3 that firstly, the chaotic signal is generated by Lorentz attractor, and the chaotic signal is spliced with the time series data of wind power with dynamic fluctuation to form enhanced input data. Suppose that the original wind power data is P(t), where t is each time step in the time series, and the chaotic signal is C(t), which is generated by Lorentz equation.
The data after chaos enhancement can be expressed as:
\( {P_{enhanced}}=αP(t)+βC(t) \) (2)
3.2.3. Research Process
From Figure 4, we can see our research process. To ensure consistency and usability for deep learning models, we divided the dataset into three subsets: training, testing, and validation, with a ratio of 7:2:1, respectively. Given the temporal nature of the data, a 10-step sliding window was employed to capture sequential patterns. Since PyTorch model require input data to include a time step dimension, we reshaped the data from (samples, time steps) to (samples, time steps, features) to comply with the framework's input requirements.
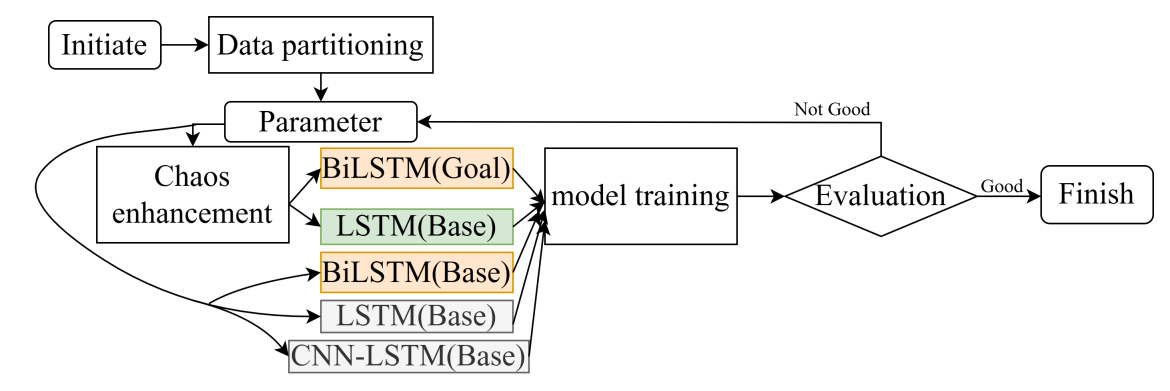
Figure 4: Research Flowchart
After completing the current step, we proceed with parameter initialization, including the division of the step size, etc. In the chaos enhancement process, a chaotic sequence is generated based on the given time step and initial conditions. For each time step input, we slice the pre-generated chaotic sequence and expand it to match the shape of the time series input data. Subsequently, the chaotic data is concatenated with the original data.
\( {x_{chaos\_enhanced}}=[x,chaos\_data] \)
In this way, the input to the LSTM is not only the time series data but also the chaotic sequence from the Lorenz attractor. The chaotic data provides additional sources of information by adding extra features.
During each epoch, the loss of both the training and validation sets is computed and recorded. Through backpropagation and the gradient descent optimization algorithm, the model's parameters are continually adjusted, ultimately learning a more accurate prediction capability. The model uses MSE Loss as the loss function and employs the Adam optimizer for training. After training is completed, the model is used to make predictions on the test set data. The predicted results are then inverse normalized to obtain the actual power prediction values. Finally, multiple evaluation metrics are used to assess the model's prediction performance.
3.3. Evaluation Method of Experimental Results
Mean Absolute Error (MAE): The average absolute value of the difference between the predicted value and the actual value.
\( MAE=\frac{1}{n}\sum _{i=1}^{n}|{y_{i}}-{\hat{y}_{i}}| \) (3)
Mean Absolute Percentage Error (MAPE): The metric used to measure the ratio of the prediction error relative to the actual value. This indicator can effectively reflect the model's performance on data of different scales, but it is particularly sensitive to zero values.
\( MAPE=\frac{1}{n}\sum _{i=1}^{n}|\frac{{y_{i}}-{\hat{y}_{i}}}{{y_{i}}}|×100\% \) (4)
Root Mean Squared Error (RMSE): The square root of the Mean Squared Error (MSE), which restores the error to the original data units.
\( RMSE=\sqrt[]{\frac{1}{n}\sum _{i=1}^{n}{({y_{i}}-{\hat{y}_{i}})^{2}}} \) (5)
Coefficient of Determination (R²): A metric that measures the goodness of fit of a model, representing the proportion of the data's variance explained by the model. The closer R² is to 1, the better the model's predictive performance.
\( {R^{2}}=1-\frac{\sum _{i=1}^{n}{({y_{i}}-{\hat{y}_{i}})^{2}}}{\sum _{i=1}^{n}{({y_{i}}-\bar{y})^{2}}} \) (6)
4. Research Methods
Table 1: Experimental Environment.
CPU | 14-Core |
Internal Memory | 32G |
Programming Language | Anaconda Python |
Framework | Pytorch |
Programming Tool | JetBrain PyCharm |
As shown in Table 1, the operating environment we used is a Windows system configured on a home computer. It is worth noting that our model performs better in this general configuration environment, in addition to strong performance and quality advantages. When facing professional fields, using more specialized equipment may make our model perform even better.
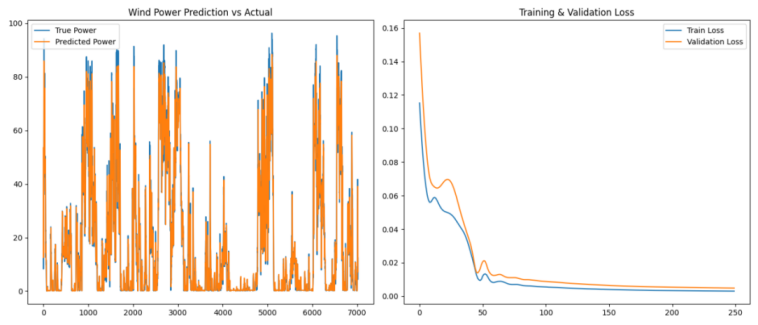
Figure 5: Comparison between predicted and actual values and change in loss values
As can be seen from Figure 5, the model can better track the real data in the 250 training sessions of the model as a whole, especially in large fluctuation areas, where there is a high overlap between the predicted value and the actual value. At the beginning of training, the training loss and verification loss decreased significantly. With the training, the loss curve, especially the verification loss curve, also tended to be stable, indicating that the model was close to the optimal state, and the risk of over fitting was low.
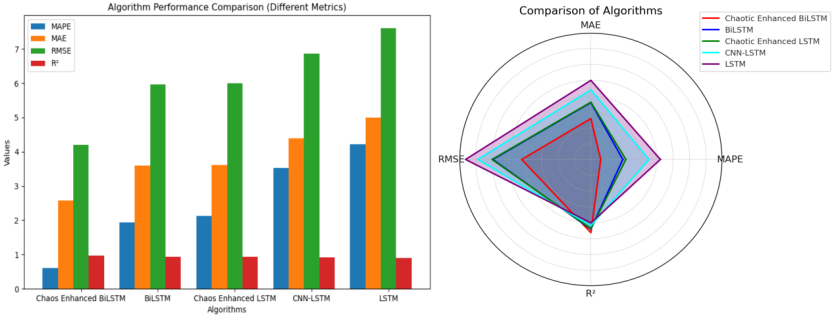
Figure 6: comparison chart of evaluation indexes of each model
As shown in Figure 6, in order to prove the superiority of the model, we kept the other conditions exactly the same. We used Bidirectional LSTM, chaos enhanced LSTM, CNN-LSTM, and LSTM as the benchmark models to carry out multiple experiments and comparisons, and obtained the average data as shown in Table 2.
Table 2: Comparison of average data of each model
MAPE | MAE | RMSE |
| |
Chaos Enhanced Bidirectional LSTM | 0.5979% | 2.5766 | 4.2 | 0.9619 |
Bidirectional LSTM | 1.94% | 3.59 | 5.96 | 0.94 |
Chaos Enhanced LSTM | 2.1255% | 3.6140 | 6.0068 | 0.9367 |
CNN-LSTM | 3.53% | 4.39 | 6.87 | 0.9173 |
LSTM | 4.22% | 4.99 | 7.61 | 0.90 |

It can be seen from the analysis in Table 2 that the butterfly effect of Lorentz system (small disturbance leads to long-term unpredictability) is highly consistent with the random fluctuation characteristics of wind power. The experimental data show that the Chaotic Enhanced Bidirectional LSTM model and the Chaotic Enhanced LSTM model are significantly better than the ordinary Bidirectional LSTM model and the ordinary LSTM model, respectively, indicating that Lorentz chaotic data can effectively improve the robustness of the model to noise. In addition, Chaos Enhanced Bidirectional LSTM is superior to all other models in all indicators, which shows the great value of this study.
5. Conclusion
This study proposes a Chaos-Enhanced Bidirectional LSTM model that enhances the input of Bidirectional LSTM with chaotic sequences, thereby improving the model's ability to predict complex time-series data. By reviewing recent relevant research, the necessity of using the Bidirectional LSTM model and chaos-enhancement theory as a data augmentation tool has been established. The paper provides a detailed explanation of the mechanisms, experiments, and evaluation methods of both. Based on the evaluation results, it is concluded that the chaos-enhanced Bidirectional LSTM achieves optimal performance. The chaos-enhancement mechanism enhances the nonlinear learning capability of the Bidirectional LSTM model, while demonstrating that Lorenz chaotic data can effectively improve the model's robustness to noise.
Although this study demonstrates the good performance of the chaos-enhanced Bidirectional LSTM model, there are still some limitations. Firstly, the chaotic generation method used in the study (e.g., the Lorenz attractor) is relatively simple; future work could explore more complex chaotic systems or combine multiple chaotic mapping methods to further enhance the model's nonlinear modeling capabilities. Secondly, the experimental dataset used in this paper is relatively small, and future research could use larger, more complex datasets to validate the model and ensure its generalization ability. Lastly, despite the model achieving good accuracy, its computational efficiency remains a potential issue, and future research could optimize the model structure, reduce computational costs, and improve real-time prediction capabilities.
Through these improvements, future research can better address the challenges in complex time-series tasks such as wind power forecasting, and further promote the application of the chaos-enhanced Bidirectional LSTM method in other fields, such as financial market forecasting and meteorological data analysis.
References
[1]. Olabi, A.G., et al., Wind Energy Contribution to the Sustainable Development Goals: Case Study on London Array. Sustainability, 2023.
[2]. Hanifi, S.M., et al., A Critical Review of Wind Power Forecasting Methods—Past, Present and Future. Energies, 2020.
[3]. Kiperwasser, E. and Y. Goldberg, Simple and Accurate Dependency Parsing Using Bidirectional LSTM Feature Representations. Transactions of the Association for Computational Linguistics, 2016. 4: p. 313-327.
[4]. Dey, A., Machine Learning Algorithms: A Review. International Journal of Science and Research (IJSR), 2022.
[5]. Zhang, J., et al., Wind Power Generation Prediction Based on LSTM, in Proceedings of the 2019 4th International Conference on Mathematics and Artificial Intelligence. 2019, Association for Computing Machinery: Chegndu, China. p. 85–89.
[6]. Zhao, X., et al., Wind power prediction method based on Attention-LSTM. Journal of Physics: Conference Series, 2024.
[7]. Dai, G., Wind Power Forecasting Based on CNN and LSTM Models. Highlights in Science, Engineering and Technology, 2024.
[8]. Rodríguez, H., et al., Forecasting from incomplete and chaotic wind speed data. Soft Computing, 2018. 23: p. 10119 - 10127.
[9]. Trevisan, A. and L. Palatella, Chaos and Weather Forecasting: the Role of the unstable Subspace in Predictability and State Estimation Problems. Int. J. Bifurc. Chaos, 2011. 21: p. 3389-3415.
[10]. Yu, Y., J. Cao, and J. Zhu, An LSTM Short-Term Solar Irradiance Forecasting Under Complicated Weather Conditions. IEEE Access, 2019. 7: p. 145651-145666.
[11]. Zhang, Y., X. Zhang, and Y. Cheng, An Improved High-Dimensional Logistic Chaotic System and Its Performance. Proceedings of the 2023 6th International Conference on Artificial Intelligence and Pattern Recognition, 2023.
Cite this article
Song,Y. (2025). Wind Power Forecasting Based on Bidirectional LSTM Integrated with Chaos Enhancement Theory. Applied and Computational Engineering,153,75-82.
Data availability
The datasets used and/or analyzed during the current study will be available from the authors upon reasonable request.
Disclaimer/Publisher's Note
The statements, opinions and data contained in all publications are solely those of the individual author(s) and contributor(s) and not of EWA Publishing and/or the editor(s). EWA Publishing and/or the editor(s) disclaim responsibility for any injury to people or property resulting from any ideas, methods, instructions or products referred to in the content.
About volume
Volume title: Proceedings of the 3rd International Conference on Mechatronics and Smart Systems
© 2024 by the author(s). Licensee EWA Publishing, Oxford, UK. This article is an open access article distributed under the terms and
conditions of the Creative Commons Attribution (CC BY) license. Authors who
publish this series agree to the following terms:
1. Authors retain copyright and grant the series right of first publication with the work simultaneously licensed under a Creative Commons
Attribution License that allows others to share the work with an acknowledgment of the work's authorship and initial publication in this
series.
2. Authors are able to enter into separate, additional contractual arrangements for the non-exclusive distribution of the series's published
version of the work (e.g., post it to an institutional repository or publish it in a book), with an acknowledgment of its initial
publication in this series.
3. Authors are permitted and encouraged to post their work online (e.g., in institutional repositories or on their website) prior to and
during the submission process, as it can lead to productive exchanges, as well as earlier and greater citation of published work (See
Open access policy for details).
References
[1]. Olabi, A.G., et al., Wind Energy Contribution to the Sustainable Development Goals: Case Study on London Array. Sustainability, 2023.
[2]. Hanifi, S.M., et al., A Critical Review of Wind Power Forecasting Methods—Past, Present and Future. Energies, 2020.
[3]. Kiperwasser, E. and Y. Goldberg, Simple and Accurate Dependency Parsing Using Bidirectional LSTM Feature Representations. Transactions of the Association for Computational Linguistics, 2016. 4: p. 313-327.
[4]. Dey, A., Machine Learning Algorithms: A Review. International Journal of Science and Research (IJSR), 2022.
[5]. Zhang, J., et al., Wind Power Generation Prediction Based on LSTM, in Proceedings of the 2019 4th International Conference on Mathematics and Artificial Intelligence. 2019, Association for Computing Machinery: Chegndu, China. p. 85–89.
[6]. Zhao, X., et al., Wind power prediction method based on Attention-LSTM. Journal of Physics: Conference Series, 2024.
[7]. Dai, G., Wind Power Forecasting Based on CNN and LSTM Models. Highlights in Science, Engineering and Technology, 2024.
[8]. Rodríguez, H., et al., Forecasting from incomplete and chaotic wind speed data. Soft Computing, 2018. 23: p. 10119 - 10127.
[9]. Trevisan, A. and L. Palatella, Chaos and Weather Forecasting: the Role of the unstable Subspace in Predictability and State Estimation Problems. Int. J. Bifurc. Chaos, 2011. 21: p. 3389-3415.
[10]. Yu, Y., J. Cao, and J. Zhu, An LSTM Short-Term Solar Irradiance Forecasting Under Complicated Weather Conditions. IEEE Access, 2019. 7: p. 145651-145666.
[11]. Zhang, Y., X. Zhang, and Y. Cheng, An Improved High-Dimensional Logistic Chaotic System and Its Performance. Proceedings of the 2023 6th International Conference on Artificial Intelligence and Pattern Recognition, 2023.