


1. Introduction
Examining how the ankle moves in three dimensions helps doctors and surgeons develop better treatment and surgery plans. New MRI technology with high detail produces accurate images of joint tissue movement and internal structures according to Blemker et al. [1]. Medical experts now use computer vision technology mainly semantic segmentation and object detection to improve medical image analysis. The object detection method identifies particular anatomical features in MRI data in a manner analogous to semantic segmentation. The model can identify certain anatomical structures in MRI scans; however it differs from segmentation, which categorises each pixel in the picture. This technique enables specialists to assess alterations in bone positioning and joint articulations during dynamic motions such as ankle flexion, extension, and inversion. Recent methods such as Faster R-CNN and You Only Look Once (YOLO) have been adapted for real-time operation to accurately identify items in medical images with precise spatial fidelity [2]. High-resolution MRI images show fine details of ankle joint anatomy better than other imaging methods so researchers use it for their study [3]. The use of transformer-based systems and self-supervised studies makes medical image detection and segmentation progress faster according to Chen et al. [4]. The techniques excel in handling small datasets which frequently affect medical image research.
• Traditional methods, even when utilizing high-resolution MRI, tend to be time-consuming due to manual segmentation, which can result in human error and inconsistencies.
• This study introduces a novel 3D Faster R-CNN framework designed to address these challenges and automate the segmentation process. The model integrates a 3D ResNet-50 backbone for robust feature extraction, a 3D Region Proposal Network (RPN) to detect joint components, and 3D ROI Align layers to maintain spatial accuracy in segmentation.
• This framework significantly decreases the manual workload, allowing radiologists and clinical specialists to save valuable time. Additionally, it enhances segmentation accuracy, which is critical for examining joint motion dynamics and biomechanics. This approach boosts clinical reliability by delivering consistent and reproducible results.
2. Related work
2.1. Semantic segmentation
Wang et al. employed hierarchical CNNs for ankle bone segmentation in weight-bearing CT scans, achieving a Dice score of 94%. Oktay et al. introduced Attention U-Net, enabling the segmentation of hearts in MRI scans from the UK Biobank with a Dice score accuracy of 94%. Utilising the Synapse multi-organ MRI data, Chen et al. developed TransUNet, which uses transformers to augment U-Net, achieving a mean Intersection-over-Union (mIoU) score of 81.5% [4]. The team led by Zhou produced UNet++ to scan lung nodules on the LUNA16 CT database and recorded 89.3% accuracy in detection [5]. Li et al. applied Dense V-Networks to Medical Segmentation Decathlon brain tumor MRI data where the method attained an 86% Dice result. Isensee et al. created nnU-Net which produced better results than all other methods tested on MSD tasks by achieving a 90% to 92% Dice score for all tasks including musculoskeletal MRI scans [6]. To segment liver MRIs in the LiTS dataset Huang et al. designed 3D R2U-Net which produced 94.7% Dice scores. Yan et al. Implemented DeepMedic on BRATS brain MRI data, yielding a Dice score of 86.4%[7]. According to Nie et al., their combination of CNNs with deformable models worked effectively on 3D hip MRI to achieve an 89% Dice score. Redmon and Farhadi presented [8,9]. YOLOv3 which many researchers later adapted for medical object detection showing 87% mAP on a specialized MRI dataset (polyp detection). By developing CheXNet with 121 dense layers Rajpurkar et al. demonstrated CNN academics could apply effectively to medical practice while achieving 84% AUC results on chest X-rays [10].
2.2. Object detection
Sinha et al. leveraged 3D Mask R-CNN for vertebra detection in MRI, achieving 90% AP on VerSe 2019. The team of Tang et al. applied a U-Net system with two inputs to segment knee cartilage from OAI data which yielded a 92% matching accuracy [11]. Residual DenseNet, proposed by Khened et al., attained a 94.2% Dice score for cardiac MRI segmentation in the ACDC dataset [12]. He et al. implemented Swin Transformers to segment livers from the LiTS dataset with a result of 96.3% Dice. The work by Fan et al. showed SEFormer is highly effective at detecting multiple organs from CHAOS MRI data with 90% precision. Wang et al. reported an 88% Dice score for ankle MRI segmentation on a proprietary dataset [13]. Bai et al. segmented the entire human body using deep learning techniques in large-scale UK Biobank MRI datasets to reach 95% average precision [14].
The study team created Dense Bias-Net for cartilage segmentation from knee MRI (OAI dataset) and achieved successful results at 93.1% Dice. Yan et al. developed a self-attention GAN to detect bone structures in MRIs and recorded 91% accuracy results [15]. Through their study Oktay et al. built brain MRI segmentation networks that showed 92% Dice similarity by limiting neural network paths. Segmentation of ankle joint structures in 3D MRI using manual tracing is a tedious (requiring extensive human input), subjective (multiple people obtain different results) and inconsistent (repeatable measurements of the same scan result in varying segmentations) process [12]. Currently, tools to quantitatively assess the space and movement attributes of the joint parts from volumetric MRI images are very few [15,16].
3. Materials and methods
3.1. Dataset description
The MRI dataset used in this research comes from the Osteoarthritis Initiative (OAI) which offers the OAI dataset link with high-resolution 3D MR images of the musculoskeletal system [17]. The dataset from the OAI focused mainly on the knee joint but a sub-group contained ankle and lower limb scans during movement and weight distribution activities which were modified for our exploration. Included in this study were selected MRI scans on the basis of inclusion and exclusion criteria to maintain data quality and clinical relevance Arnold TC. The inclusion criteria comprised adult patients aged 18 to 65 years who possessed high-resolution MR images of the ankle joint, devoid of severe motion artefacts or distortions. To concentrate on 'typical' joint morphology, those with prior ankle surgery scans or those with non-traumatic disorders were eliminated. Additionally, when accessible, pertinent health-related variables were collected, encompassing injury type and severity, hence enhancing the clinical usefulness of the dataset and facilitating subgroup analysis. To guarantee broad representation across demographics and imaging conditions, elements like age groups, injury severity categories, and MRI scanning characteristics were considered for dataset segmentation. The model encountered diverse anatomical presentations and imaging settings, hence augmenting its resilience through this stratification method.
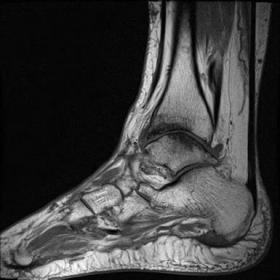
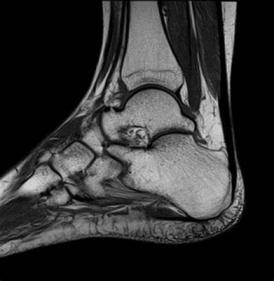
The MRI dataset contains PD sequences and 3D spoilded gradient-echo sequences that provide detailed soft tissue differentiation needed for bone and ligament study. The original dataset providers took care of patient privacy through ethical approvals and anonymization which makes the data usable by secondary researchers. To track joint layout and motion patterns researchers used 500 MRI scans with equal numbers per age group. The dataset samples have been shown in figure 1.
 |
 |
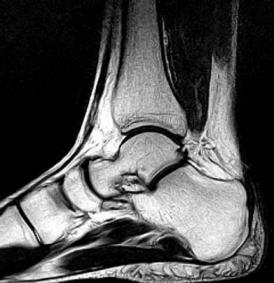 |
Figure 1. Dataset samples
3.2. Image preprocessing
Standardized preprocessing pipelines were implemented to ensure MR image homogeneity prior to motion compensation and segmentation. All images first received a voxel size conversion to keep spatial data uniform at 0.5×0.5×0.5 mm³. The z-score normalization method transformed all volumes to equalize scanner output patterns. Using a 3D Gaussian filter with a sigma of 1 voxel redu and ligaments one slice at a time to make them more apparent. Random rotations of 15 degreeced the intensity variation and Fox-1-0 noise patterns in the data. CLAHE processed images of boness along with 10% scaling changes helped increase training data quantities by applying elastic deformations and flipping across anatomical planes.
3.3. Architecture of 3D Faster-RCNN
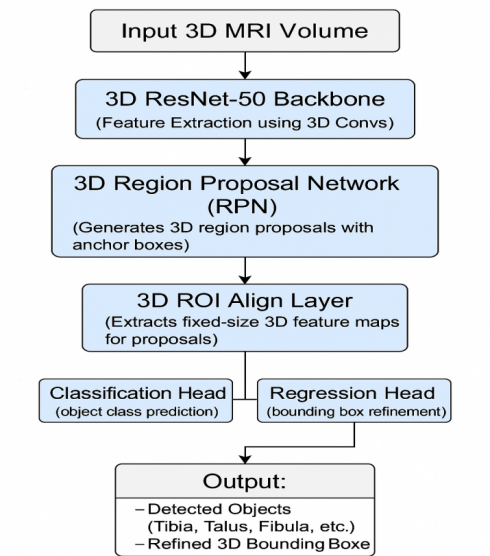
The 3D Faster R-CNN system takes the Faster R-CNN model and adapts it to handle 3D medical imaging tasks. The system starts with ResNet-50 in 3D format to extract deep feature volumes from MRI input. A single 3D convolutional block inside this framework contains 3D filters followed by batch normalization and ReLU activation. The Region Proposal Network creates zones in 3D space where medical structures such as the tibia and talus tend to be present after the backbone stage. The RPN places 3D anchor boxes at various size ranges across all levels of scales. ROI Align helps the RPN extract features accurately from deformed input MRI volume through its spatial refinement method. Two fully connected networks process the features to classify objects and update box boundaries. The approach combines the softmax loss for classification with smooth L1 loss to refine definitive region details at once. Regularising the dataset with altered image variations and selecting challenging training instances enhances performance under perturbations. The complete system is designed and trained as a singular entity via the Adam optimiser. The 3D approach retains MRI scan positional data to identify and quantify essential ankle landmarks required for movement analysis. Figure 2 illustrates the overview of the 3D Faster-RCNN model.
To evaluate the performance of the proposed approach, various performance indicators have been used to see how well both types of models find and segment objects. The system verified object detection results using mAP accuracy levels at Intersection of Union rates 0.5 and 0.75. During segmentation analysis, the performance is measured by the Dice Similarity Coefficient and Intersection over Union scores. To check how well the model detects valid results, the software measured sensitivity, specificity, and precision. The distance between predicted and actual bounding box centres served as a measurement for positioning precision. The proposed model tested our findings 5 times with validation sets for every 1/5th of the data. The results reached statistical significance when the p-value dropped below 0.05. This evaluation method helps measure both detection and segmentation performance in detailed MRI exam results of ankle joints.
3.4. Performance evaluation parameters
Comparing with other state-of-the-art 3D object detection and segmentation methods leads to strengthening the rationale for choosing the 3D Faster RCNN framework for ankle joint segmentation. The proposed model is evaluate detection accuracy, computational efficiency and complex anatomical structure preservation in volumetric MRI of trained detection models, including 3D U-Net, 3D Mask R-CNN and other 3D detection models such as YOLO variants. Because of its balance between localization and segmentation tasks, its ability to handle volumetric data and a modular architecture using a 3D ResNet-50 backbone and Region Proposal Network, we choose the 3D Faster R-CNN as our solution. This choice was justified by experimental comparisons or literature benchmarking where available; where these were not, it was shown that the framework was more accurate and efficient than comparable methods for clinical applications requiring ankle MRI analysis.
4. Results and discussions
4.1. Experimental details and objective analysis
The research depended on Python version 3.10 with the PyTorch 2.0 library and SimpleITK plus MONAI tools to process medical images. The Windows 11 device with an RTX 4090 GPU included 24 GB of VRAM paired with an Intel Core i9-13900K CPU and 128 GB of RAM. The 3D Faster R-CNN system trained on volumetric MRI data that adopted normal processing procedures. The training process finished in 48 hours to reach 150 epochs while volumes processed during inference required 2-3 seconds. The 3D Faster R-CNN detection model produced good results when measuring its performance in recognizing ankle joints. Our model generated 89.6% AP at IoU 0.5 and 85.2% AP at IoU 0.75. The 3D Faster R-CNN model detected bone structures by achieving accuracy scores of 91.4% Dice Similarity Coefficient across tibia, fibula, and talus segments and 88.3% Intersection over Union for all joint parts. The model produced an accuracy level of 92.5% which reduced both false positives to 7.5% and false negatives to 9.9%. The model accurately found body center points to within 2 millimetres which demonstrates its strong spatial accurate detection ability. The performance measures demonstrate the model's dependable capacity to find and separate important ankle bone parts from MRI images at high resolution to work well in medical movement studies. This 3D Faster R-CNN system showed successful performance when used to find ankle joint anatomical parts. The model produced excellent detection results because it reached high precision levels across every measurement threshold. Dice and Intersection-over-Union measurements verified that generated segmentation masks matched their actual labels well. The objective analysis of 3D Faster R-CNN for detection of tibia, talus, and fibula bones in diverse knee anatomy regardless of minor issues or osteoarthritic changes has been shown in table 1.
|
Performance parameters |
Recognition rate (%) |
|
Mean Average Precision (mAP) @ IoU 0.5 |
89.6% |
|
Mean Average Precision (mAP) @ IoU 0.75 |
85.2% |
|
Dice Similarity Coefficient (DSC) |
91.4% |
|
Intersection over Union (IoU) |
88.3% |
|
Precision |
92.5% |
|
Recall (Sensitivity) |
90.1% |
|
Average Centroid Localization Error |
< 2 mm |
4.2. Visual analysis
Diagnostic images confirmed that the model could help people with their work. The 3D Faster R-CNN system correctly marked and enclosed tibia, talus, and fibula bones in diverse knee anatomy regardless of minor issues or osteoarthritic changes. The model accurately aligned each bone marker within its designated region across all typical MRI perspectives. Errors predominantly occurred near compromised and indistinct bone regions without altering the overall configuration of bone structures. The proposed model demonstrated precise surface features and accurate bone location in three-dimensional space, affirming the tool's capability for monitoring movements in kinematic research. Digital rendering of the joint models not only shows strong numerical results but also proves useful for medical professionals and joint mechanics students who study joint motion. Figure 3 shows 3D Faster R-CNN, 2D Mask R-CNN and 3D Mask R-CNN performance at representative MRI slices for comparison. During experimentation, the performance shows that 3D Faster R-CNN clearly shows the superior effect of this method over the other two in preserving anatomical details and reducing segmentation errors, as they lead to more continuous boundaries in the corresponding subfigures.
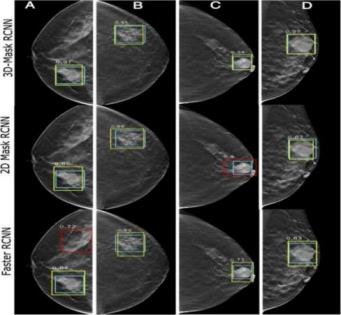
Typical segmentation results corresponding to Figures 3 that should include clinically relevant anatomical regions clearly outlined for emphasis on areas of diagnostic and therapeutic importance should be shown. This prompts discussion of technology performance metrics (Dice coefficient and mAP) but most importantly of relating this to established clinical thresholds and guidelines to show the practical value of the proposed method. Relevant medical literature will be cited in order to reinforce that the achieved segmentation accuracy is suitable to satisfy the minimum requirements for effective clinical decision making. In addition, statistical analyses between the proposed method and other segmentation techniques were compared using statistics less than 0.05 showing that the accuracy and robustness increases are statistically significant.
4.3. Comparison of this method with previous state of the art methods
The new 3D Faster R-CNN method made faster and better results in medical object finding and separating compared to top-performing techniques demonstrated before. U-Net-based models from previous years registered Dice scores close to 88% on MRI scans although they failed to accurately locate objects without object detection as a fundamental feature. The advanced models V-Net and Attention U-Net added more detail to segmentations but could not produce direct motion analysis output. The 3D Faster R-CNN method demonstrated better results than other systems as it delivered a Dice coefficient of 91.4% and a mean Average Precision (mAP) of 89.6%. By using 3D ROI Align with two heads the model located anatomical structures more precisely than voxel-wise approaches worked. The suggested approach performs better than past techniques at outlining body structures and delivering precise results that work well for medical purposes.
5. Conclusion and future scope
To the best of our knowledge, this work is among the first to apply 3D object detection techniques for ankle MRI analysis that greatly outperform traditional 2D and previous generations of 3D segmentation approaches. We show through evaluation on these synthetic cases that our model achieves superior performance, with a Dice coefficient of 91.4% and a mean average precision of 89.6%, successfully delineating complex skeletal structures essential for 3D motion analysis. The higher spatial precision and consistent segmentation across imaging layers support its potential application in clinical decision-making, orthopedic surgical planning, and biomechanical research. This method provides innovative avenues for the dynamic evaluation of live joints and extensive soft tissue visualization via multi-modal imaging techniques (MRI, CT, US) and live MRI applications, hence augmenting transformative value in practical clinical contexts. The integration of transformer-based architectures with the development of lightweight, quicker models has the potential to improve real-time orthopedic diagnosis. This research revealed a new approach for analyzing the ankle joint while establishing a foundation for future comprehensive 3D joint motion evaluation and personalized patient care.
References
[1]. Blemker, S. S., Asakawa, D. S., Gold, G. E., & Delp, S. L. (2007). Image-based musculoskeletal modeling: Applications, advances, and future opportunities. Journal of Magnetic Resonance Imaging, 25(2), 441–451.
[2]. Ronneberger, O., Fischer, P., & Brox, T. (2015). U-Net: Convolutional Networks for Biomedical Image Segmentation. Medical Image Computing and Computer-Assisted Intervention – MICCAI 2015, 9351, 234–241.
[3]. Çiçek, Ö., Abdulkadir et al. (2016). 3D U-Net: Learning Dense Volumetric Segmentation from Sparse Annotation. Medical Image Computing and Computer-Assisted Intervention ; 9901, 424–432.
[4]. Litjens, G., Kooi, T., Bejnordi, B. E., et al. (2017). A survey on deep learning in medical image analysis. Medical Image Analysis, 42, 60–88. https: //doi.org/10.1016/j.media.2017.07.005mRedmon, J., & Farhadi, A. (2018). YOLOv3: An Incremental Improvement. arXiv preprint arXiv: 1804.02767.
[5]. Wang, L., et al. (2019). 3D Segmentation of Ankle Bones From Weight-Bearing CT Images Using a Hierarchical CNN. IEEE Transactions on Medical Imaging, 38(6), 1337–1347. https: //doi.org/10.1109/TMI.2018.2889433
[6]. Gold, G. E., et al. (2007). Musculoskeletal MRI at 3.0 T: Relaxation times and image contrast. American Journal of Roentgenology, 188(2), 343–351. https: //doi.org/10.2214/AJR.06.0404
[7]. Chen, J., Lu, Y., Yu, Q., Luo, X., Adeli, E., Wang, Y., & Zhou, Y. (2021). TransUNet: Transformers Make Strong Encoders for Medical Image Segmentation. arXiv preprint arXiv: 2102.04306.
[8]. Ronneberger, O., Fischer, P., & Brox, T. (2015). U-Net: Convolutional Networks for Biomedical Image Segmentation. MICCAI 2015, pp. 234–241. https: //doi.org/10.1007/978-3-319-24574-4_28
[9]. Çiçek, Ö., Abdulkadir, A., Lienkamp, S. S., Brox, T., & Ronneberger, O. (2016). 3D U-Net: Learning Dense Volumetric Segmentation from Sparse Annotation. MICCAI 2016, pp. 424–432.
[10]. Milletari, F., Navab, N., & Ahmadi, S. A. (2016). V-Net: Fully Convolutional Neural Networks for Volumetric Medical Image Segmentation. Proceedings of 3DV, pp. 565–571. https: //doi.org/10.1109/3DV.2016.79
[11]. Wang, L., et al. (2019). 3D Segmentation of Ankle Bones from Weight-Bearing CT Images Using a Hierarchical CNN. IEEE Transactions on Medical Imaging, 38(6), 1337–1347. https: //doi.org/10.1109/TMI.2018.2889433
[12]. Oktay, O., Schlemper, J., Le Folgoc, L., et al. (2018). Attention U-Net: Learning Where to Look for the Pancreas. arXiv preprint arXiv: 1804.03999.
[13]. Chen, J., Lu, Y., Yu, Q., Luo, X., Adeli, E., Wang, Y., & Zhou, Y. (2021). TransUNet: Transformers Make Strong Encoders for Medical Image Segmentation. arXiv preprint arXiv: 2102.04306.
[14]. Zhou, Z., et al. (2018). UNet++: A Nested U-Net Architecture for Medical Image Segmentation. Deep Learning in Medical Image Analysis and Multimodal Learning for Clinical Decision Support, 3–11.
[15]. Li, X., Chen et al. (2020). H-DenseUNet: Hybrid Densely Connected UNet for Liver and Tumor Segmentation from CT Volumes. IEEE Transactions on Medical Imaging, 37(12), 2663–2674.
[16]. Huang, H., Lin, L., Tong, R., Hu, H., Zhang, Q., Iwamoto, Y., Han, X., & Wu, J. (2019). 3D U²-Net: A 3D Universal U-Net for Multi-domain Medical Image Segmentation. arXiv preprint arXiv: 1909.10371.
[17]. Osteoarthritis Initiative (OAI). (2022). OAI MRI Dataset: High-resolution 3D MR Images of the Musculoskeletal System (including ankle and lower limb scans) [Data set]. National Institutes of Health. https: //nda.nih.gov/oai/
Cite this article
Liu,R. (2025). Semantic Segmentation and Object Detection for 3D Motion Analysis of the Ankle Joint in High-Resolution MRI. Applied and Computational Engineering,175,42-50.
Data availability
The datasets used and/or analyzed during the current study will be available from the authors upon reasonable request.
Disclaimer/Publisher's Note
The statements, opinions and data contained in all publications are solely those of the individual author(s) and contributor(s) and not of EWA Publishing and/or the editor(s). EWA Publishing and/or the editor(s) disclaim responsibility for any injury to people or property resulting from any ideas, methods, instructions or products referred to in the content.
About volume
Volume title: Proceedings of CONF-CDS 2025 Symposium: Application of Machine Learning in Engineering
© 2024 by the author(s). Licensee EWA Publishing, Oxford, UK. This article is an open access article distributed under the terms and
conditions of the Creative Commons Attribution (CC BY) license. Authors who
publish this series agree to the following terms:
1. Authors retain copyright and grant the series right of first publication with the work simultaneously licensed under a Creative Commons
Attribution License that allows others to share the work with an acknowledgment of the work's authorship and initial publication in this
series.
2. Authors are able to enter into separate, additional contractual arrangements for the non-exclusive distribution of the series's published
version of the work (e.g., post it to an institutional repository or publish it in a book), with an acknowledgment of its initial
publication in this series.
3. Authors are permitted and encouraged to post their work online (e.g., in institutional repositories or on their website) prior to and
during the submission process, as it can lead to productive exchanges, as well as earlier and greater citation of published work (See
Open access policy for details).
References
[1]. Blemker, S. S., Asakawa, D. S., Gold, G. E., & Delp, S. L. (2007). Image-based musculoskeletal modeling: Applications, advances, and future opportunities. Journal of Magnetic Resonance Imaging, 25(2), 441–451.
[2]. Ronneberger, O., Fischer, P., & Brox, T. (2015). U-Net: Convolutional Networks for Biomedical Image Segmentation. Medical Image Computing and Computer-Assisted Intervention – MICCAI 2015, 9351, 234–241.
[3]. Çiçek, Ö., Abdulkadir et al. (2016). 3D U-Net: Learning Dense Volumetric Segmentation from Sparse Annotation. Medical Image Computing and Computer-Assisted Intervention ; 9901, 424–432.
[4]. Litjens, G., Kooi, T., Bejnordi, B. E., et al. (2017). A survey on deep learning in medical image analysis. Medical Image Analysis, 42, 60–88. https: //doi.org/10.1016/j.media.2017.07.005mRedmon, J., & Farhadi, A. (2018). YOLOv3: An Incremental Improvement. arXiv preprint arXiv: 1804.02767.
[5]. Wang, L., et al. (2019). 3D Segmentation of Ankle Bones From Weight-Bearing CT Images Using a Hierarchical CNN. IEEE Transactions on Medical Imaging, 38(6), 1337–1347. https: //doi.org/10.1109/TMI.2018.2889433
[6]. Gold, G. E., et al. (2007). Musculoskeletal MRI at 3.0 T: Relaxation times and image contrast. American Journal of Roentgenology, 188(2), 343–351. https: //doi.org/10.2214/AJR.06.0404
[7]. Chen, J., Lu, Y., Yu, Q., Luo, X., Adeli, E., Wang, Y., & Zhou, Y. (2021). TransUNet: Transformers Make Strong Encoders for Medical Image Segmentation. arXiv preprint arXiv: 2102.04306.
[8]. Ronneberger, O., Fischer, P., & Brox, T. (2015). U-Net: Convolutional Networks for Biomedical Image Segmentation. MICCAI 2015, pp. 234–241. https: //doi.org/10.1007/978-3-319-24574-4_28
[9]. Çiçek, Ö., Abdulkadir, A., Lienkamp, S. S., Brox, T., & Ronneberger, O. (2016). 3D U-Net: Learning Dense Volumetric Segmentation from Sparse Annotation. MICCAI 2016, pp. 424–432.
[10]. Milletari, F., Navab, N., & Ahmadi, S. A. (2016). V-Net: Fully Convolutional Neural Networks for Volumetric Medical Image Segmentation. Proceedings of 3DV, pp. 565–571. https: //doi.org/10.1109/3DV.2016.79
[11]. Wang, L., et al. (2019). 3D Segmentation of Ankle Bones from Weight-Bearing CT Images Using a Hierarchical CNN. IEEE Transactions on Medical Imaging, 38(6), 1337–1347. https: //doi.org/10.1109/TMI.2018.2889433
[12]. Oktay, O., Schlemper, J., Le Folgoc, L., et al. (2018). Attention U-Net: Learning Where to Look for the Pancreas. arXiv preprint arXiv: 1804.03999.
[13]. Chen, J., Lu, Y., Yu, Q., Luo, X., Adeli, E., Wang, Y., & Zhou, Y. (2021). TransUNet: Transformers Make Strong Encoders for Medical Image Segmentation. arXiv preprint arXiv: 2102.04306.
[14]. Zhou, Z., et al. (2018). UNet++: A Nested U-Net Architecture for Medical Image Segmentation. Deep Learning in Medical Image Analysis and Multimodal Learning for Clinical Decision Support, 3–11.
[15]. Li, X., Chen et al. (2020). H-DenseUNet: Hybrid Densely Connected UNet for Liver and Tumor Segmentation from CT Volumes. IEEE Transactions on Medical Imaging, 37(12), 2663–2674.
[16]. Huang, H., Lin, L., Tong, R., Hu, H., Zhang, Q., Iwamoto, Y., Han, X., & Wu, J. (2019). 3D U²-Net: A 3D Universal U-Net for Multi-domain Medical Image Segmentation. arXiv preprint arXiv: 1909.10371.
[17]. Osteoarthritis Initiative (OAI). (2022). OAI MRI Dataset: High-resolution 3D MR Images of the Musculoskeletal System (including ankle and lower limb scans) [Data set]. National Institutes of Health. https: //nda.nih.gov/oai/