


1. Introduction
Python, as a programming language, has become essential for data analysis across various fields due to its open-source nature and extensive ecosystem of libraries [1, 2]. The use of Python in the field of data science has seen a sharp rise, particularly in industries such as finance and healthcare [3]. It has established itself as the de facto tool for tasks ranging from simple data cleaning and visualization to complex machine learning models [4]. Python's libraries, including Pandas, NumPy, and Matplotlib, provide comprehensive solutions for data processing, statistical analysis, and visualization, making it an indispensable tool for both academics and industry professionals.
This paper focuses on Python's application in financial data analysis, specifically examining historical stock data from Xiaomi Corporation (stock code: 1810.HK). The research question centers on how Python can be leveraged for efficient data processing, visualization, and predictive analytics in the financial sector. Through the use of Python’s rich libraries, this study explores the process of cleaning stock data, calculating technical indicators like moving averages (MA) and the Relative Strength Index (RSI), and visualizing stock trends.
The methodology involves data extraction from historical records, followed by cleaning, calculation of indicators, and visualization using tools such as Pandas, Matplotlib, and mplfinance. The significance of this study lies in its demonstration of Python’s practical utility in enabling deeper insights into financial market dynamics. By providing a framework for stock price trend analysis, this research highlights Python’s potential to improve decision-making and predictive capabilities in financial analysis.
2. Literature review
2.1. The development history of data analysis
The evolution of data analysis has always been closely intertwined with technological innovation. The traditional statistical stage (from the 1960s to the 1980s) was dominated by closed-source tools such as SAS and SPSS, focusing on hypothesis testing and regression analysis. However, their high cost and code closure limited their popularity [5]. In the 1990s, the open-source movement gave rise to the R language. Its rich statistical packages (such as ggplot2) promoted the reproducibility of academic research. However, the shortcoming of engineering deployment made it difficult to integrate into the enterprise production environment [6].
Entering the 21st century, the advent of the big data era has completely restructured the analytical pattern. Distributed frameworks such as Hadoop and Spark have solved the problems of storage and computing of massive data, while data science has developed as an independent discipline, emphasizing the full life cycle management from data collection to insight implementation [7]. During this process, the tool ecosystem has undergone significant differentiation: Excel has gradually retreated to marginal scenarios due to its inability to handle unstructured data; Python has become the "greatest common divisor" of both academia and industry due to its open-source nature and cross-disciplinary capabilities (such as NumPy and Pandas). However, traditional tools such as SAS have seen their market share continue to shrink due to their closed ecosystem and high costs [1]. This evolution reveals the transformation logic of data analysis from a "closed professional tool" to an "open-source and inclusive technology."
2.2. Research status of Python in data analysis
The popularity rate of Python shows a "two-way penetration" feature in both the academic and industrial fields. In the academic field, a survey by the Nature journal shows that more than 68% of data science papers implemented algorithms using Python between 2019 and 2023. The main reason for this is that the interactivity of Jupyter Notebook facilitates the rapid verification of hypotheses [2]. In the industrial sector, Python implements distributed processing of terabytes of data through libraries such as PySpark and Dask and is used by enterprises like Amazon and Netflix for user behavior analysis and real-time recommendation systems [8].
However, technical challenges also emerge along with large-scale applications: Firstly, the explosion of data scale leads to the memory bottleneck of a single machine. Research proposes to optimize I/O efficiency through Dask parallelization or Arrow columnar storage [9]; Secondly, the real-time requirements drive the integration of stream processing frameworks (such as Kafka+Flink) with Python, but the concurrent limitations caused by the GIL (Global Interpreter Lock) still need to be mitigated with the help of multi-processes or C extensions [3]. Furthermore, the emergence of domain-specific tools (such as the biomedical library Biopython) reflects Python's continuous in-depth development in vertical scenarios. To conclude, Python is systematically addressing the escalating complexity of data analysis through ecological collaboration and technological iteration.
3. Python data processing, visualization, and analysis process
Based on the historical data of Xiaomi Corporation (stock code: 1810.HK) provided by Investing.com, text and numerical data visualization is implemented using Python.
3.1. Data reading and data cleaning
First, read historical stock data from a CSV file using the pandas library, and specify the date column as the index. At the same time, remove the English format thousands separator. Since the data is arranged in chronological order, for the missing data, use the forward fill method to handle it, ensuring the continuity and stability of the time series.
The specific code is as follows:
file_path = '1810.csv'
if not os.path.exists(file_path):
raise FileNotFoundError(f"File {file_path} not found. Please check the path and file name.")
df = pd.read_csv(
'1810.csv',
parse_dates=['Date'],
index_col='Date',
thousands=','
)
df.sort_index(inplace=True)
df.ffill(inplace=True)
3.2. Data processing and visualization
To more effectively evaluate stock trends and market sentiment, this paper calculates the following two mainstream technical indicators:
Moving Average (MA):
The moving average reflects the average value of prices within a certain time range and is often used to identify price trends. This paper calculates the 5-day and 20-day simple moving averages (SMA).
The specific code is below:
df['MA5'] = df['Close'].rolling(window=5).mean()
df['MA20'] = df['Close'].rolling(window=20).mean()
Relative Strength Index (RSI):
RSI is a momentum indicator used to measure the strength of price increases and decreases, and to identify overbought and oversold conditions.
The specific code is as follows:
delta = df['Close'].diff()
gain = delta.clip(lower=0)
loss = -delta.clip(upper=0)
avg_gain = gain.rolling(window=14).mean()
avg_loss = loss.rolling(window=14).mean()
rs = avg_gain / avg_loss
df['RSI'] = 100 - (100 / (1 + rs))
When the RSI is above 70, the market may be in an overbought state; when it is below 30, it may be in an oversold state.
Visualization: This article uses the mplfinance library to draw candlestick charts with technical indicators, achieving an intuitive display of stock price trends. This library focuses on financial time series charts and supports the overlay of technical indicators. At the same time, the Charles style is used, setting the color to red for rises and green for falls, making the chart more aesthetically pleasing.
The specific code is as follows:
try:
mpf.plot(
mpf_df,
type='candle',
style=mpf_style,
addplot=add_plots,
volume=True,
figratio=(12, 8),
title='Stock Price Analysis (Date Format: YYYY/MM/DD)',
ylabel='Price (CNY)',
ylabel_lower='Volume',
datetime_format='%Y/%m/%d'
)
plt.show()
except Exception as e:
print("Plotting failed. Error details:")
print(e)
3.3. Data analysis
The generated graph is shown below. Here are the corresponding analysis.
3.3.1. Price trend analysis
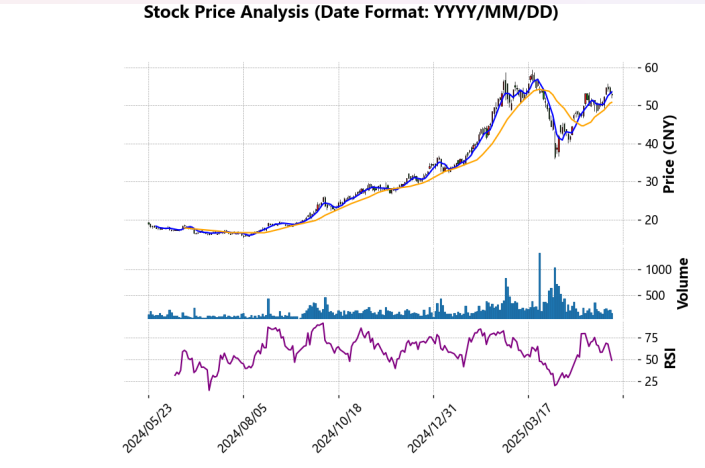
From the candlestick chart in the main image, it can be seen that the stock has shown a clear medium to long-term upward trend overall. Especially from the middle to the right side of the chart, the stock price has risen from around 20 yuan to a peak close to 60 yuan, with a considerable increase. Technically, the short-term (MA5) and medium-term (MA20) moving averages have maintained an upward trend for a long time, and MA5 has crossed above MA20 multiple times, further confirming the sustainability of the upward trend. During some periods, although the price fluctuated and pulled back, it never fell below the MA20 line, demonstrating a strong support effect.
3.3.2. Volume changes and market activity
The blue column chart located below the price chart represents the daily trading volume, reflecting the level of market participation. During the period when the price accelerates upward, the trading volume expands simultaneously, indicating a large amount of capital flowing in and high investor sentiment. The upward trend is supported by trading volume and has a certain degree of sustainability. However, in some high-price areas, a reduction in trading volume occurs, suggesting that the upward momentum is beginning to weaken and market sentiment is becoming cautious. Especially before the stock price adjustment in early 2025, the trading volume once sharply increased, which might reflect the concentrated exit of funds or profit-taking behavior.
3.3.3. The RSI indicator and market sentiment
The RSI curve at the bottom of the chart depicts the overbought and oversold conditions of the market. It can be seen from the chart that during the upward movement of the stock price, the RSI has repeatedly risen above 70, entering the overbought zone, which indicates that the price may be overvalued and there is a short-term risk of adjustment. The actual trend also confirms this: whenever the RSI exceeds 70, the stock price often experiences a decline to varying degrees. Conversely, when the RSI drops to around 30, it is often accompanied by a halt in the decline and a rebound in the price, creating a good buying opportunity. Therefore, the RSI indicator in the chart reflects the short-term mood swings of the market quite well and is an important supplement to the price trend.
By integrating price trends, moving averages, trading volume, and the RSI indicator, this chart presents the entire process of a stock from its consolidation at the bottom to the breakout of a trend, followed by a pullback and then a rebound. The coordination of moving averages provides a basis for judging medium and short-term trends, trading volume reveals market activity and capital flow, while the RSI effectively indicates whether the price is overheated or too cold in the short term. Overall, the stock maintains an upward momentum in the medium- and long term, but there are occasional high-level fluctuations and technical adjustments.
4. Discussion
The advantages of Python as a data analysis tool are reflected in many aspects, especially in handling large-scale data and generating visual charts. In this analysis of the historical stock price data of Xiaomi Corporation, the powerful library support of Python has made data cleaning, calculation of technical indicators, and trend analysis more efficient and convenient.
Firstly, the Pandas library in Python offers powerful data processing capabilities. We can easily read data from CSV files, handle missing values, and sort and fill data with Pandas, ensuring the continuity and stability of the data. This process is more flexible and efficient than traditional tools like Excel; especially when dealing with large-scale datasets, Python can provide higher performance and lower memory usage.
Secondly, Python has a distinct advantage in calculating technical indicators. For instance, with Pandas, we can quickly calculate the 5-day and 20-day simple moving averages (MA) of stocks, and use the same tool to calculate the relative strength index (RSI). These technical indicators are crucial for stock analysis and trend judgment, and Python's concise code and powerful function library significantly reduce the difficulty of implementing these analytical tasks.
In addition, visualization libraries such as Matplotlib and mplfinance in Python have made data presentation more intuitive and aesthetically pleasing. In this stock price analysis, we used mplfinance to draw candlestick charts and overlay technical indicators, making the stock market trends more clearly visible. This visualization effect not only improves the efficiency of the analysis but also helps us better understand market dynamics and investor sentiment.
In conclusion, Python's open-source code, powerful library support, and efficient data processing capabilities make its advantages in data analysis very obvious. Whether in data cleaning, computational analysis, or data visualization, Python has demonstrated its great potential as a tool for data science.
5. Conclusion
This article explored the application of Python in financial data analysis, particularly focusing on how to leverage its powerful data processing and visualization capabilities to analyze the historical stock data of Xiaomi Corporation. By utilizing libraries such as Pandas, Matplotlib, and mplfinance in Python, we successfully accomplished data cleaning, technical indicator calculation, and the visualization of stock market trends. These operations not only demonstrated the efficiency and flexibility of Python in data analysis but also highlighted its strong support in complex analytical tasks.
As an open-source programming language, Python has become one of the mainstream tools in the field of data science thanks to its rich ecosystem and extensive community support. In this study, the advantages of Python are reflected in multiple aspects: Firstly, it has a powerful data processing capability, especially when dealing with large-scale data, it can complete complex tasks through concise code; Secondly, Python provides a wealth of visualization tools, making the results of data analysis more intuitive and facilitating a deeper understanding of the trends and patterns behind the data; Finally, Python also supports seamless integration with other tools and platforms, further enhancing its application potential in various data analysis and prediction tasks.
Through this research, we have found that Python has broad application prospects in financial data analysis, which can help analysts quickly gain in-depth insights into the market and make more accurate investment decisions. In the future, with the continuous advancement of technology, Python will play an increasingly important role in more fields and become a core tool for data analysis and decision support. Overall, Python is not just a programming language; it is a powerful platform that drives the development of data science and intelligent analysis.
References
[1]. McKinney, W. (2017). Python for Data Analysis. O'Reilly Media.
[2]. Pérez, F., et al. (2023). The Jupyter Notebook as a Research Tool. Nature Methods.
[3]. VanderPlas, J. (2018). Python Data Science Handbook. O'Reilly Media.
[4]. Waskom, M. (2021). Seaborn: Statistical Data Visualization. Journal of Open Source Software, 6(60), 3021.
[5]. Cleveland, W. S. (2001). Data Science: An Action Plan for Expanding the Technical Areas of Statistics. International Statistical Review.
[6]. Tippmann, D. (2015). R for Data Science. Springer, Heidelberg.
[7]. Dhar, V. (2013). Data Science and Big Data Analytics. Wiley.
[8]. IDC. (2022). Market Trends and Insights on Data Science Platforms. IDC Report.
[9]. Rocklin, M. (2015). Dask: Parallel Computation with Blocked Algorithms. Journal of Open Source Software.
[10]. McKinney, W. (2012). Pandas: A Foundational Python Library for Data Analysis and Statistics. Python for Data Analysis. O'Reilly Media.
[11]. Hunter, J. D. (2007). Matplotlib: A 2D Graphics Environment. Computing in Science & Engineering, 9(3), 90-95.
[12]. Beckley, P. (2019). Data Science with Python. Addison-Wesley Professional.
[13]. Perez, F. and Granger, B. E. (2007). IPython: A System for Interactive Scientific Computing. Computing in Science & Engineering, 9(3), 21-29.
Cite this article
Wei,R. (2025). Data Analysis with Python: Methods, Tools and Practices-Data Processing, Visualization and Prediction Based on Python. Applied and Computational Engineering,178,112-121.
Data availability
The datasets used and/or analyzed during the current study will be available from the authors upon reasonable request.
Disclaimer/Publisher's Note
The statements, opinions and data contained in all publications are solely those of the individual author(s) and contributor(s) and not of EWA Publishing and/or the editor(s). EWA Publishing and/or the editor(s) disclaim responsibility for any injury to people or property resulting from any ideas, methods, instructions or products referred to in the content.
About volume
Volume title: Proceedings of CONF-CDS 2025 Symposium: Data Visualization Methods for Evaluation
© 2024 by the author(s). Licensee EWA Publishing, Oxford, UK. This article is an open access article distributed under the terms and
conditions of the Creative Commons Attribution (CC BY) license. Authors who
publish this series agree to the following terms:
1. Authors retain copyright and grant the series right of first publication with the work simultaneously licensed under a Creative Commons
Attribution License that allows others to share the work with an acknowledgment of the work's authorship and initial publication in this
series.
2. Authors are able to enter into separate, additional contractual arrangements for the non-exclusive distribution of the series's published
version of the work (e.g., post it to an institutional repository or publish it in a book), with an acknowledgment of its initial
publication in this series.
3. Authors are permitted and encouraged to post their work online (e.g., in institutional repositories or on their website) prior to and
during the submission process, as it can lead to productive exchanges, as well as earlier and greater citation of published work (See
Open access policy for details).
References
[1]. McKinney, W. (2017). Python for Data Analysis. O'Reilly Media.
[2]. Pérez, F., et al. (2023). The Jupyter Notebook as a Research Tool. Nature Methods.
[3]. VanderPlas, J. (2018). Python Data Science Handbook. O'Reilly Media.
[4]. Waskom, M. (2021). Seaborn: Statistical Data Visualization. Journal of Open Source Software, 6(60), 3021.
[5]. Cleveland, W. S. (2001). Data Science: An Action Plan for Expanding the Technical Areas of Statistics. International Statistical Review.
[6]. Tippmann, D. (2015). R for Data Science. Springer, Heidelberg.
[7]. Dhar, V. (2013). Data Science and Big Data Analytics. Wiley.
[8]. IDC. (2022). Market Trends and Insights on Data Science Platforms. IDC Report.
[9]. Rocklin, M. (2015). Dask: Parallel Computation with Blocked Algorithms. Journal of Open Source Software.
[10]. McKinney, W. (2012). Pandas: A Foundational Python Library for Data Analysis and Statistics. Python for Data Analysis. O'Reilly Media.
[11]. Hunter, J. D. (2007). Matplotlib: A 2D Graphics Environment. Computing in Science & Engineering, 9(3), 90-95.
[12]. Beckley, P. (2019). Data Science with Python. Addison-Wesley Professional.
[13]. Perez, F. and Granger, B. E. (2007). IPython: A System for Interactive Scientific Computing. Computing in Science & Engineering, 9(3), 21-29.