


1. Introduction
Real estate price modeling has long been a critical area of study within urban economics, data science, and policy planning. Large-scale property transaction datasets are becoming more widely available, giving academics the chance to quantitatively examine housing market dynamics at previously unheard-of geographical and temporal precision. In Japan, however, publicly available datasets that span multiple decades and include both geographical and structural property details are relatively rare. The "Japan Real Estate Transaction Prices" dataset, surveyed by the Ministry of Land, Infrastructure, Transport and Tourism (MLIT) and hosted on Kaggle, fills this gap by providing detailed transaction data from 2005 to 2019 across all 47 prefectures, including Tokyo [1].
Despite the rich structure of this dataset, many previous works have relied primarily on geographical or macro-level features, neglecting the role of property-specific characteristics (e.g., floor area, building type, renovation status) in shaping price variability. This study bridges that gap by specifically targeting Tokyo’s real estate market and comparing the predictive performance of models trained on two distinct subsets: a detailed subset that includes building features, and a limited subset that excludes them, while contains extra information such as floor plan. This study aims to improve real estate price prediction accuracy and to understand which structural and regional attributes matter most in urban housing valuation. Research findings provide valuable insights for data-driven housing policy, urban planning, and market transparency in Japan's rapidly aging and fluctuating property landscape.
2. Literature review
Previous research underscores the critical role of detailed structural attributes in urban landprice modeling. As projected by Uto et al., housing asset values are anticipated to plummet by approximately 94 trillion JPY by 2045 [2]. In particular, suburban regions are expected to experience losses exceeding 10 million JPY per household. This trend poses significant economic challenges for the implementation of compact city policies. Tsutsumi and colleagues show that their GIS-based regression kriging workflow yields a cross-validated RMSE of only 0.19 log units and enables automated land price mapping with over 90% cost savings relative to manual approaches [3].
Policydriven capital flows have also shaped Tokyo’s realestate dynamics. Yabe finds that J-REITs consistently influenced annual land price changes, though their positive effects were largely confined to business districts like Hibiya, Shinjuku, and Shibuya [4]. Matsumura also reports that the TSE REIT Index surged by 18.6 percent in the quarter, despite Tokyo’s office vacancy rate climbing to 6.0 percent—the highest level since December 1996 [5].
Longerterm structural shifts are equally impactful. Yamakata notes that annual real estate securitization grew from 1.9 trillion yen in 2000 to 6.9 trillion yen in 2005, coinciding with an increase in the 23-ward vacancy rate from 4.7 to 6.0 percent [6]. Meanwhile, the 2025 official land price data collected through National Land Survey indicate that residential land prices in the Tokyo metropolitan area rose by 4.2 percent year-on-year. This increase is driven by redevelopment projects and the popularity of inbound tourism areas [7].
At the micro level, tenant preferences and market segmentation continue to be crucial factors. Uesugi and Kirimura reveal that each extra minute of walking time to a station lowers monthly rent by ¥120, highlighting spatial variation across Tokyo’s wards [8]. Tanaka, Mari, and Asami, in compare central and suburban markets and find that factors like station proximity, garage availability, and setback rules strongly influence price similarity in Tokyo, whereas building age and CBD accessibility play a larger role in suburban Aoba Ward [9].
3. Methodology
3.1. Data collection
Given Tokyo’s pivotal economic and demographic role, and to minimize regional heterogeneity in modeling, this research focuses exclusively on transactions within Tokyo prefecture. Despite being confined to a single prefecture, the dataset remains robust, with a sufficiently large sample size and ample variation in structural and regulatory factors to support sophisticated analysis.
To address the dual challenges of data completeness and variable richness, this study deliberately partitioned the dataset into two distinct subsets: the detailed dataset and the limited dataset. This insight came from observing metadata patterns. Transactions that included Direction and Landscape information tended to contain more variables overall. Thus, the Tokyo dataset is divided into two partitions: detailed observations with high metadata availability such as Classification and Breath and limited observations with sparse descriptors such as FloorPlan. The resulting detailed set consists of approximately 147,000 observations, while the limited set, after basic NA filtering, contains around 169,000 rows.
3.2. Data analysis
3.2.1. Exploratory data analysis
Initial exploratory data analysis (EDA) was carried out on both the detailed and limited subsets to identify distributional properties, anomalies, and potential predictors. Continuous variables, including Area, UnitPrice, MinTimeToNearestStation, TotalFloorArea, and CoverageRatio, were visualized using histograms and density plots.
Categorical variables such as FloorPlan, Structure, CityPlanning, and Region were explored through frequency tables and bar plots. Notably, the FloorPlan variable exhibited high cardinality with values like "2LDK", "3LDK+S", and "1R", reflecting Japanese real estate norms. These were retained without simplification but encoded later using one-hot encoding.
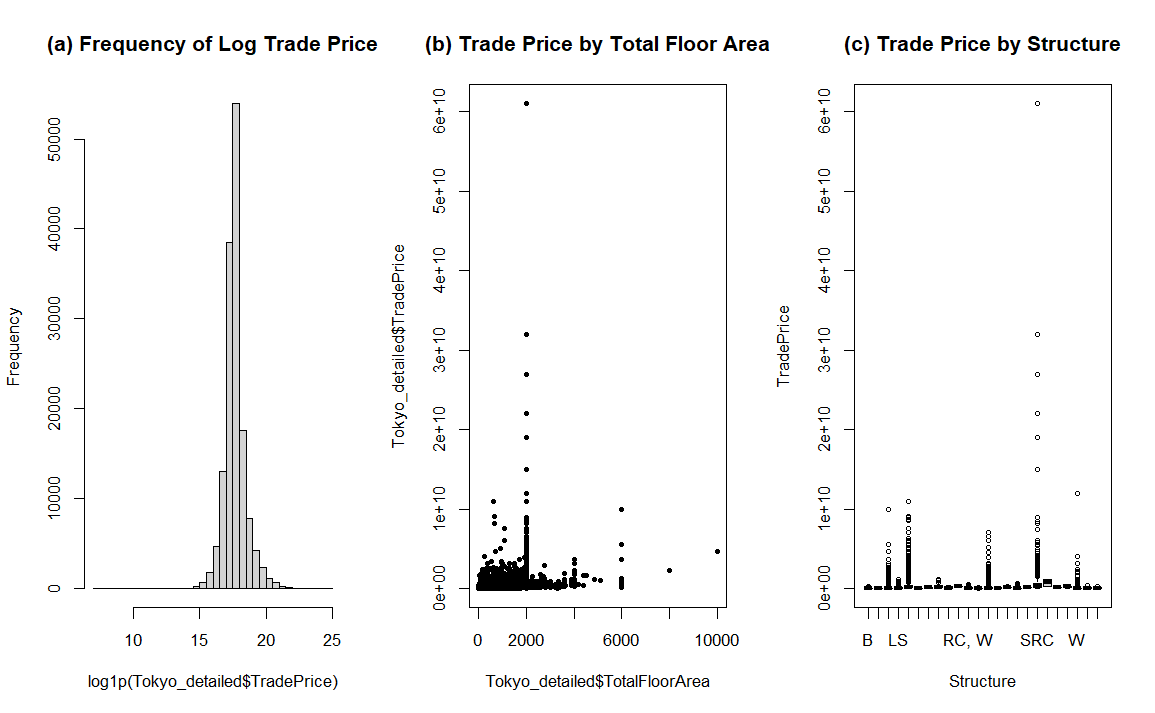
For detailed subset, Figure1 unveiled moderate associations between TradePrice, TotalFloorArea, and Structure. Figure 1(a) revealed that after log transformation, the trade price displayed a normal distribution with center at e^ (17.5) – 1 = 4×10^7 yen. Figure 1(b) displayed a nonlinear but positive association with heteroscedasticity. Figure 1(c) illustrated the distribution of trade price under each type of structure.
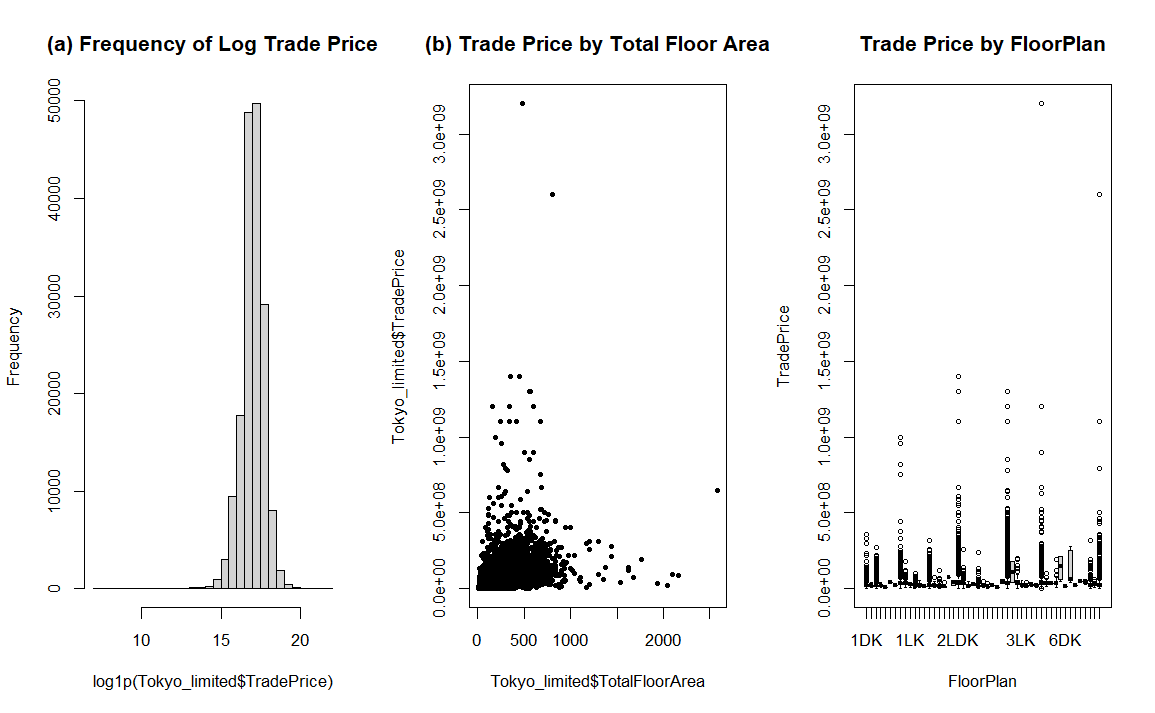
For limited subset, Figure 2 unveiled moderate associations between TradePrice, TotalFloorArea, and FloorPlan. Similar to the detailed subset, Figure 2(a) revealed that after log transformation the trade price displayed a normal distribution with center at e^ (16.5) – 1 = 1.465×10^7 yen. Unlike the detailed subset, Figure 2(b) displayed distinct and conspicuous directions toward up and right, indicating the lack of sufficient structural or contextual variables to fully explain price variation, potentially obscuring any strong relationship between size and price. Figure 1(c) illustrated the distribution of trade price under each type of Floor Plans instead of structure.
These visualizations brought a glimpse of the both detailed and limited data set, providing potential research and modeling directions for this study.
In addition, this study also inspected the pattern of missing data. The variable TotalFloorArea showed non-random missingness, which was partially imputable using Area and FloorAreaRatio via the relation: Total Floor Area ≈ Area * FAR. Thus, for observations lacking TotalFloorArea, through computing an imputed version using this formula and flagging imputed entries via a logical column (TotalFloorArea_imputed), missing values are implemented. This technique reduced data loss without introducing significant bias, as validated through visual inspection and summary comparisons.
3.2.2. Unsupervised clustering
To uncover latent market segments, this study applied k-means clustering to both the detailed and limited datasets. Prior to clustering, continuous variables were scaled using z-scores, and non-numeric columns were excluded. Experimented with cluster sizes ranging from 2 to 6, optimal number 4 is selected using the elbow method and average silhouette width.
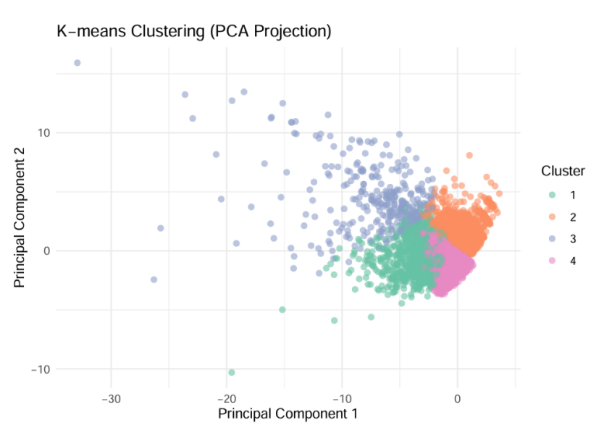
In the detailed subset, as displayed in figure 3, kmeans clustering identified four residential segments distinguished by structural and locational characteristics. Cluster 1 comprises moderately highpriced, mediumsized properties with relatively older building stock located closest to rail stations; these units are predominantly constructed from reinforced concrete or steel and occupy regular, semirectangular or rectangular lots—echoing Tanaka, Mari, and Asami’s observation that the general difference among each clusters of properties is closely corresponding to the different time cost of walking to the nearest railway station [7]. Cluster 2 includes belowaverage price and size homes that are newer, farther from stations, and largely wooden in construction. Cluster 3 represents an ultrapremium segment of spacious, older dwellings in prime locations, composed almost exclusively of reinforced concrete. Cluster 4 consists of lowpriced, compact newer homes that nonetheless remain in close proximity to transit and are typically woodframed.
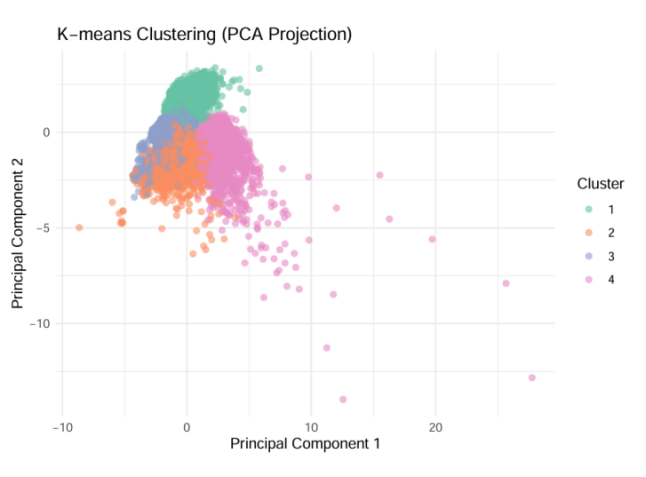
In the limited subset, clustering yielded groups characterized primarily by unit type, broad zoning context, and age rather than detailed structural features. As shown in figure 4, Cluster 1 groups the lowestpriced studiotype condominiums (1K – 1LDK) concentrated in commercial districts, all newly built and situated immediately adjacent to stations. Cluster 2 encompasses midpriced familysized units (2 – 4 LDK) in quasiindustrial or residential zones, newer but located farther from transit. Cluster 3 is defined by the oldest, smalltomidsized units with the lowest prices, positioned in mixed quasiindustrial/residential areas at moderate station distances. Cluster 4 captures the highestpriced band of spacious units (up to 3 LDK) along commercial corridors, newer in construction and very close to rail—supporting Tanaka, Mari, and Asami’s finding that within the less central area of Tokyo, the age of the building, the approachability to the major and popular business districts and the land utilization are crucial to the similarity within each cluster [7].
3.3. Predictive modeling setup
TradePrice is regarded as the response variable in predictive modeling. This study employed a split-sample approach with 80% of data used for training and 20% for testing. For each subset (detailed and limited), three model classes are evaluated: multiple linear regression, random forest, and XGBoost.
Preprocessing was standardized using the recipes package. Every numerical variable was scaled, centered, and, if required, median-imputed. Categorical predictors were one-hot encoded. In several first regression attempts, multicollinearity and high p-values were identified. To address it, this study removed redundant and insignificant predictors based on model diagnostics and thus refined the feature set accordingly.
In the linear regression on the detailed set, key predictors included Area, UnitPrice, BuildingYear, and MinTimeToNearestStation. Categorical variables such as CityPlanning zones and Direction also exhibited explanatory power. The model achieved an R-squared of approximately 0.425 and RMSE of 1.55 * 10^8 yen. While moderate, this reflected known limitations in modeling real estate prices using only observable structural variables.
Next, Random Forest model was applied using the randomForest package. With 100 trees, the model achieved significantly improved metrics: RMSE of approximately 6.77 * 10^7 and R-squared of 0.90 on training, and generalization RMSE of 1.85 * 10^7 on testing. Variable importance plots showed Area, UnitPrice, and MinTimeToNearestStation as top contributors, followed by FloorAreaRatio and CityPlanning zone. Random forest was resilient to nonlinearity and interaction effects, outperforming linear regression particularly on the detailed dataset.
An XGBoost model was then trained with hyperparameter tuning. This model delivered slightly lower performance than Random Forest with a test R-squared of 0.55 and RMSE around 1.90 * 10^7, suggesting that tree-based ensemble methods are generally robust, yet XGBoost may require deeper parameter optimization.
Moving to the limited subset, despite the reduced feature richness, the ordinary least squares model still explained roughly 37 percent of the variance (R² ≈ 0.37) with an RMSE around ¥9.4 * 10^7, underscoring the continued importance of core locational and built‐form indicators even when fine‐grained metadata are removed.
A random‐forest ensemble—constructed with 100 trees on the same processed inputs—substantially improved both fit and generalization. Training‐set performance soared (R² ≈ 0.88; RMSE ≈ ¥5.3 * 10^7), and hold‐out RMSE dropped to about ¥1.90 * 10^7. Variable‐importance measures highlighted lot area, building year, and transit proximity as the strongest predictors, followed by coverage ratio and floor‐area ratio. Notably, the absence of frontage and land‐shape features did little to diminish the ability to uncover the nonlinear interactions that drive price variation—an advantage of tree‐based methods in limited‐feature settings.
An XGBoost model was then trained with grid‐search tuning over max depth, learning rate, and minimum child weight. Although it captured many of the same nonlinear effects, its test‐set R² plateaued near 0.53 with an RMSE of approximately ¥2.05 * 10^7, slightly worse than the random forest. This implies that gradient boosting may need more thorough parameter calibration to match the resilience of forests when structural richness is limited by missing data, but it still outperforms linear models in terms of predictive accuracy.
4. Evaluation and comparison
Across all models, the detailed dataset consistently outperformed the limited dataset. This underscores the value of retaining and imputing metadata fields rather than discarding them. In linear regression, dropping variables with high p-values improved interpretability without sacrificing much accuracy. In ensemble models, feature richness substantially improved predictive power.
While both Random Forest and XGBoost outperformed linear regression, Random Forest achieved the best trade-off between accuracy and stability, which matched the conclusion of Derdouri and Murayama who conducted similar research toward land price targeting Fukuoka prefecture, agreeing that Random Forest had the overall superiority [10]. The inclusion of variables like Structure, Direction, and CityPlanning contributed meaningful variance explanation, especially in the presence of nonlinear interactions.
Importantly, the split between the detailed and limited datasets allows for a practical implication: when only limited metadata is available, performance suffers, but meaningful modeling is still feasible. However, when richer information is retained—even with modest imputation—more accurate and interpretable models emerge. This suggests that future real estate data collection efforts should prioritize comprehensive metadata capture, even at the expense of full completeness.
In summary, the combined use of EDA, clustering, and layered modeling allowed us to uncover distinct price-driving factors in Tokyo’s real estate market. The structured comparison between the detailed and limited subsets, supported by diagnostics and performance evaluation, offers a replicable template for urban modeling in other regions or datasets.
5. Conclusion
This study investigates the determinants of real estate prices in Tokyo by combining exploratory data analysis, unsupervised clustering, and predictive modeling. Drawing on multi-year transaction data from the MLIT, the analysis compared a detailed and a limited subset to evaluate how variable richness and data completeness affect model performance and interpretability. Results consistently favored the detailed dataset. Although the limited subset facilitated cleaner modeling due to fewer missing values, it omitted key attributes—such as Structure, Direction, and TotalFloorArea—that proved critical for explanatory and predictive tasks. With suitable imputation and feature engineering, the detailed subset enabled a more nuanced understanding of pricing dynamics. Unsupervised clustering revealed distinct market segments, such as high-end central units and peripheral low-cost dwellings, which mirrored known socio-spatial divisions in Tokyo. Predictive modeling showed that while linear regression offered baseline interpretability, ensemble methods—particularly Random Forest—substantially improved accuracy, reducing RMSE by nearly 90%. These gains were enhanced through thoughtful feature inclusion and iterative model refinement.
The study highlights the value of preserving rich metadata, even if partially missing, and demonstrates a scalable framework for urban housing analysis that balances interpretability and predictive strength. The comparison between limited and detailed datasets also underscores the trade-offs data providers and analysts must consider in real-world modeling scenarios. Nonetheless, this research is limited in scope to the Tokyo metropolitan area. Future work could apply the same methodology to other Japanese cities to assess generalizability, incorporate spatial autocorrelation, or integrate time-series and hierarchical models to improve both granularity and inference.
References
[1]. Kaggle. (2005-2019). Japan Real Estate Prices. https: //www.kaggle.com/datasets/nishiodens/japan-real-estate-transaction-prices
[2]. Uto, M., Nakagawa, M., & Buhnik, S. (2023). Effects of housing asset deflation on shrinking cities: A case of the Tokyo metropolitan area. Cities, 132, 104062.
[3]. Tsutsumi, M., Shimada, A., & Murakami, D. (2011). Land price maps of Tokyo metropolitan area. Procedia-Social and Behavioral Sciences, 21, 193-202.
[4]. YABE, N. (2008). Impacts of real estate securitization on land price changes in the inner city of Tokyo since 2001: A geographically weighted regression analysis. Geographical Review of Japan, 81(5), 384-403.
[5]. Matsumura, T. Japanese Property Market Quarterly Review, First Quarter 2012~ Sizable Grade-A Supply Overwhelms the Tokyo Office Market~.
[6]. Yamakata, T. (1999). Trends in the Tokyo Investment Real Estate Market.
[7]. Ministry of Land, Infrastructure, Transport and Tourism. (2025). 2025 Land Price Summary. National Land Survey.
[8]. Uesugi, M., & Kirimura, T. (2008). Estimating Residential Preference in Tokyo based on Real Estate Property Database. Geographical Review of Japan, 81(5), 384–403.
[9]. Tanaka, M., & Asami, Y. (2016). Study on Comparison of the Housing Market Structure in Tokyo and Suburbs of Tokyo. ResearchGate.
[10]. Derdouri, A., & Murayama, Y. (2020). A comparative study of land price estimation and mapping using regression kriging and machine learning algorithms across Fukushima prefecture, Japan. Journal of Geographical Sciences, 30, 794–822.
Cite this article
Hou,Z. (2025). Modeling Real Estate Transaction Prices in Tokyo: The Value of Comprehensive Metadata in Unsupervised Clustering and Predictive Modeling Analysis. Applied and Computational Engineering,175,130-137.
Data availability
The datasets used and/or analyzed during the current study will be available from the authors upon reasonable request.
Disclaimer/Publisher's Note
The statements, opinions and data contained in all publications are solely those of the individual author(s) and contributor(s) and not of EWA Publishing and/or the editor(s). EWA Publishing and/or the editor(s) disclaim responsibility for any injury to people or property resulting from any ideas, methods, instructions or products referred to in the content.
About volume
Volume title: Proceedings of CONF-CDS 2025 Symposium: Application of Machine Learning in Engineering
© 2024 by the author(s). Licensee EWA Publishing, Oxford, UK. This article is an open access article distributed under the terms and
conditions of the Creative Commons Attribution (CC BY) license. Authors who
publish this series agree to the following terms:
1. Authors retain copyright and grant the series right of first publication with the work simultaneously licensed under a Creative Commons
Attribution License that allows others to share the work with an acknowledgment of the work's authorship and initial publication in this
series.
2. Authors are able to enter into separate, additional contractual arrangements for the non-exclusive distribution of the series's published
version of the work (e.g., post it to an institutional repository or publish it in a book), with an acknowledgment of its initial
publication in this series.
3. Authors are permitted and encouraged to post their work online (e.g., in institutional repositories or on their website) prior to and
during the submission process, as it can lead to productive exchanges, as well as earlier and greater citation of published work (See
Open access policy for details).
References
[1]. Kaggle. (2005-2019). Japan Real Estate Prices. https: //www.kaggle.com/datasets/nishiodens/japan-real-estate-transaction-prices
[2]. Uto, M., Nakagawa, M., & Buhnik, S. (2023). Effects of housing asset deflation on shrinking cities: A case of the Tokyo metropolitan area. Cities, 132, 104062.
[3]. Tsutsumi, M., Shimada, A., & Murakami, D. (2011). Land price maps of Tokyo metropolitan area. Procedia-Social and Behavioral Sciences, 21, 193-202.
[4]. YABE, N. (2008). Impacts of real estate securitization on land price changes in the inner city of Tokyo since 2001: A geographically weighted regression analysis. Geographical Review of Japan, 81(5), 384-403.
[5]. Matsumura, T. Japanese Property Market Quarterly Review, First Quarter 2012~ Sizable Grade-A Supply Overwhelms the Tokyo Office Market~.
[6]. Yamakata, T. (1999). Trends in the Tokyo Investment Real Estate Market.
[7]. Ministry of Land, Infrastructure, Transport and Tourism. (2025). 2025 Land Price Summary. National Land Survey.
[8]. Uesugi, M., & Kirimura, T. (2008). Estimating Residential Preference in Tokyo based on Real Estate Property Database. Geographical Review of Japan, 81(5), 384–403.
[9]. Tanaka, M., & Asami, Y. (2016). Study on Comparison of the Housing Market Structure in Tokyo and Suburbs of Tokyo. ResearchGate.
[10]. Derdouri, A., & Murayama, Y. (2020). A comparative study of land price estimation and mapping using regression kriging and machine learning algorithms across Fukushima prefecture, Japan. Journal of Geographical Sciences, 30, 794–822.