1. Introduction
As living standards and quality improve, customers' perceptions of hotel selection will shift. Existing research includes, for example, Ximei's design of a hotel reservation management platform and analysis of real-time booking data from consumers to increase customer and merchant satisfaction [1], as well as the use of the algorithm of collaborative filtering to enhance the effect of hotel personalized recommendation [2]. Unfortunately, this does not guarantee that the passengers would not be involved in an accident or cancel their hotel arrangement. Sometimes, especially during the height of the tourism season, guests are unable to check in normally owing to broken promises or other issues, which reduces the hotel's efficiency and revenue. This research focuses mostly on predicting the status of hotel reservations rather than making recommendations.
In this paper, some attributes of the hotel reservations dataset are discovered firstly by using language of python and then some machine learning models (KNN, RF, DT, LR, SVM and Neural Network) are adopted to train the data of hotel reservations, the accuracy of each model is obtained and compared, and the model with the highest accuracy is selected to predict whether customers will cancel or confirm the reservation.
The meanings of this study is not only to find excellent data prediction methods and innovative methods for the field, to provide reference for learners committed to data prediction, but also to help hotels more flexibly deal with all kinds of unexpected events in booking, to ensure the interests of the hotel, especially during the tourism period, tourists and hotels can achieve a win-win situation.
2. Dataset
2.1. Dataset information
The subject of this experiment is an open-source dataset from Kaggle called hotel reservations, this file contains the different attributes of customers' reservation details, for instance, average price, lead time. A total of 36,275 unique values and 18 characteristic attributes were recorded in this dataset which is the type of classification and complete dataset since it has no missing values and classified according to the last attribute, “booking_status”. It has two categories in total, including cancel and not cancel, and they are compared with predict results as reference. The Table 1 contains some basic statistical characteristics in every feature, based on these results, the numerical range of each attribute can be gained.
Table 1. Statistical characteristics in some features. (source:https://www.kaggle.com/datasets/ahsan81/hotel-reservations-classification-dataset) | |||||
No_of_adults | No_of_children | ... | Avg_price_per_room | No_of_special_requests | |
count | 36275 | 36275 | ... | 36275 | 36275 |
mean | 1.844962 | 0.105279 | ... | 103.423539 | 0.619655 |
std | 0.518715 | 0.402648 | ... | 35.089424 | 0.786236 |
min | 0.000000 | 0.000000 | ... | 0.000000 | 0.000000 |
25% | 2.000000 | 0.000000 | ... | 80.300000 | 0.000000 |
50% | 2.000000 | 0.000000 | ... | 99.450000 | 0.000000 |
75% | 2.000000 | 0.000000 | ... | 120.000000 | 1.000000 |
max | 4.000000 | 10.000000 | ... | 540.000000 | 5.000000 |
2.2. Data visualization
Due to the large number of records and attributes in this dataset, even with some information about statistical characteristics, it is difficult to understand the rules between the data. In this case, for complicated data, data visualization in the form of charts can help to more intuitively present the rules between data and the hidden information from multiple angles. Here are some examples:
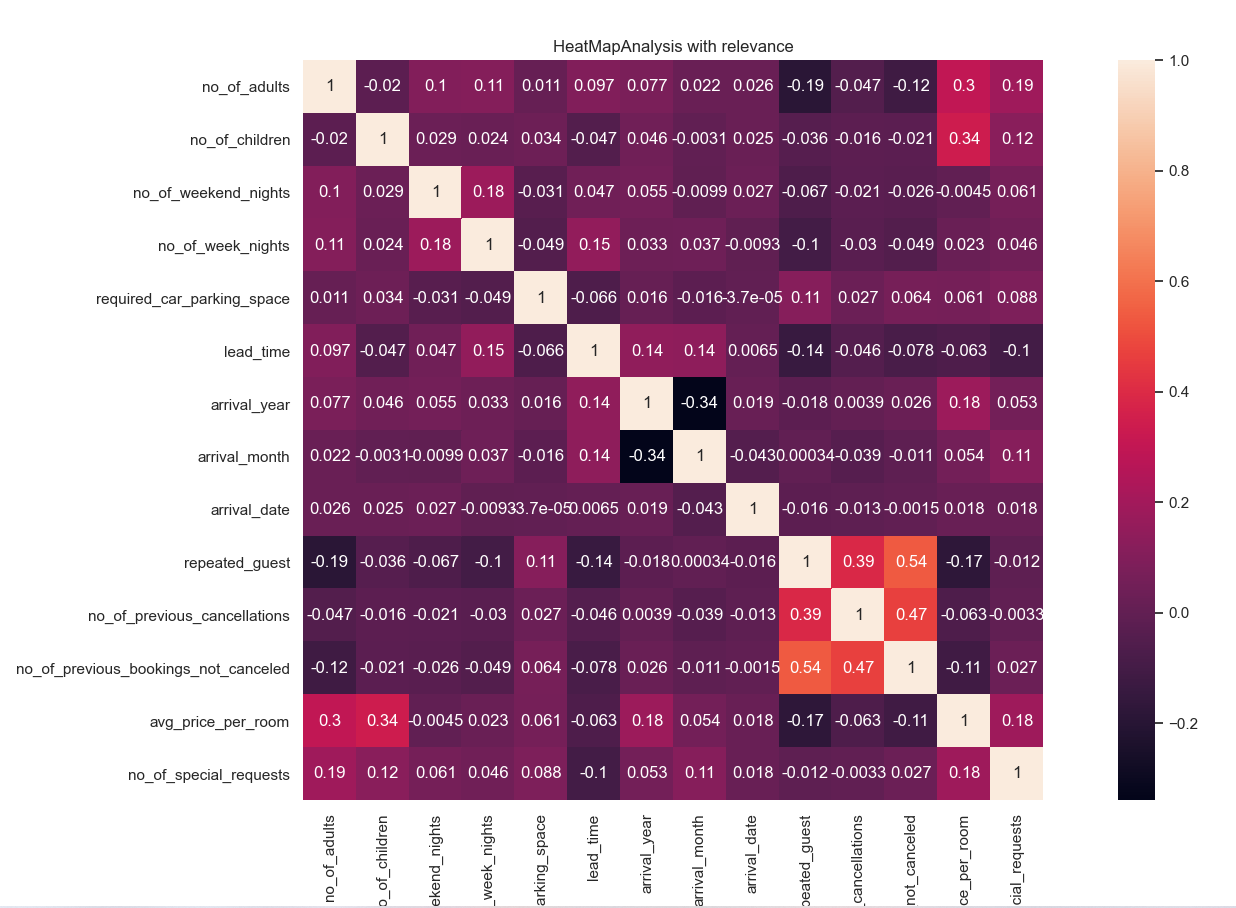
As shown in Figure 1, it gives relevance between each pair of features by using the heatmap which is a good way to show how correlated the different attributes are, positive or negative, and how correlated (degree) they are as well.
|
Figure 1. Relation for each pair of features. |
KDE is kernel density estimation, which is used to estimate the unknown density function in the probability theory. It is one of the non-parametric test methods. The distribution characteristics of the data samples can be seen intuitively through the kernel density estimation (figure 2) are some KDE figures for each feature in this dataset based on classification attribute index. Based on this type of graph, estimates are obtained for each point of the density function that can approximate the distribution of the data, thus representing the distribution of the data, which is more intuitive than simple statistical characteristics of the data.
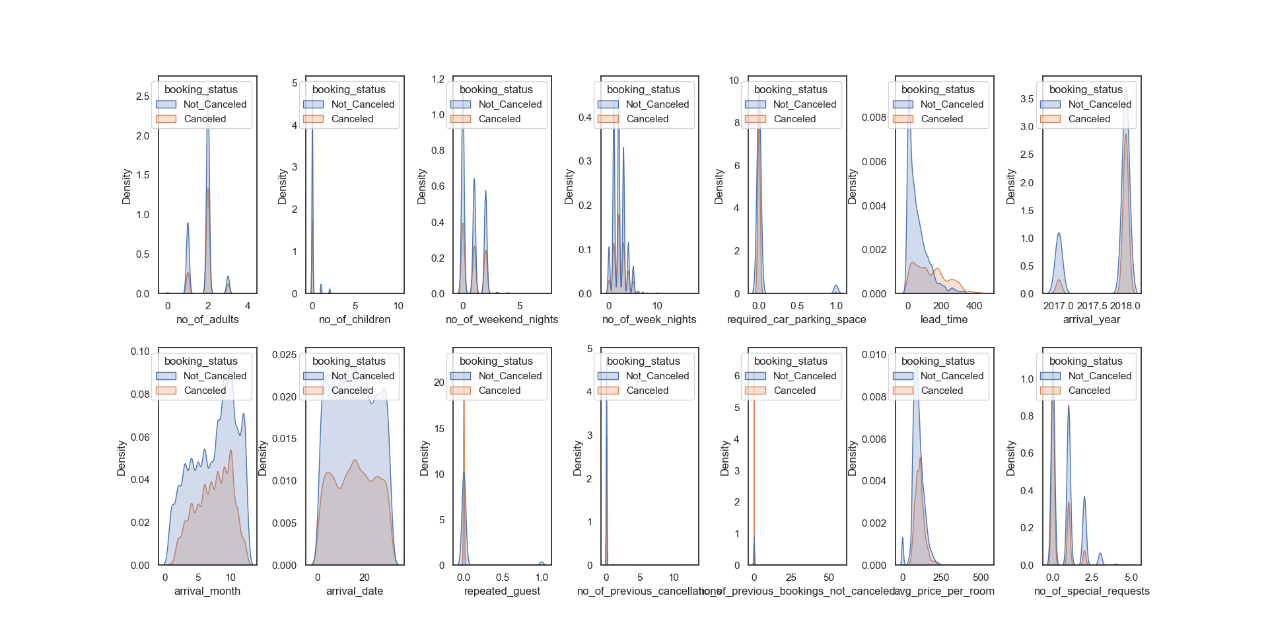
Figure 2. Density distribution for all attributes.
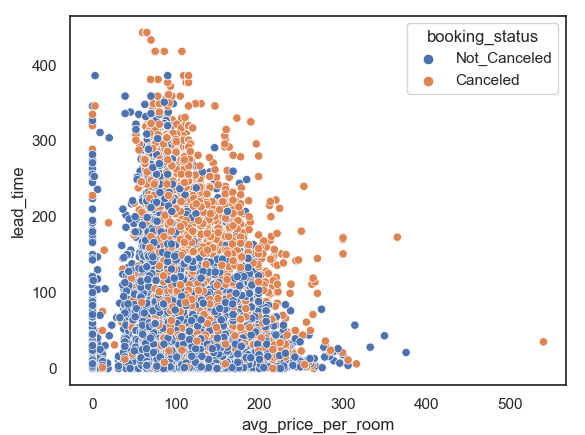
Figure 3 shows the scatter plot between average price and lead time Categorize by reservation status, the lead time means the date that a customer books hotel to actual arrive date and it shows the rule that with the increase of average price and lead time, travelers are more likely to cancel hotel reservations.
|
Figure 3. Scatter for average price and lead time. |
A series of data visualization technologies are indeed conducive to mining the information and rules behind complex data. In order to predict the results of data and discover the information between data more fully, some machine learning methods will be used in the next part of this paper to achieve this purpose.
3. Machine Learning Models
Before sending data into these models, the dataset was divided into 2 parts, including training set and test set with 80% and 20% respectively.
3.1. KNN (K-Nearest Neighbor)
KNN classification method is a successful and simple-to-implement classifier that uses similarity measures such as Manhattan distance and Euclidean distance to identify the data types of various machine learning datasets [3]. In n-dimensional space, the Euclidean distance corresponds to the length of the shortest line. It is a frequently employed definition of distance, which is the actual separation between two locations in m-dimensional space.
|
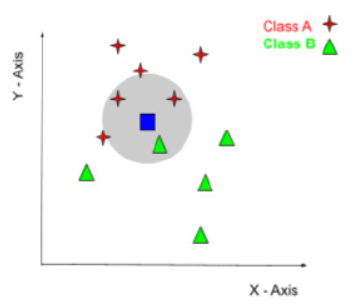
Figure 4. Example knn classification with two classes a and b [3]. |
As figure 4 shows that KNN aggregates samples of the same category in the feature space and then takes the average value of sample output of the nearest K samples as the regression predictive value.
In order to achieve this model in python, it is divided into 4 main sections:
The first step is to import the library of “KNeighborsClassifier”.
Secondly, fit the model by using the training dataset.
Then, predict test dataset and make comparison.
Lastly, calculate the accuracy or draw the confusion matrix.
|
|
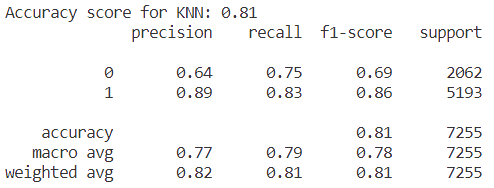
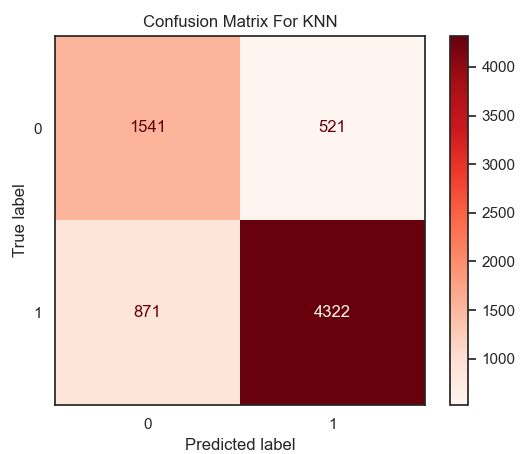
Figure 5. Result of accuracy for KNN model. | Figure 6. Confusion matrix for KNN. |
As the figure 5 and 6 showing that the value of accuracy in the model of KNN is equal to 0.81 on this dataset.
3.2. RF (Random Forest)
RF is a machine learning approach to integrate, it adopts the bootstrap aggregated (bagging) and the characteristics of randomized to generate a decision tree forest aren't related [4]. The algorithm uses a random way to build up decision trees, and then these decision trees formed a forest, each decision tree has no correlation, when there is a new sample input, let each tree make an independent judgment, according to the majority rule to decide the sample classification results.
In order to achieve this model in python, it is also divided into 4 main sections:
(a) The first step is to import the library of “RandomForestClassifier”.
(b) Secondly, fit the model by using the training dataset.
(c) Then, predict test dataset and make comparison.
(d) Lastly is calculate the accuracy or draw the confusion matrix.
|
|
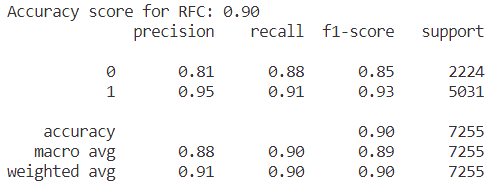
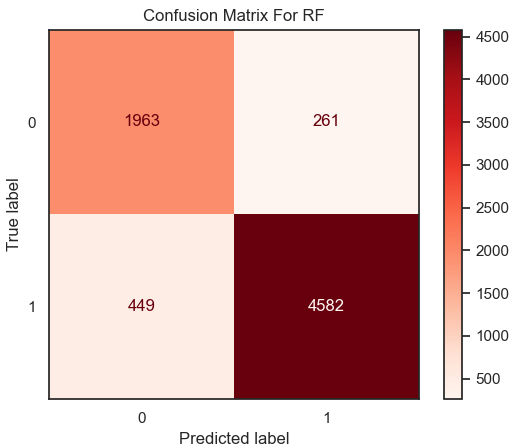
Figure 7. Result of accuracy for RF model. | Figure 8. Confusion matrix for RF. |
From the result in figure 7 and heatmap of confusion matrix 8, that the value of accuracy in the model of Random Forest is equal to 0.90 on this dataset.
3.3. DT (Decision Tree)
The decision tree is a non-linear structure in which each non-terminal node represents a "split" that is a test of a condition and each leaf node includes a decision [5]. The procedure of the decision tree starts from the root node of the decision tree, compare the data to be measured with the feature nodes in the decision tree, and pick the next comparison branch according to the comparison results until the leaf node is the final decision result. Hence, changing segmentation without changing leaf decisions will significantly affect performance. In order to achieve this model in python, it is also divided into 4 main sections:
The first step is to import the library of “DecisionTreeClassifier”.
Secondly, fit the model by using the training dataset.
Then, predict test dataset and make comparison.
Lastly is calculate the accuracy or draw the confusion matrix.
|
|
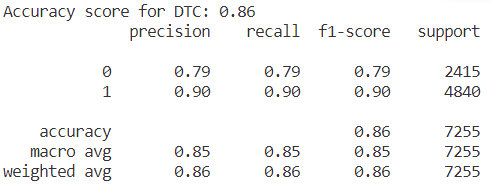
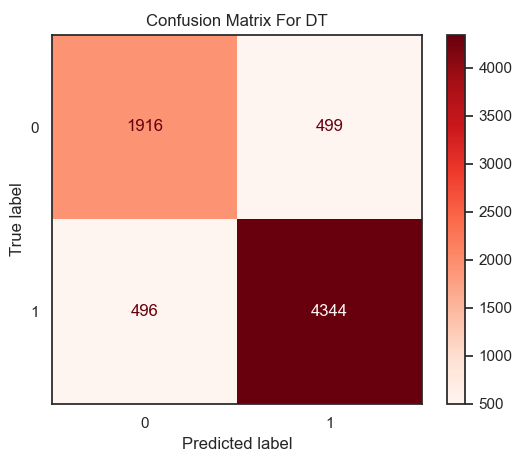
Figure 9. Result of accuracy for DT model. | Figure 10. Confusion matrix for DT. |
From the result in figure 9 and heatmap of confusion matrix 10, that the value of accuracy in the model of Decision Tree is equal to 0.86 on this dataset.
3.4. LR (Logistic Regression)
Many essential business scenarios are ideal for discrete outcome variables, whereas linear regression models are superior for continuous outcome variables. Logistic regression works better [6]. Applying any input to the interval [0,1] and getting a predicted value in the linear regression, then mapping that value to the Sigmoid function, completes the sorting operation by converting value to probability. In order to achieve this model in python, it is also divided into 4 main sections:
The first step is to import the library of “LogisticRegression”.
Secondly, fit the model by using the training dataset.
Then, predict test dataset and make comparison.
Lastly, calculate the accuracy or draw the confusion matrix.
|
|
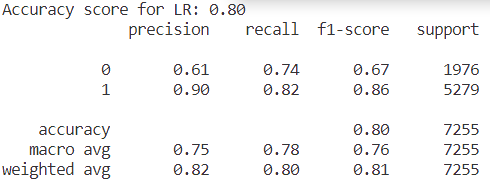
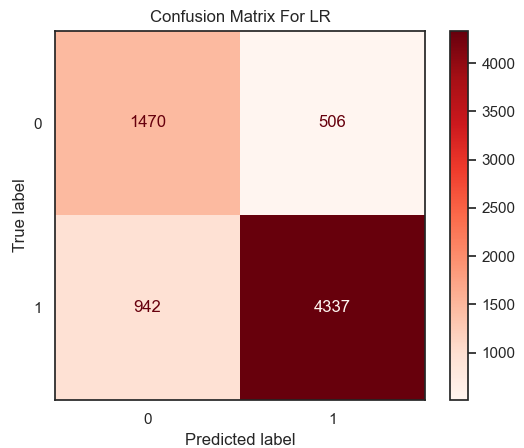
Figure 11. Result of accuracy for LR model. | Figure 12. Confusion matrix for LR. |
From the result in figure 11 and heatmap of confusion matrix 12, that the value of accuracy in the model of Logistic Regression is equal to 0.80 on this dataset.
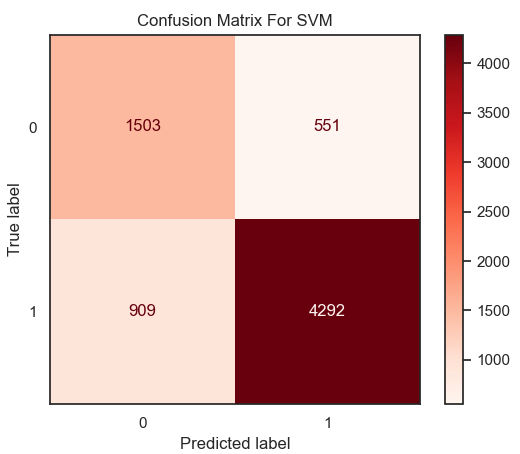
3.5. SVM
Support vector machine is a supervised machine learning approach for regression and classification problems, especially the latter. The coordinates' eigenvalues are shown in n-dimensional space. Classifying finds the hyperplane. The core approach converts the low-dimensional input space to high-dimensional. It separates an inseparable problem. Support vector training makes it memory efficient. This approach works well with unknown structures [7].
SVM makes instances of various categories separated by as broad an obvious space as feasible, then guesses the category based on which side of the interval they land on. SVM finds a hyperplane so distinct data categories can fall on both sides. In order to achieve this model in python, it is also divided into 4 main sections:
The first step is to import the library of “from sklearn.svm import SVC”.
Secondly, fit the model by using the training dataset.
Then, predict test dataset and make comparison.
Lastly, calculate the accuracy or draw the confusion matrix.
|
|
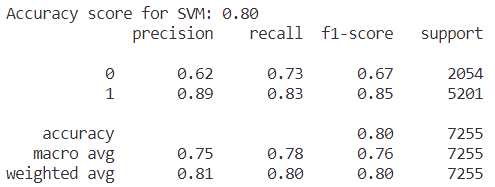
Figure 13. Result of accuracy for SVM model. | Figure 14. Confusion matrix for SVM. |
From the result in figure 13 and heatmap of confusion matrix 14, that the value of accuracy in the model of SVM is equal to 0.80 on this dataset.
3.6. Neural Network
Parts of the architecture, such as the convolution network, is not appropriate for scientific computing applications. TensorFlow and Keras offer a vast array of capabilities, such as optimization algorithm, automatic differential model parameter derivation, and transfer learning [8].
Python-based Keras is an advanced neural network API. Keras' fundamental data structure is the model, a method for arranging network layers. The Sequential sequential model, which linearly stacks numerous network layers, is the simplest model. It permits the development of arbitrary neural network diagrams for more complicated structures.
|
Figure 15. Accuracy and loss for personal Neural Network. |
From the result in figure 15, the accuracy in this neural network constructed by Keras is around 0.80.
4. Results and Comparison
This section will compare the value of accuracy in each machine learning model which was mentioned before:
Table 2. Comparison of accuracy.
KNN | RF | DT | LR | SVM | NN | |
Accuracy | 0.81 | 0.90 | 0.86 | 0.80 | 0.80 | 0.80 |
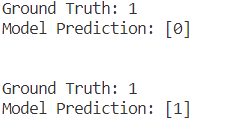
From the results, the model of Random Forest has the highest value in accuracy which is 0.90. In this case, this experiment will use RF to predict the hotel booking status, figure 16 is some instances (0 means not cancel, 1 means cancel).
|
Figure 16. Comparison between the real situation and the predicted value. |
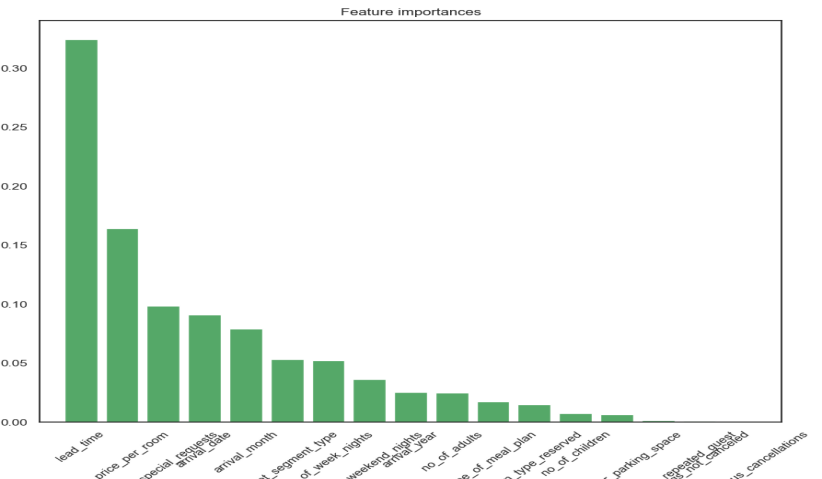
As showing in figure 17, In order to strengthen the reference of prediction, the importance of each feature has been given, among which “lead_time” and “average_price” are the two most important features, which are corresponding to the scatter plot of “lead_time” and “average_price” analyzed in the second part. As a result, some hotels can pay more attention to these two indicators to improve the accuracy of the forecast.
|
Figure 17. The importance of each feature. |
Compared to other algorithms, random forest performs well. Without feature selection, it can handle very high-dimensional data. Following training, random forest traits matter. Features influence each other during training. RF can balance mistakes in uneven datasets and classification imbalances. With RF algorithm, accuracy can be maintained even if a major part of the feature is missing.
5. Conclusion
This study examined a dataset of hotel reservations, and then utilized machine learning models to train the data and conduct a comparison, selecting Random Forest (RF) as the best successful model for predicting whether the customer will continue to take the room or cancel it, in order to assist hotels in achieving effective booking outcomes and in preparing for backup decisions, particularly during busy travel periods.
As shown in Section 4, there are still some prediction errors for future work. Therefore, this research will continue to learn more models and improve the neural network that was designed by hand, and then apply them to this type of dataset for training, in order to optimize the prediction results, allowing the hotel to process reservations with greater flexibility.
References
[1]. Lv, X. (2021) ‘Design and Implementation of Hotel Reservation Management Platform Based on SOA Framework’, 2021 International Conference on Intelligent Transportation, Big Data & Smart City (ICITBS), Intelligent Transportation, Big Data & Smart City (ICITBS), 2021 International Conference on, ICITBS, pp. 517–520.
[2]. Lv, X. (2021) ‘Analysis and Optimization Strategy of Travel Hotel Website Reservation Behavior Based on Collaborative Filtering’, 2021 International Conference on Intelligent Transportation, Big Data & Smart City (ICITBS), Intelligent Transportation, Big Data & Smart City (ICITBS), 2021 International Conference on, ICITBS, pp. 362–365.
[3]. A. Kanan and A. Taha, "Cloud-Based Reconfigurable Hardware Accelerator for the KNN Classification Algorithm," 2022 14th International Conference on Computational Intelligence and Communication Networks (CICN), Al-Khobar, Saudi Arabia, 2022, pp. 308-312, doi: 10.1109/CICN56167.2022.10008343.
[4]. R. Cheng et al., "Single-Ended Readout Depth-of-Interaction Measurements Based on Random Forest Algorithm," in IEEE Transactions on Radiation and Plasma Medical Sciences, vol. 7, no. 2, pp. 105-112, Feb. 2023, doi: 10.1109/TRPMS.2022.3218401.
[5]. L. L. Custode and G. Iacca, "Evolutionary Learning of Interpretable Decision Trees," in IEEE Access, vol. 11, pp. 6169-6184, 2023, doi: 10.1109/ACCESS.2023.3236260.
[6]. Hoang, V. and Watson, J. (2022) ‘Teaching binary logistic regression modeling in an introductory business analytics course’, Decision Sciences Journal of Innovative Education, 20(4), pp. 201–211.
[7]. Sandeep, C.V. and Devi, T. (2022) ‘Classification and Estimation of High-Risk Factors to Low-Risk Factors in Approving Loan through Creditworthiness of Bank Customers using SVM Algorithm and Analyze its Performance over Logistic Regression in terms of Accuracy’, Journal of Pharmaceutical Negative Results, 13, pp. 1756–1763. doi:10.47750/pnr.2022.13.S04.212.
[8]. Haghighat, E. and Juanes, R. (2021) ‘SciANN: A Keras/TensorFlow wrapper for scientific computations and physics-informed deep learning using artificial neural networks’, Computer Methods in Applied Mechanics and Engineering, 373.
Cite this article
Tang,Z. (2023). Prediction of the Status of the Hotel Reservations. Applied and Computational Engineering,8,734-743.
Data availability
The datasets used and/or analyzed during the current study will be available from the authors upon reasonable request.
Disclaimer/Publisher's Note
The statements, opinions and data contained in all publications are solely those of the individual author(s) and contributor(s) and not of EWA Publishing and/or the editor(s). EWA Publishing and/or the editor(s) disclaim responsibility for any injury to people or property resulting from any ideas, methods, instructions or products referred to in the content.
About volume
Volume title: Proceedings of the 2023 International Conference on Software Engineering and Machine Learning
© 2024 by the author(s). Licensee EWA Publishing, Oxford, UK. This article is an open access article distributed under the terms and
conditions of the Creative Commons Attribution (CC BY) license. Authors who
publish this series agree to the following terms:
1. Authors retain copyright and grant the series right of first publication with the work simultaneously licensed under a Creative Commons
Attribution License that allows others to share the work with an acknowledgment of the work's authorship and initial publication in this
series.
2. Authors are able to enter into separate, additional contractual arrangements for the non-exclusive distribution of the series's published
version of the work (e.g., post it to an institutional repository or publish it in a book), with an acknowledgment of its initial
publication in this series.
3. Authors are permitted and encouraged to post their work online (e.g., in institutional repositories or on their website) prior to and
during the submission process, as it can lead to productive exchanges, as well as earlier and greater citation of published work (See
Open access policy for details).
References
[1]. Lv, X. (2021) ‘Design and Implementation of Hotel Reservation Management Platform Based on SOA Framework’, 2021 International Conference on Intelligent Transportation, Big Data & Smart City (ICITBS), Intelligent Transportation, Big Data & Smart City (ICITBS), 2021 International Conference on, ICITBS, pp. 517–520.
[2]. Lv, X. (2021) ‘Analysis and Optimization Strategy of Travel Hotel Website Reservation Behavior Based on Collaborative Filtering’, 2021 International Conference on Intelligent Transportation, Big Data & Smart City (ICITBS), Intelligent Transportation, Big Data & Smart City (ICITBS), 2021 International Conference on, ICITBS, pp. 362–365.
[3]. A. Kanan and A. Taha, "Cloud-Based Reconfigurable Hardware Accelerator for the KNN Classification Algorithm," 2022 14th International Conference on Computational Intelligence and Communication Networks (CICN), Al-Khobar, Saudi Arabia, 2022, pp. 308-312, doi: 10.1109/CICN56167.2022.10008343.
[4]. R. Cheng et al., "Single-Ended Readout Depth-of-Interaction Measurements Based on Random Forest Algorithm," in IEEE Transactions on Radiation and Plasma Medical Sciences, vol. 7, no. 2, pp. 105-112, Feb. 2023, doi: 10.1109/TRPMS.2022.3218401.
[5]. L. L. Custode and G. Iacca, "Evolutionary Learning of Interpretable Decision Trees," in IEEE Access, vol. 11, pp. 6169-6184, 2023, doi: 10.1109/ACCESS.2023.3236260.
[6]. Hoang, V. and Watson, J. (2022) ‘Teaching binary logistic regression modeling in an introductory business analytics course’, Decision Sciences Journal of Innovative Education, 20(4), pp. 201–211.
[7]. Sandeep, C.V. and Devi, T. (2022) ‘Classification and Estimation of High-Risk Factors to Low-Risk Factors in Approving Loan through Creditworthiness of Bank Customers using SVM Algorithm and Analyze its Performance over Logistic Regression in terms of Accuracy’, Journal of Pharmaceutical Negative Results, 13, pp. 1756–1763. doi:10.47750/pnr.2022.13.S04.212.
[8]. Haghighat, E. and Juanes, R. (2021) ‘SciANN: A Keras/TensorFlow wrapper for scientific computations and physics-informed deep learning using artificial neural networks’, Computer Methods in Applied Mechanics and Engineering, 373.


