


1. Introduction
With the rapid development of the global economy and the gradual increase in regional economic disparities, accurately predicting local economic development has become a crucial issue in policy making and business decision-making. As a key indicator for measuring a region’s economic activities, GDP has a significant impact on the economic policies and investment decisions of local governments [1-2]. The development of data science has made it possible to predict GDP accurately. It can transform abstract, high-dimensional economic data into intuitive graphics and images, helping researchers to understand economic development trends, discover abnormal fluctuations, and provide crucial prior knowledge for the selection and construction of model features [3].
Traditional economic forecasting methods includes time series models, gray prediction, and Back Propagation Neural Networks (BP neural networks) and naive Bayesian models [4]. Among them, the combination of linear regression (LR) and random forest (RF) models has gradually been introduced into the field of economic forecasting due to its strong interpretability and wide applicability. However, existing studies often separate model construction from data visualization, or only focus on the performance optimization of a single model, lacking a complete analytical framework from “visual exploration” to “model construction” to “result interpretation”.
Therefore, this study will analyze the annual data of three representative prefecture-level cities in Jiangsu Province, namely, Southern Jiangsu, Central Jiangsu, and Northern Jiangsu. Based on the GDP of prefecture-level cities in Jiangsu Province, the performance and accuracy of multiple linear regression (MLR) and RF forecasting models are constructed. This study provides a new perspective and more accurate tools for regional economic forecasting.
2. Literature review
2.1. Application of data visualization in economic analysis
Data visualization is a process of converting abstract and complex economic data into intuitive graphics and images. As a powerful analytical tool and communication language, its role is mainly reflected in the following two aspects.
First, exploratory data analysis and pattern recognition. Since economic data usually has the characteristics of high dimension, large volume, and dynamic change. Data visualization can help economists quickly identify the correlations and nonlinear relationships between variables through advanced graphics. This provides directional guidance for subsequent model construction and hypothesis testing [5]. For example, by drawing dynamic scatter plots of GDP per capita and Gini coefficient of different countries over many years, researchers can intuitively explore the possible Kuznets curve relationship between economic development and income inequality [6]. Ma and other scholars analyzed the factors affecting exchange rates based on the XGBoost model. The results showed that the combined model significantly enhanced its traditional single prediction effect [7].
Second, enhance the communication and understanding of complex economic concepts. Economic research often involves complex macro systems (such as international trade networks) and micro behaviors (such as consumer choice models). Static regression coefficients and statistics are often obscure and difficult for non-professional audiences or policymakers to understand. However, visualization forms such as infographics, flow diagrams, and tree diagrams can present complex causal chains, system structures, and dynamic processes clearly and understandably, greatly reducing the cognitive threshold and improving the influence and dissemination efficiency of research results. For example, during the Black Friday holiday, major e-commerce companies can use intuitive data charts to adjust their marketing strategies in a timely and effective manner [8].
2.2. Typical applications of linear regression in data analysis
Linear regression is a parametric model that establishes a linear relationship between a dependent variable and one or more independent variables by minimizing the sum of squared errors. This model has the advantages of strong explanatory power and high computational efficiency, but it has a weak ability to capture nonlinear relationships and is sensitive to multicollinearity. For example, some scholars have conducted analyses on macroeconomic influencing factors. Guan selected Henan Province as the analysis object and used multiple linear regression to analyze the impact of the output value of the three major industries on GDP [9]. The results showed that the model fit was as high as 0.999, which significantly proved that the three major industries are the core factors driving economic growth and demonstrated the effectiveness of linear regression in macroeconomic analysis.
Financial time series prediction is also widely used. Wang used seven market indicators, such as opening prices, to construct a multiple linear regression prediction model for the next day’s closing price of the Shanghai and Shenzhen 300 Index. The model R2 reached 0.989, verifying the practical value of the model in capturing the linear laws of historical information [10].
2.3. Random forest in data analysis
RF, as an ensemble learning algorithm, improves model accuracy and generalization ability by constructing multiple decision trees and integrating their outputs (average for regression and mode for classification). Its core mechanism is Bootstrap sampling and random feature selection. The model can automatically handle nonlinear relationships and feature interactions, and is insensitive to outliers and collinearity, but has poor interpretability and is considered a Black Box model. For example, Xie et al. applied random forest regression to the spatialization of Lanzhou’s GDP. The study integrated multi-source geographic features such as Luojia No. 1 night light data and road network density. The model's determination coefficient R2 reached 0.85, which was significantly better than MLR, demonstrating the excellent performance of RF in processing high-dimensional, complex nonlinear spatial data [11]. Zhao et al. used the RF algorithm to construct a leading index system for multiple macroeconomic indicators in China, thereby automatically screening important predictive indicators (such as industrial added value) and successfully capturing the changing trends of variables such as GDP and PPI, demonstrating its powerful ability to explore nonlinear relationships in complex economic systems [12]. Based on a heart disease dataset, Zhao et al. used K-nearest neighbor (KNN) to pre-process missing values and then established a random forest classification model. The final accuracy rate reached 83.2%, highlighting its application potential in classification prediction in the medical and health field [13].
Traditional forecasting methods such as the ARIMA model are good at dealing with short-term linear dependencies in a single time series, butstruggle to incorporate external variables. The VAR model can capture the dynamic linkage between multiple variables, but its linear assumptions and parameter inflation problems have obvious limitations in complex economic forecasting. LR is known for its transparency and interpretability [14].
At the same time, RF stands out for its strong prediction accuracy and ability to handle complex data relationships, and is expected to overcome the limitations of traditional time series methods in linear assumptions. Existing research primarily focuses on enhancing the model algorithm and improving prediction accuracy, often raising concerns about the Black Box concerns, nature of the decision-making process which lacks transparency and make it challenging to intuitively convey the complex internal relationships between key economic variables and GDP to decision-makers. In addition, the ability to predict macroeconomic data is still lacking, and its analytical depth and practicality are therefore limited. This study will aims to optimize the above problems.
3. Methodology
3.1. Dataset
3.1.1. Sample selection and regional division
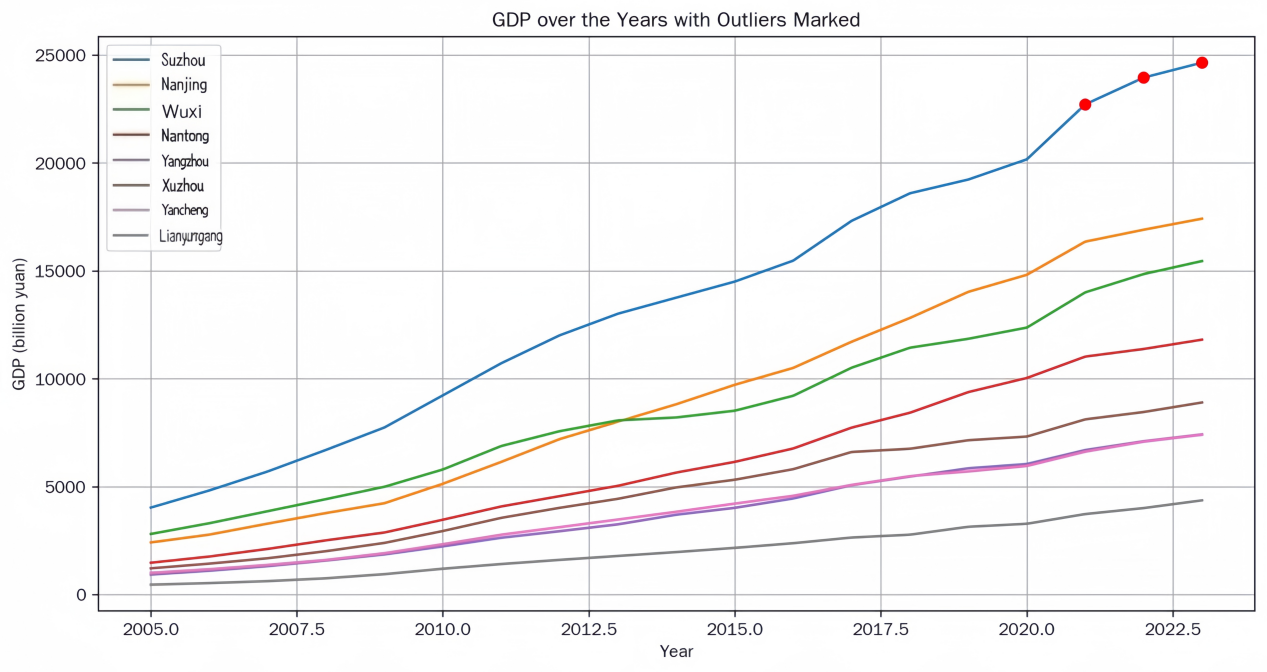
The data selection was the GDP statistics of various cities in Jiangsu Province from 2005 to 2023. Data sources include official statistical yearbooks of Jiangsu Province, Statistical Communique on National Economic and Social Development. Secondly, to avoid excessive complexity of the model due to too large a sample size, this study selected eight cities, namely Suzhou, Nanjing, Wuxi, Nantong, Yangzhou, Xuzhou, Yancheng, and Lianyungang, from the three major regions of southern Jiangsu, central Jiangsu, and northern Jiangsu, as the core research samples.The selected cities cover multiple economic driving models (e.g., export-oriented economy in Suzhou, sci-tech innovation in Nanjing, coastal logistics in Lianyungang), enabling the model to capture diverse economic growth drivers and their GDP accounted for over 75% of Jiangsu’s provincial GDP,.
3.2. Model design
Two machine learning algorithms were empoyed to construct a GDP prediction model. The core principles are as follows:
3.2.1. Random forest model
Based on the bagging ensemble framework, the model process is optimized for the continuous output characteristics of GDP forecasts.
Sample selection: The training set has a size of N=144. Via Bootstrap sampling, K=100 sample subsets of size M=0.8 N are drawn with replacement (implemented via bootstrap sampling).
Tree structure generation: The growth of each decision tree {h(x, γ_k)} is controlled by a random vector γ_k.
Ensemble rule: In the tprediction phase, the average of the GDP predictionfrom 100 trees is used as the final output, improving generalization ability by reducing the variance of individual trees.
Decision Tree Construction: The growth of each decision tree {h(x, γₖ)} (k=1,2,…,100) is controlled by a random vector γₖ, which determines key parameters such as the number of randomly selected features per node (mtry=5, optimized via 5-fold cross-validation) and the maximum tree depth (set to 8 to avoid overfitting). Here, h denotes a base decision tree, and x represents the input feature vector (e.g., fixed asset investment, total retail sales of consumer goods).
As an ensemble algorithm based on the bagging framework, RF effectively mitigates overfitting by reducing model variance. Each tree is independently trained based on samples generated through autonomous sampling, resulting in relatively consistent distributions and low error correlation across trees (achieved via random feature selection). Classification performance depends both on the discriminative power of individual trees and on the correlation between them.
3.2.2. Multiple linear regression model formulation
To address the collinearity issue common in macroeconomic variables, a collinearity test is added to the basic linear model framework.
The MLR model is typically used to describe the linear correlation between the dependent variable y
The model format is expressed:
The dependent variable y : The annual GDP of a prefecture-level city.
x₁, x₂, …, xₚ: The independent variables that influence GDP, such as fixed asset investment (10,000 yuan), total retail sales of consumer goods (1 billion yuan), year-end permanent population (10,000 people), local fiscal revenue (100 million yuan), value added of the secondary industry (100 million yuan), value added of the tertiary industry (100 million yuan), value added of the primary industry (100 million yuan), city CPI, and total patent applications.
β₀: Intercept term, representing the baseline level of GDP when all independent variables are equal to 0.
ε: Random error term, representing random factors not explained by the model.
4. Experiment
4.1. Experimental procedure
Data Preprocessing: The raw data were cleaned to obtain 2,584 valid data sets. 152 valid cities were obtained (GDP per city as the dependent variable, and the remaining 16 economic indicators as independent variables). The time series segmentation method is used to divide the training set and test set: 144 observation samples from 2005 to 2022 used as the training set, and 8 observation samples (8×1) from 2023 (1 year) are used as the test set.
Data Visualization: Python was used to plot a time series line chart of GDP for the eight cities from 2005 to 2023. GDP forecasts for 2024-2025 were then generated based on trend fitting.
4.2. Correlation analysis
To examine the strength of correlation between each variable and GDP and to address multicollinearity, this study first conducted a Pearson correlation analysis on all variables.
The results showed that year showed significant positive correlations with most economic indicators, including GDP (r=0.631, p<0.001) and fixed asset investment (r=0.770, p<0.001), indicating a clear growth trend in economic activity in Jiangsu Province over time.
Meanwhile, regional variables showed significant negative correlations with most economic indicators (such as GDP and local fiscal revenue), reflecting significant differences in economic development levels among prefecture-level cities within Jiangsu Province.
GDP, as the core dependent variable, exhibited strong positive correlations with total retail sales of consumer goods (r=0.949, p<0.001), local fiscal revenue (r=0.970, p<0.001), and total patent applications (r=0.947, p<0.001), highlighting the key driving role of consumption, fiscal strength, and scientific and technological innovation capabilities in economic output. The correlation between the urban CPI and most variables is weak and insignificant (for example, with the year-end permanent population, r=-0.012, p=0.879), indicating that price levels are not the primary factor influencing GDP and other macroeconomic indicators in this study sample.
This correlation analysis provides a basis for feature selection in subsequent models, ensuring that the variables entered into the model have a statistically significant correlation with the target (GDP).
4.3. Results
This study uses two machine learning algorithms, multivariate linear regression and random forest, respectively, and uses historical data of prefecture-level cities in Jiangsu Province as training sets to construct a GDP prediction model. 1. MLR Model
Regression analysis using SPSS software yielded the following prediction equation:
GDP (100 million yuan) = -GDP (100 million yuan) = -122201.276 + 61.141 × Year + 4.637E-5 × Fixed Asset Investment (10,000 yuan) - 0.945 × Total Retail Sales of Consumer Goods (100 million yuan) + 0.600 × Year-End Permanent Population (10,000 people) + 0.059 × Local Fiscal Revenue (100 million yuan) - 3.636 × City CPI - 0.006 × Patent Applications/Utility Models - 0.015 × Patent Applications/Invention Patents + 0.026 × Patent Grants/Utility Models + 0.012 × Total Patent Grants
Using this model, the 2023 GDP of Jiangsu Province (sum of the forecast values for all prefecture-level cities) is projected to be 2,181.865 billion yuan. Model regression coefficients and significance results. The regression analysis results (shown in the table) indicate that, among the selected independent variables, year, fixed asset investment, and local fiscal revenue have a significant positive impact on the dependent variable, GDP. Specifically, the unstandardized coefficient for year is 61.141 (p=0.044), the coefficient for fixed asset investment is 4.637E-5 (p<0.001), and the coefficient for local fiscal revenue is 0.059 (p<0.001). The remaining variables—including total retail sales of consumer goods, year-end permanent population, urban CPI, and various patent applications and authorizations—all failed to pass significance tests (p>0.05). Furthermore, based on tolerance and variance inflation factors (VIFs), some variables, such as total retail sales of consumer goods (VIF=27.447), local fiscal revenue (VIF=28.041), and several patent indicators (all VIFs greater than 100), exhibit strong multicollinearity.
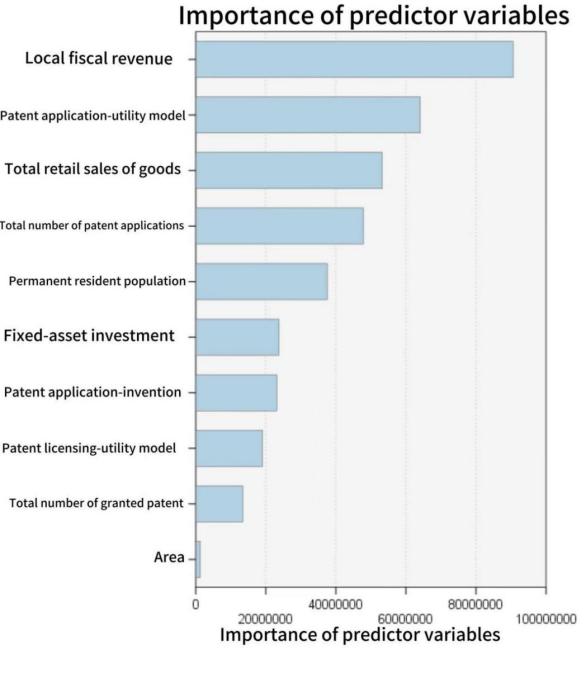
Using SPSS Modeller to construct a random forest model, the predicted GDP for Jiangsu Province in 2023 is 1,698.971 billion yuan. The importance ranking of the model variables is shown in the figure.
4.4. Result
|
Model |
Predicted Value |
True Value (8 cities combined) |
Absolute Error |
Relative Error (%) |
|
MLR |
86329.298 |
97436.08 |
11107.502 |
11.40 |
|
RF |
71354.076 |
97436.08 |
26082.004 |
26.77 |
Unit :100 million yuan
According to Table 2, a comparison of the forecast errors of the two models shows that the predictions of the MLR model are closer to the actual level of Jiangsu Province’s GDP in 2023, with smaller absolute and relative errors, indicating that this model has higher accuracy in the forecasting scenario of this study. This demonstrates that the multiple linear regression model better captures the linear global trend between macroeconomic variables and GDP, while the random forest model may be more adept at handling local and nonlinear characteristics.
5. Discussion
5.1. Summary
The study compared the MLR and RF models for GDP forecasting of typical cities in Jiangsu Province. The results showed that the MLR model significantly outperformed the RF model in terms of forecast accuracy, with a higher performance in this case. This difference stems primarily from the MLR’s “linear relationship assumption”, which matches the strong linear correlations in the data presented in this study. However, RF’s advantages are limited in datasets dominated by linear trends, and its complex integrated structure is susceptible to data noise, which in turn reduces forecast accuracy. This comparison of the two models provides valuable insights for regional economic forecasting. MLR is more efficient when linear correlations are clear in the data; however, RF’s advantages are more readily apparent when complex nonlinear relationships exist.
5.2. Limitations
This study still has the following limitations. First, the core assumption of the MLR model is the existence of linear relationships between variables. Therefore, it is very effective in capturing and fitting strong global linear trends. While RF can model nonlinear relationships, its advantages may not be fully realized in datasets dominated by linear relationships. The complex tree structure may even introduce unnecessary variance, leading to forecast bias.
As a high-performance ensemble algorithm, random forests are sensitive to noise and local fluctuations in the data. The time series panel data used in this study may contain unique fluctuations in certain years or regions. RF may over-learn these short-term fluctuations or noise, leading to overfitting in forecasts. This is when the model performs well on the training set but exhibits significant deviations when generalizing to the forecast year. In contrast, the MLR model has a relatively simple structure, provides a smoother global fit, and exhibits greater robustness in forecasting macro trends.
6. Conclusion
This study, focusing on forecasting Jiangsu Province’s GDP, systematically compared and analyzed the performance of two forecasting models: MLR and RF. Modelling panel data from prefecture-level cities in Jiangsu Province from 2005 to 2022 and forecasting the total economic output for 2023 revealed a highly significant linear positive correlation between Jiangsu Province’s GDP and indicators such as local fiscal revenue and total retail sales of consumer goods. This finding provides a solid theoretical basis for the use of linear models for forecasting. Furthermore, the study found that the MLR model’s forecast accuracy was superior to that of the RF model, being closer to the true value. This is primarily due to the strong global linear trend between Jiangsu Province’s macroeconomic variables and GDP, which the MLR model effectively captures. However, the RF model, perhaps overly sensitive to noise and volatility in historical data, exhibits significant bias in its extrapolated forecasts.Future directions could use multiple models for comparison.
References
[1]. Guo, H., Suo, L., & Yang, F. (2024). Analyzing the industry influencing factors of China’s GDP based on a graph model. Commercial Observation, 10(23), 29–33.
[2]. Cohen Kaminitz, S. (2023). The significance of GDP: a new take on a century-old question. Journal of Economic Methodology, 30(1), 1–14. https: //doi.org/10.1080/1350178X.2023.2167228
[3]. Li, W. (2022). Between language and image: Research on the communication effects of data visualization based on dual coding theory [Master’s thesis, South China University of Technology]. https: //doi.org/10.27151/d.cnki.ghnlu.2022.004637
[4]. Ma, J., Li, S., & Xia, M. (2022). A review of the application of machine learning in GDP prediction. Technology Intelligence Research, 4(3), 73–94. https: //doi.org/10.19809/j.cnki.kjqbyj.2022.03.008
[5]. Liu, B., Liu, Z., Liu, Y., et al. (2021). A review of data visualization research. Journal of Hebei University of Science and Technology, 42(6), 643–654.
[6]. Artekin, A. Ö., & Kalayci, S. (2024). Comparative analysis of Gini coefficient, GDP, energy consumption, and transportation modes on CO2 using NARDL (Nonlinear Distributed Lag Autoregressive Model) for the USA. Sustainability, 16(20), 9030. https: //doi.org/10.3390/su16209030
[7]. Ma, W. (2022). An empirical study on RMB exchange rate forecasting based on a combined model. https: //doi.org/10.27835/d.cnki.gnjsj.2022.000389
[8]. Guan, M. (2025). Analysis of the application of corporate financial data visualization in the context of big data. China Market, (19), 147–150. https: //doi.org/10.13939/j.cnki.zgsc.2025.19.037
[9]. Guan, Y. (2021). Factors influencing Henan Province’s GDP based on multiple linear regression. Rural Economy and Technology, 32(5), 221–224.
[10]. Wang, P. (2020). Stock price analysis and prediction based on multiple linear regression. Technology and Economic Market, (1), 84–85.
[11]. Xie, F., Sun, J., Yu, M., Lv, J., & Ma, H. (2022). Spatialization of GDP in Lanzhou City based on Luojia-1 and random forest. Remote Sensing Information, 37(2), 53–59.
[12]. Zhao, Y., Lou, F., & Cheng, Y. (2024). Construction of a macroeconomic leading indicator system based on random forest algorithm. Survey World, (4), 3–15. https: //doi.org/10.13778/j.cnki.11-3705/c.2024.04.001
[13]. Zhao, J., Li, Y., Wang, D., & Zhang, J.(2021). Heart disease prediction algorithm based on optimized random forest. Journal of Qingdao University of Science and Technology (Natural Science Edition), 42(2), 112–118. https: //doi.org/10.16351/j.1672-6987.2021.02.016
[14]. James, G., Witten, D., Hastie, T., Tibshirani, R., & Taylor, J. (2023). Linear regression. In An introduction to statistical learning. Springer Texts in Statistics. Springer, Cham. https: //doi.org/10.1007/978-3-031-38747-0_3
Cite this article
Huang,C. (2025). GDP Forecasting for Representative Cities in Jiangsu Province: A Comparative Study of Multiple Linear Regression and Random Forest. Applied and Computational Engineering,202,56-64.
Data availability
The datasets used and/or analyzed during the current study will be available from the authors upon reasonable request.
Disclaimer/Publisher's Note
The statements, opinions and data contained in all publications are solely those of the individual author(s) and contributor(s) and not of EWA Publishing and/or the editor(s). EWA Publishing and/or the editor(s) disclaim responsibility for any injury to people or property resulting from any ideas, methods, instructions or products referred to in the content.
About volume
Volume title: Proceedings of CONF-MLA 2025 Symposium: Intelligent Systems and Automation: AI Models, IoT, and Robotic Algorithms
© 2024 by the author(s). Licensee EWA Publishing, Oxford, UK. This article is an open access article distributed under the terms and
conditions of the Creative Commons Attribution (CC BY) license. Authors who
publish this series agree to the following terms:
1. Authors retain copyright and grant the series right of first publication with the work simultaneously licensed under a Creative Commons
Attribution License that allows others to share the work with an acknowledgment of the work's authorship and initial publication in this
series.
2. Authors are able to enter into separate, additional contractual arrangements for the non-exclusive distribution of the series's published
version of the work (e.g., post it to an institutional repository or publish it in a book), with an acknowledgment of its initial
publication in this series.
3. Authors are permitted and encouraged to post their work online (e.g., in institutional repositories or on their website) prior to and
during the submission process, as it can lead to productive exchanges, as well as earlier and greater citation of published work (See
Open access policy for details).
References
[1]. Guo, H., Suo, L., & Yang, F. (2024). Analyzing the industry influencing factors of China’s GDP based on a graph model. Commercial Observation, 10(23), 29–33.
[2]. Cohen Kaminitz, S. (2023). The significance of GDP: a new take on a century-old question. Journal of Economic Methodology, 30(1), 1–14. https: //doi.org/10.1080/1350178X.2023.2167228
[3]. Li, W. (2022). Between language and image: Research on the communication effects of data visualization based on dual coding theory [Master’s thesis, South China University of Technology]. https: //doi.org/10.27151/d.cnki.ghnlu.2022.004637
[4]. Ma, J., Li, S., & Xia, M. (2022). A review of the application of machine learning in GDP prediction. Technology Intelligence Research, 4(3), 73–94. https: //doi.org/10.19809/j.cnki.kjqbyj.2022.03.008
[5]. Liu, B., Liu, Z., Liu, Y., et al. (2021). A review of data visualization research. Journal of Hebei University of Science and Technology, 42(6), 643–654.
[6]. Artekin, A. Ö., & Kalayci, S. (2024). Comparative analysis of Gini coefficient, GDP, energy consumption, and transportation modes on CO2 using NARDL (Nonlinear Distributed Lag Autoregressive Model) for the USA. Sustainability, 16(20), 9030. https: //doi.org/10.3390/su16209030
[7]. Ma, W. (2022). An empirical study on RMB exchange rate forecasting based on a combined model. https: //doi.org/10.27835/d.cnki.gnjsj.2022.000389
[8]. Guan, M. (2025). Analysis of the application of corporate financial data visualization in the context of big data. China Market, (19), 147–150. https: //doi.org/10.13939/j.cnki.zgsc.2025.19.037
[9]. Guan, Y. (2021). Factors influencing Henan Province’s GDP based on multiple linear regression. Rural Economy and Technology, 32(5), 221–224.
[10]. Wang, P. (2020). Stock price analysis and prediction based on multiple linear regression. Technology and Economic Market, (1), 84–85.
[11]. Xie, F., Sun, J., Yu, M., Lv, J., & Ma, H. (2022). Spatialization of GDP in Lanzhou City based on Luojia-1 and random forest. Remote Sensing Information, 37(2), 53–59.
[12]. Zhao, Y., Lou, F., & Cheng, Y. (2024). Construction of a macroeconomic leading indicator system based on random forest algorithm. Survey World, (4), 3–15. https: //doi.org/10.13778/j.cnki.11-3705/c.2024.04.001
[13]. Zhao, J., Li, Y., Wang, D., & Zhang, J.(2021). Heart disease prediction algorithm based on optimized random forest. Journal of Qingdao University of Science and Technology (Natural Science Edition), 42(2), 112–118. https: //doi.org/10.16351/j.1672-6987.2021.02.016
[14]. James, G., Witten, D., Hastie, T., Tibshirani, R., & Taylor, J. (2023). Linear regression. In An introduction to statistical learning. Springer Texts in Statistics. Springer, Cham. https: //doi.org/10.1007/978-3-031-38747-0_3