


1. Introduction
The proliferation of portable electronics and energy-constrained embedded systems has positioned low-power design as a fundamental challenge in modern digital circuit research. As a fundamental signal processing operation, digital filtering constitutes a critical component in communication systems and biomedical signal processing [1]. Finite impulse response filter is a type of filter whose impulse response is finite. For any finite length input, the response will converge to zero within a finite time [2]. FIR filters offer distinct advantages including: (1) guaranteed stability due to non-recursive structure, (2) exact linear phase response, and (3) deterministic transient behavior [3]. In high level design, the hardware implementation will consume a significant amount of power. High arithmetic complexity increase the number of switching operations in the data transmission, leading to elevated dynamic power consumption.
In recent years, various approaches have been proposed to reduce FIR filter power consumption, including five modular redundancy and parallel adding methods [4], improving Booth multiplier [5]. However, some methods compromise filter performance.
This work presents a MATLAB-based optimization framework employing: (1) filter order minimization, (2) coefficient wordlength reduction, and (3) optimal coefficient selection through convex optimization. Based on the MATLAB signal processing and optimization toolbox, the framework allows simultaneous consideration of multiple objectives, including power, ripple and attenuation specification. The results of the comparative experiment show that this method achieves significant power consumption reduction while maintaining the fidelity of the signal.
2. Methodology
2.1. Initial FIR filter design
The baseline finite impulse response (FIR) filter was designed using the window method with a Hamming window, a widely adopted technique in digital signal processing due to its balance between main lobe width and side lobe attenuation [6]. The Hamming window was defined by the following equation:
where
where
The Hamming window was selected for the baseline FIR filter design because it offers a favorable balance between main lobe width and side lobe attenuation, achieving approximately 53 dB suppression of unwanted frequencies while maintaining a relatively narrow transition band [7]. Compared to other windows such as the rectangular or Hanning windows, the Hamming window offers better side lobe suppression, and compared to the Blackman window, it retains a narrower main lobe for improved frequency resolution.
The filter was configured as a low-pass FIR with Type-Ⅰ linear phase, meaning its impulse response is symmetric and has an odd number of taps, ensuring constant group delay across frequencies. The filter order was set to N = 50, corresponding to 51 taps, which guarantees ensure symmetric coefficients for phase linearity. The passband edge frequency was set to 100 Hz, the stopband start frequency to 120 Hz, and the sampling frequency to 1000 Hz. The filter coefficients were obtained by multiplying the ideal low-pass sinc function with the Hamming window, ensuring that all subsequent optimization could be directly evaluated against this reference design under the same specifications.
2.2. Optimized FIR filter design
The optimized finite impulse response (FIR) filter was developed based on the benchmark design, aiming to reduce the hardware power consumption without significantly compromising the signal quality. In the hardware implementation, the number of non-zero coefficients and their bit width will directly affect the number of multiplications, additions and switching operations, which are the main sources of dynamic energy consumption in digital circuits. The optimization strategy followed three main steps: reducing the number of filter taps, using shorter coefficient bit widths and applying coefficient optimization. These steps were executed under identical design specifications as the baseline filter to ensure performance differences resulted exclusively from the optimization process.
The baseline filter of order
In the baseline design, the coefficients were represented with 16-bit precision. Although this provides high accuracy, it increases the number of bit conversions during each multiplication, thereby increasing the dynamic power consumption. In the optimized design, the bit width was reduced to 10 bits, thereby reducing the number of switched bits in each operation. This allows for simpler multiplier hardware. And in some designs, it may be possible to implement shift-add without using multipliers.
After sparsification and reduction of bit width, the weighted least squares method is used to recalculate the remaining non-zero coefficients in the frequency domain to maintain the required amplitude response of the filter. Let
Where
2.3. Power estimation model
The relative power consumption of the baseline and optimized filters was defined by:
where S is the number of non-zero taps, B is the bit width. And
3. Experimental setup
3.1. Test signal generation
A composite test signal was generated to include both passband and stopband components, making it suitable for evaluating filter performance. The signal was:
where the 50 Hz tone lies within the filter passband and should be preserved, the 200 Hz tone lies in the stopband and should be attenuated. And n(t) is additive white Gaussian noise simulating real world conditions. The sampling frequency was set to
3.2. Filter implementation
Both the baseline and optimized FIR filters were implemented in MATLAB using the filter function. The baseline filter was a 51 tap Hamming window FIR filter, while the optimized filter applied the three steps low power strategy described in section 1.2. All the design parameters of the two filters, such as the filter order, the passband edge frequency, the stopband starting frequency and the sampling rate, remain the same to isolate the influence of the optimization strategy.
3.3. Performance evaluation metrics
In order to conduct a comprehensive comparison of these two filters, this paper employs four type of indications. The four indicators are frequency spectrum, magnitude response, time domain waveform and power estimation.
The spectral characteristics of the input and output signals were analyzed through Fast Fourier Transform (FFT) to quantify their frequency-domain distributions. This indicator is helpful in determining whether the filter can correctly pass the required frequency components while suppressing the unwanted ones.
The frequency response characteristics, evaluated through MATLAB’s freqz function, quantify the filter’s magnitude gain across the frequency spectrum. Critical performance metrics such as passband ripple and stopband attenuation provide a standardized basis for comparative analysis between the baseline and optimized filter designs in the frequency domain.
The time domain output signal is plotted together with the original signal to visually assess the extent to which the filter preserves the desired signal shape and reduces noise. This metrics is particularly useful for evaluating signal distortion and transient response.
The relative hardware power consumption of the two filters was calculated using the power estimation model described in section 1.3 The power estimation quantifies the expected reduction in dynamic power based on the number of non-zero taps (S) and coefficient bit width (B), optimizing the efficiency from the perspective of hardware orientation.
The integration of these four metrics enables a holistic evaluation of both filtering performance and hardware efficiency, facilitating an optimal trade-off between signal processing capability and power consumption in the final design.
4. Results and comparison
4.1. Frequency spectrum comparison
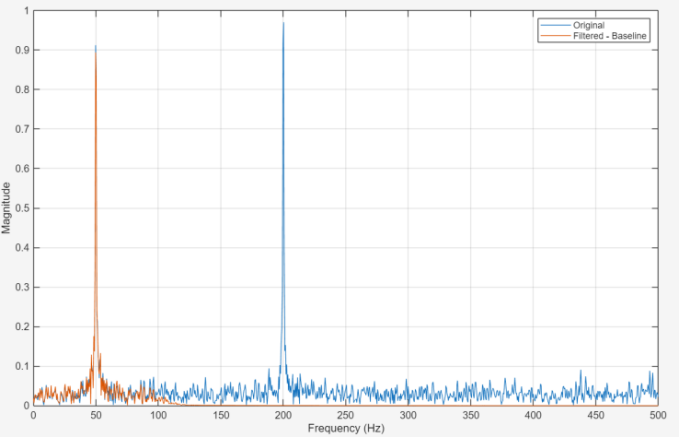
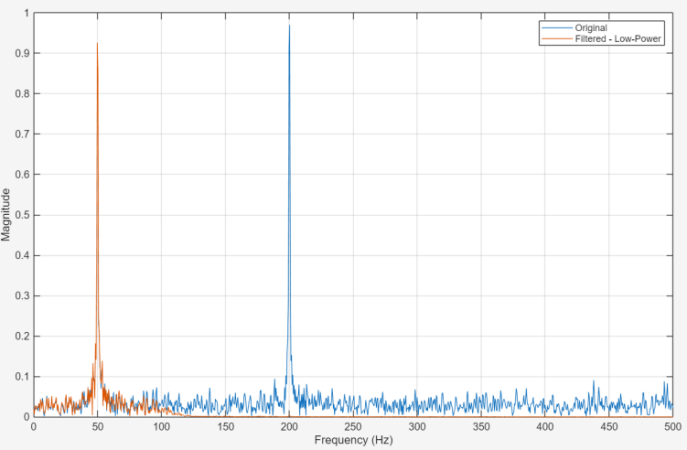
Figures 1 and 2 show that the frequency spectrum of the original noisy signal and the filtered outputs for the baseline FIR filter and the low power optimized FIR filter. As demonstrated in Figure 1, the unwanted high frequency components above the 100 Hz cut-off are significantly attenuated by both filters, while the desired 50 Hz tone remains intact. Figure 2 shows that he spectral response is almost identical to the baseline filter. This indicates that the optimization process can retain its inherent frequency selective characteristics. This confirms that the low power design achieves comparable noise suppression performance.
4.2. Frequency response
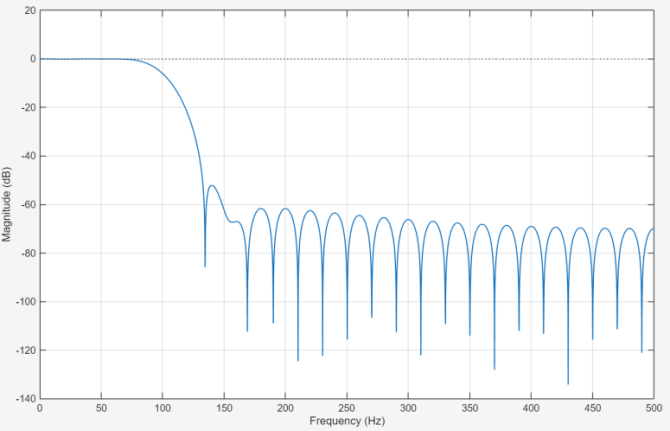
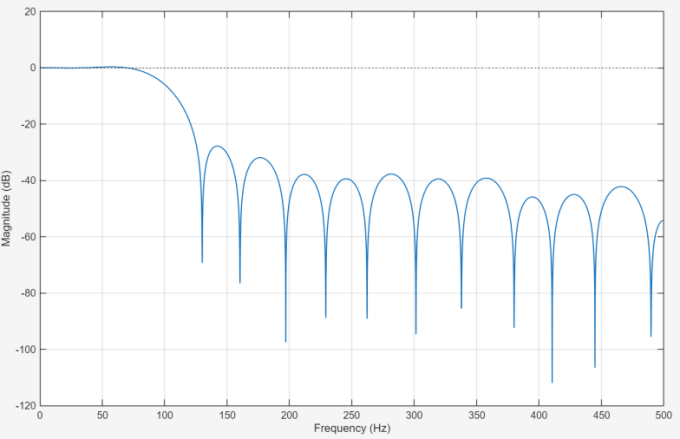
Figures 3 and 4 shows the magnitude responses of the two filters in dB scale. The baseline filter exhibits a distinct transition feature between the passband and the stopband, with the attenuation value in the stopband exceeding 80 decibels. The low power filter exhibits similar performance in terms of stopband attenuation and passband flatness, with only a slight difference in its transition slope. These results collectively confirm that the implemented optimizations, including coefficient sparsification and 10-bit quantization—preserve the essential frequency-domain characteristics within acceptable tolerances.
4.3. Time domain output
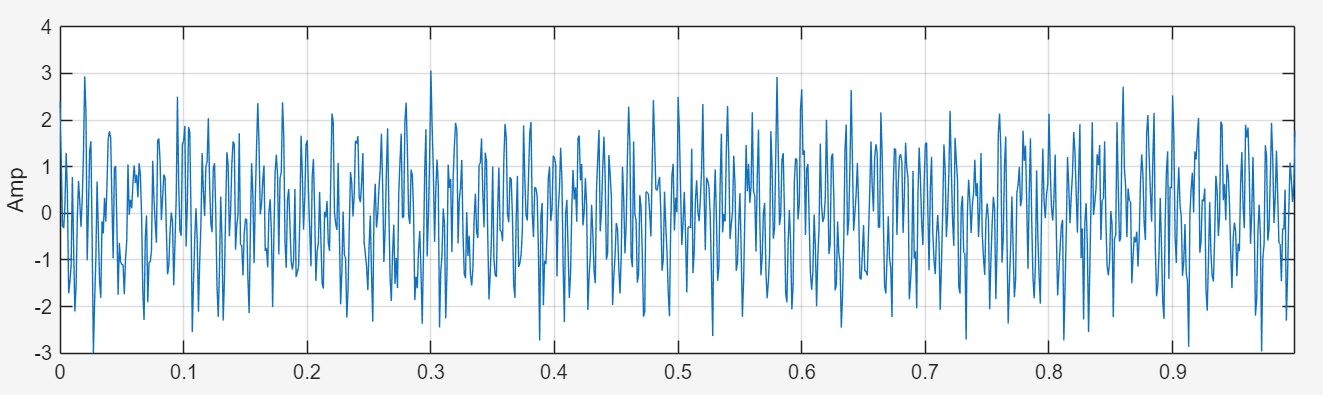
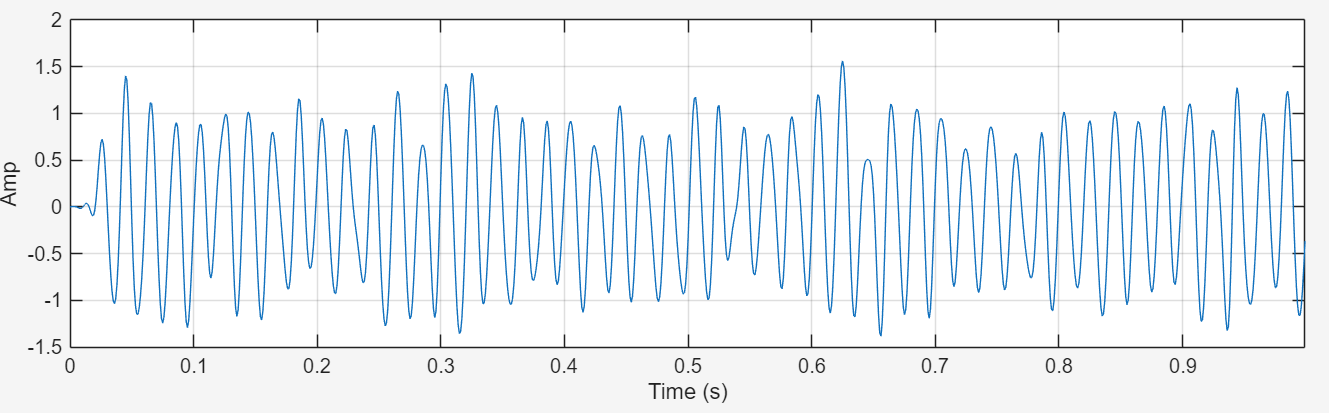
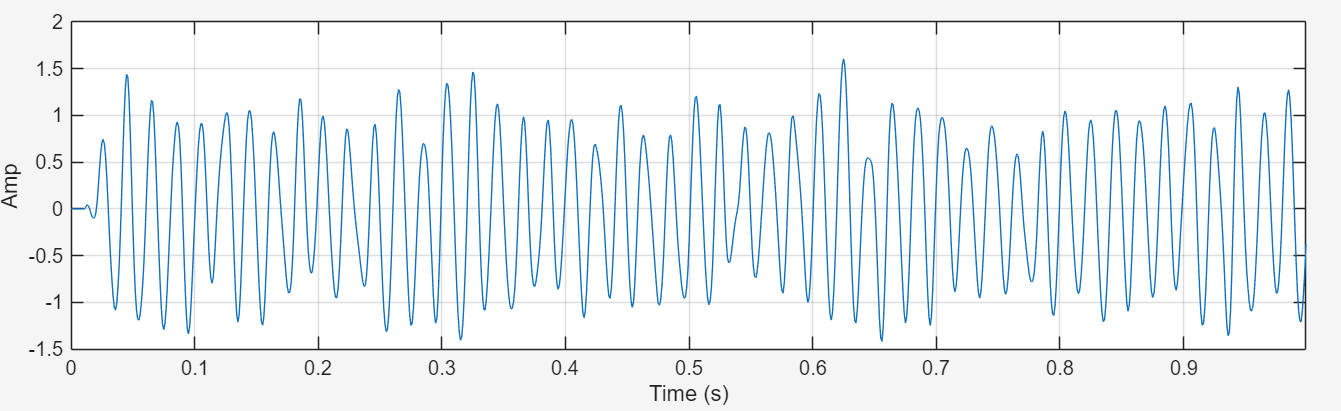
Figure 5-7 compare the time domain waveforms of the filtered signals. Both of these filters can effectively suppress high frequency noise and restore pure sine wave components. The envelope curves of the waveforms are almost exactly the same, which indicates that the optimization operation has not affected the perceived signal quality.
4.4. Power
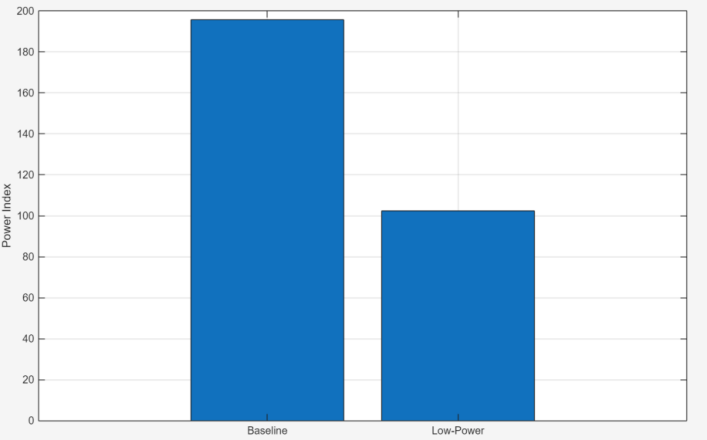
Figure 8 compares the power indices between the baseline and low-power filters, calculated using the model described in Section 1.3. The baseline filter demonstrates a 46% higher power exponent, attributable to its larger number of non-zero coefficients and wider coefficient bit-width. Notably, the optimized filter achieves 46% power reduction while preserving equivalent spectral characteristics and temporal performance.
The results indicate that the proposed low power finite impulse response filter design achieves a significant reduction in power consumption without sacrificing frequency selectivity, stopband attenuation, or the quality of the time domain signal. This proves that the optimization strategy designed for low power digital signal process application is effective.
5. Conclusion
This paper proposes a low power optimization method for the design of finite impulse response filters, aiming to reduce computational complexity and power consumption while maintaining the signal processing performance of the original filter. The proposed method utilizes coefficient sparsity and adopts a reduced-bit-width representation, thereby achieving more efficient hardware implementation.
The experimental results show that the optimized filter reduces the estimated power index by approximately 46%. At the same time, the frequency response characteristics, stopband attenuation and time domain output quality must remain unchanged. This confirms that the optimization strategy effectively balances energy efficiency and signal fidelity.
Compared with other low-power finite impulse response filter optimization techniques, the proposed method is not only simpler to implement but also does not require complex evolutionary algorithms. Moreover, it can be fully executed in MATLAB while remaining applicable for hardware deployment. This makes it particularly suitable for use in linear-phase finite impulse response filters employed in embedded digital signal processing systems as well as in low-sampling-rate applications. However, in ultra high precision scenarios, further research may be necessary to mitigate the potential quantization noise introduced due to the reduction in bit width.
The proposed method can be easily applied to embedded digital signal processing systems as well as to portable devices with strict power consumption requirements. Future work will focus on extending the optimization framework to apply it to adaptive finite impulse response filters and implementing the design on FPGA/ASIC platforms for practical application verification. In addition, further research will be conducted with the aim of integrating this method with hardware aware neural network accelerators and reconfigurable computing platforms, in order to further enhance energy efficiency in a wider range of signal processing and artificial intelligence based application.
References
[1]. Dietrich S. (2011) Digital Filters Basics and Design. Springer Science & Business Media.
[2]. Hossain, K., Ahmed, R., Haque, M. A., & Rahman, M. T. (2021). A review of digital FIR filter design in communication systems. International Journal of Science and Research.
[3]. Thingujam, C. S., & Kumar, M. (2021). Digital FIR filter designs. In 2021 Asian Conference on Innovation in Technology(ASIANCON). https: //doi.org/10.1109/ASIANCON51346.2021.9544766
[4]. Durgagopal, R., & Rao, D. N. (2022). Power optimized low pass digital FIR filter using five modular redundancy and parallel adding methods. In 2022 International Conference on Intelligent Controller and Computing for Smart Power (ICICCSP). https: //doi.org/10.1109/ICICCSP53532.2022.9862465
[5]. China Venkateshwarlu, S., Khadir, M., Vijay, V., Pittala, C. S., & Vallabhuni, R. R. (2022). Optimized design of power efficient FIR filter using modified Booth multiplier. In 2021 4th International Conference on Recent Trends in Computer Science and Technology (ICRTCST). https: //doi.org/10.1109/ICRTCST54752.2022.9781933
[6]. Islam, M. S., Islam, M. S., Rahman, S. K., Ferdous, N. S., & Jyoti, J. S. (2014). Design of FIR filter using Hamming window. International Journal of Emerging Research in Management & Technology.
[7]. Oppenheim, A. V., Schafer, R. W., & Buck, J. R. (1999). Discrete-time signal processing. Prentice Hall.
Cite this article
Lyu,X. (2025). Optimizing Digital Circuits for Low Power Using MATLAB Algorithms. Applied and Computational Engineering,201,45-53.
Data availability
The datasets used and/or analyzed during the current study will be available from the authors upon reasonable request.
Disclaimer/Publisher's Note
The statements, opinions and data contained in all publications are solely those of the individual author(s) and contributor(s) and not of EWA Publishing and/or the editor(s). EWA Publishing and/or the editor(s) disclaim responsibility for any injury to people or property resulting from any ideas, methods, instructions or products referred to in the content.
About volume
Volume title: Proceedings of CONF-FMCE 2025 Symposium: Semantic Communication for Media Compression and Transmission
© 2024 by the author(s). Licensee EWA Publishing, Oxford, UK. This article is an open access article distributed under the terms and
conditions of the Creative Commons Attribution (CC BY) license. Authors who
publish this series agree to the following terms:
1. Authors retain copyright and grant the series right of first publication with the work simultaneously licensed under a Creative Commons
Attribution License that allows others to share the work with an acknowledgment of the work's authorship and initial publication in this
series.
2. Authors are able to enter into separate, additional contractual arrangements for the non-exclusive distribution of the series's published
version of the work (e.g., post it to an institutional repository or publish it in a book), with an acknowledgment of its initial
publication in this series.
3. Authors are permitted and encouraged to post their work online (e.g., in institutional repositories or on their website) prior to and
during the submission process, as it can lead to productive exchanges, as well as earlier and greater citation of published work (See
Open access policy for details).
References
[1]. Dietrich S. (2011) Digital Filters Basics and Design. Springer Science & Business Media.
[2]. Hossain, K., Ahmed, R., Haque, M. A., & Rahman, M. T. (2021). A review of digital FIR filter design in communication systems. International Journal of Science and Research.
[3]. Thingujam, C. S., & Kumar, M. (2021). Digital FIR filter designs. In 2021 Asian Conference on Innovation in Technology(ASIANCON). https: //doi.org/10.1109/ASIANCON51346.2021.9544766
[4]. Durgagopal, R., & Rao, D. N. (2022). Power optimized low pass digital FIR filter using five modular redundancy and parallel adding methods. In 2022 International Conference on Intelligent Controller and Computing for Smart Power (ICICCSP). https: //doi.org/10.1109/ICICCSP53532.2022.9862465
[5]. China Venkateshwarlu, S., Khadir, M., Vijay, V., Pittala, C. S., & Vallabhuni, R. R. (2022). Optimized design of power efficient FIR filter using modified Booth multiplier. In 2021 4th International Conference on Recent Trends in Computer Science and Technology (ICRTCST). https: //doi.org/10.1109/ICRTCST54752.2022.9781933
[6]. Islam, M. S., Islam, M. S., Rahman, S. K., Ferdous, N. S., & Jyoti, J. S. (2014). Design of FIR filter using Hamming window. International Journal of Emerging Research in Management & Technology.
[7]. Oppenheim, A. V., Schafer, R. W., & Buck, J. R. (1999). Discrete-time signal processing. Prentice Hall.