


1. Introduction
Since the popularization of unmanned aerial vehicles (UAV), drones have drawn much more attention of the whole society than ever for the reason that UAVs can deal with tasks both civilian and military at a low cost, especially for those with vertical take-off and landing (VTOL) capabilities [1]. However, the actual application environment can be quite dynamic and uncertain with tasks being complicated, therefore, UAV swarm is introduced as a solution to such situation [2]. The word of “swarm” can be traced back to researches in the field of biology, in which collective motions of a large crowd of animals, such pigeons, wolves, and Anser cygnoides, were studied to find out the theory behind such behavior [3].
With the concept adopted to the formation of UAVs, five levels of UAV swarm intelligence are divided, and one of the levels is “Path Planning Layer”, which is made up of Subtask Management, Subtask Path Planning and Subtask Path Generation [4]. Among the three stages, in addition to reducing power consumption and enhancing locomotor performance, there is necessity that formation change can be controlled by themselves or the ground control station (GCS) with the help of receivers and transmitters to keep every drone informed of the occupied nodes in case of UAV loss [5].
Existing researches’ orientation was mainly based on the formation of birds. In 1970, Lissaman et al. analyzed the merits of different types of formation [6]. In 1981, Badgerow and Hainsworth further proved that the vee formation can significantly save the energy during the flight [7]. In 2013, Joo-Sung Maeng et al. demonstrated a flapping flight formation inspired by Canada goose, which was proved to save approximate 15% of the energy by Computational Fluid Dynamics (CFD) method [8].
Meanwhile, similar research methods have been adopted to artificial aircrafts. In 2009, Saban et al. developed a wake vortex model, which revealed the interaction between drones flying in formation [9]. In 2011, Hauert and his coworkers deployed 10 autonomous UAVs which could cooperate with each other, and therefore, only one operator was needed [10], just like the leading pigeon. In 2017, Qiu et al. reviewed the mapping relationship between flock of birds and swarm of UAVs [11].
The control engineering of UAV has also been investigated in recent years. The first model of distributed behavioral model of bird swarm —— Boid model was reported by Craig W. Reynolds in 1987, which simulated the behavior of different birds respectively, but failed to prove whether these simulations were valid [12]. Thirty years later, Duan et al. improved the existing flock model according to the characteristic of pigeons in 2015 [13]. Model of the pigeon behavior mechanism was established in terms of flight leadership rank, which led to relative UAV formation control [13]. In 2019, to reduce the energy consumption during the flight, Yang et al. were inspired by Anser cygnoides and classified the position exchange process into three different stages, namely the following mode, the leading mode and the accelerating mode [14].
In this paper, performance of various formation flights at different distances will be reviewed. Based on the theory of wake vortices, close and extended formation flight are simulated, ranging from vee formation, which has been investigated for over half decade [15], to O-formation that was raised in recent years [16], and their mechanical characteristics will be looked into respectively in order to prove their efficiency in drag reduction [17]. As a result, such conclusions can be adopted in the field of air display, which is mainly based on small unmanned rotorcrafts [18], and meanwhile, fixed-wing UAV swarm can also take advantage from the conclusions when safe separation distances are needed in long-distance flights [19].
2. Theoretical analysis of wake vortex
2.1. Velocity induced by rectilinear vortex
For ideal inviscid incompressible fluid, induced velocity will be generated in the two-dimensional flow field due to the vortex, and according to the Void-Savart law,
\( d\vec{V}=\frac{τ}{4π}\frac{d\vec{l}×\vec{r}}{{r^{3}}} \) (1)
where \( d\vec{l} \) is the microelement of vortex line; \( \vec{r} \) is the vector between the point and the microelement \( d\vec{l} \) ; and \( τ \) is the swirling strength [20].
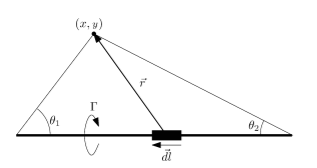
Figure 1. Vortex-filament [30].
Therefore, in figure 1, if there is a rectilinear vortex in the flow field, then
\( V=\int _{A}^{B}dV=\frac{τ}{4π}\int _{A}^{B}\frac{sinθ}{{r^{2}}}dl \) (2)
and
\( dl=\frac{rdθ}{sinθ}=\frac{h}{{sin^{2}}θ}dθ \) (3)
we can rewrite the formation (2.2) as
\( V=\frac{τ}{4πh}\int _{{θ_{1}}}^{{θ_{2}}}sinθdθ=\frac{τ}{4πh}(cos{θ_{1}}-cos{θ_{2}}) \) (4)
if the rectilinear vortex is infinite at both end, which means \( {θ_{1}}→0 \) and \( {θ_{2}}→π \) ,
\( V=\frac{τ}{2πh} \) (5) [21]
2.2. Aerodynamic model
To simplify the aerodynamic model for uniform flow around a high-aspect-ratio wing, the free vortex will not be affected and extend to the infinite point, and thus, that model is made up of uniform flow, bound vortex surface and free vortex surface [22]. In this way, the bound and free vortex surfaces can be simulated by countless horseshoe vortices [22].
Part of the horseshoe vortices that is vertical to the incoming flow simulates the bound vortex, which replays the lift force of the wing reference to the Kutta–Joukowski theorem [22]. Meanwhile, another part of the horseshoe vortices that is parallel simulates the free vortex, which extends downstream [22].
2.3. Lifting-line assumption
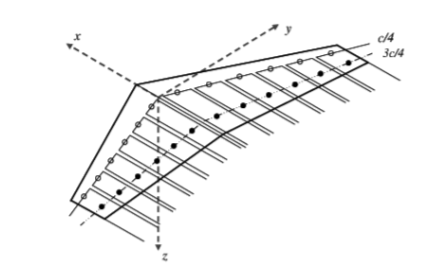
Figure 2. Lifting-line assumption based on horseshoe vortex [9].
According to the aerodynamic model established around a two-dimensional high-aspect-ratio wing, the vertical part of the horseshoe vortex system can be integrated into one vortex filament joint by quarter-chord points, just like the lifting-line assumption illustrated in figure 2, for the reason that the lift force increment of a low-speed airfoil acts on the aerodynamic center, which is approximately at the quarter-chord point [23].
2.4. Vortex lattice method
The term ‘Vortex Lattice Method’ refers to a practical way of numerical computational method to develop a wake vortex model [9]. In the process of establishing vortex lattice model, the wing is meshed into lattices, and each of which is approximated by a horseshoe vortex at a certain strength on the basis of lifting-line assumption [24]. Meanwhile, the midpoints of three-quarter chords are set as governing points to calculate the induced velocity caused by the vortices, and by the way, to meet the boundary conditions and trailing edge conditions as well [24].
2.5. Velocity of downwash and downwash angle
Since the bound vortex line has been substituted with the lifting line, the downwash velocity caused by the free vortex can be calculated as the induced speed of bound vortex, so
\( d{v_{i}}=-\frac{1}{4π(\frac{1}{4}c-δ)}\frac{dτ}{dδ}dδ \) (6)
where \( τ \) is the vortex strength at spanwise position of \( δ \) , and thus, the free vortex strength of \( dδ \) equals \( \frac{dτ}{dδ}dδ \) [25].
In most cases, \( \frac{1}{4}c-δ \gt 0 \) and \( \frac{dτ}{dδ} \gt 0 \) , which result in the velocity pointing at the negative direction, and
\( {v_{i}}(z)=-\frac{1}{4π}\int _{-\frac{l}{2}}^{\frac{l}{2}}\frac{1}{\frac{1}{4}c-δ}\frac{dτ}{dδ}dδ \) (7)
in which \( l \) means the length of the wing spanwise [25]. Meanwhile, at two wingspans behind the UAV, there is also upwash flow section outboard the wing tip in addition to the downwash flow section that distributes near the fuselage, just like figure 3 [26].
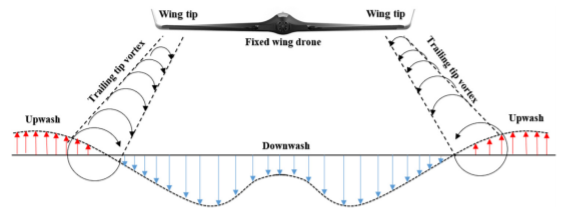
Figure 3. General view of upwash and downwash [15].
So that if the incoming flow of an aircraft is affected by the downwash velocity, the effective angle of attack is going to decline for \( ∆∝ \) , which is so-called downwash angle. The downwash angle \( ∆∝ \) is quite small numerically, and approximation that \( sin∝=∝ \) and \( cos∝=1 \) is acceptable. In this case, figure 4 is plotted as the stress analysis diagram, with lift force \( L \) and drag force \( D \) equaling
\( L=ρ{V_{∞}}\int _{-\frac{l}{2}}^{\frac{l}{2}}τ(z)dz \) (8a)
\( {D_{induced}}=ρ{V_{∞}}\int _{-\frac{l}{2}}^{\frac{l}{2}}τ(z)∆∝dz \) (8b)
where \( ρ \) is the density of the flow, \( {V_{∞}} \) is the speed of the incoming flow and \( z \) is the axis established on the lifting line [27]. To be pointed out, the drag force of an ideal two-dimensional airfoil should equal zero on the basis of D'Alembert's paradox, but such induced drag force, which has no connection with the fluid viscosity, results from the downwash angle \( ∆∝ \) that reduces the effectual attack angle [22].
And upwash is almost of the same principle but the opposite effect [28].
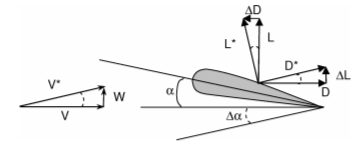
Figure 4. Views of downwash angle [29].
3. Formations and their performance analysis
Consulting the investigation results conducted by ONERA and DLR, the wake vortex can be divided into four different stages by the \( k=\frac{x}{b} \) ratio, in which \( x \) is the distance between the detection point and the leading plane and \( b \) is the wingspan length [30]. As can be spotted in figure 5, the near-wake field is distributed near the trailing edge until entering the extended near-wake field, most of which is within the boundary of \( k=10 \) , and formation flight in these two areas is so-called close formation flight [30]. Meanwhile, the mid-wake field and the far-wake and dispersion field are divided by the \( k=100 \) line, with the term extend formation flight coined to describe formation flight in these fields [30].
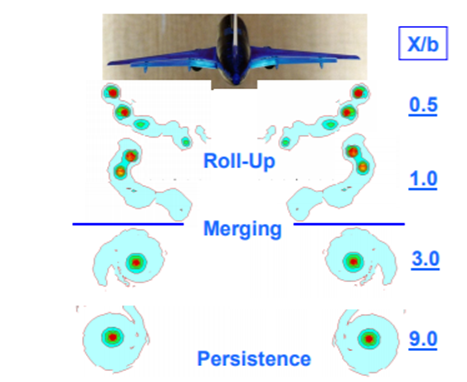
Figure 5. View of vortex roll-up [30].
3.1. Close formation flight
The original intension of close formation flight is to make the trailing planes fly in the upwash flow of the leading plane in order to save energy, and therefore, a desired position in the formation (mostly within ten times the wingspan length) becomes one of the most important factors [27].
3.1.1. Vee formation. Since swarm is a bio-inspired concept, the Vee formation that is often witnessed in the migration of birds has been investigated for over fifty years from different aspects [15], and this review will mainly focus on this formation, especially for its dynamic characteristic and optimization.
There is no denying that once the outline of the formation has been determined, the only factor to change the configuration is the gap between aircrafts. Mirzaeinia and the coworkers looked into the ratios of the distance between the wing-tips and the semi-wingspan \( \frac{2s}{b} \) , as well as the number of UAVs [15]. Among the broken lines shown in figure 6, it is obvious that with the ratio of 0.24, a UAV swarm formation can save up to 80% energy, which is almost five times of the efficiency when \( \frac{2s}{b}=1 \) , indicating that drag reduction can vary dramatically by simply changing the gap between aircrafts [15].
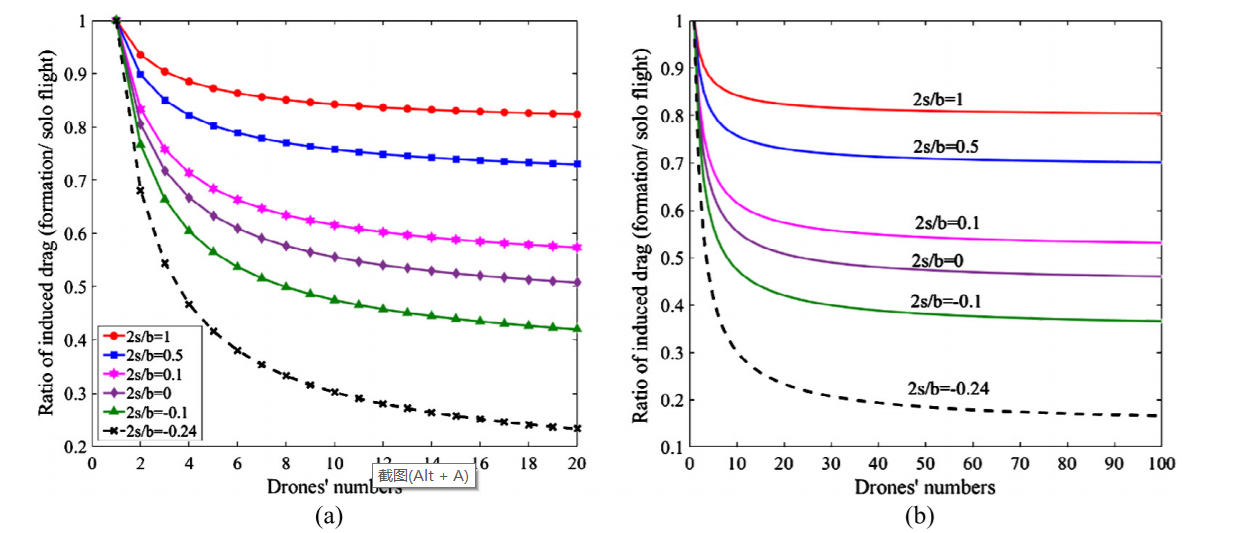
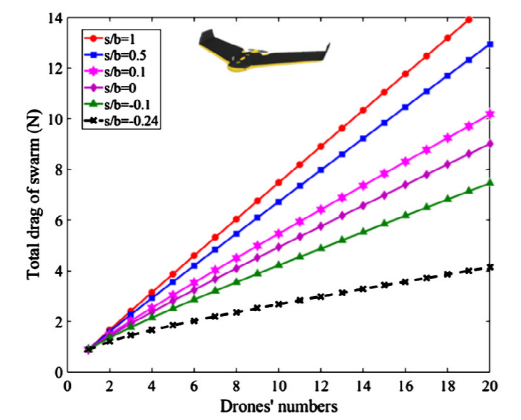
Figure 6. Ratio between the drag of formation flight and that of solo flight [15].
Generally, the leading and the last drones consume much more energy than others, so the nodes have to be changed continually to make the endurance of the UAV swarm as desired, and thus, finding the leading drone is essential when analyzing the performance during the process of optimization [31]. That is easy to figure out the leader in the pre-flight stage, but after the flight has taken place, it is not the case unless pre-configuration is carried out.
Therefore, for the exchange strategy shown in figure 7, whether the number of aircrafts is even or odd, there is one or two drones in either side that consume more energy, so that all formation can be divided into four groups in which group members change their positions with others [15]. Nevertheless, as can be discovered from the figure, the time that each drone enters the high-conservation status is not equaled and some of the UAVs even do not change their nodes at all. In this case, further optimization can be explored in order to make full use of the endurance of UAVs.
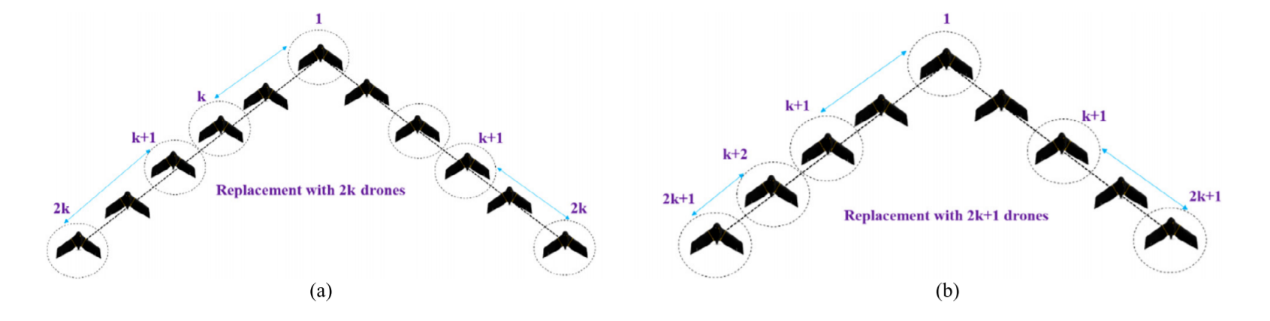
Figure 7. Sketch Map of UAV nodes switch [15].
Meanwhile, to make the swarming formation self-organized, system inspired by Spanning Tree Protocol (STP) is adopted and such system is able to broadcast the IDs of occupied nodes, so that all aircrafts can accept each of them as the new leader once the information received [15], in which way the reformation is performed.
3.1.2. O-formation. In most cases, a Ground Control Station (GCS) is necessary in formation flight, so that energy consumed in that process should be considered as well. The communication channel between the control station and the UAV is assumed to use narrowband, and thus, that follows the free space path loss, meaning that the sum of distance between GCS and the drone has to be minimum [16].
Therefore, despite the conventional kinetic analysis, there is another optimized formation that
\( \sum _{i≠k}{|h_{k}^{H}{h_{i}}|^{2}}=0 ∀k \) (9)
in which \( {h_{k}} \) is a channel between the control station and the UAV \( k \) [16]. And such formations, which are much more power-effective than the V-formations and random formations, are called the orthogonal channel formations, termed as the O-formations, and two of them are demonstrated in figure 8 [16].
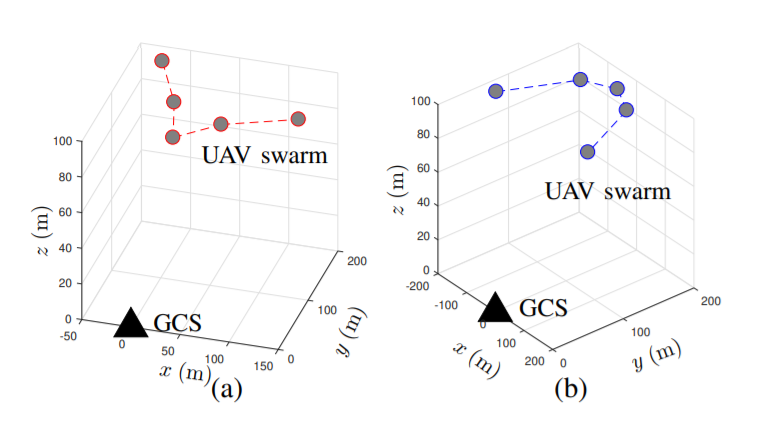
Figure 8. Two of the formations that fit the optimized formation [16].
On the other hand, for self-organized UAV swarm without GCS, O-formation seems to be not so adaptive because it is based on the hypothesis that the beamforming performance should be maximized, even at the cost of aerodynamic efficiency [16].
3.1.3. Echelon formation. The Echelon Formation could be quite usual in practical use, with the trailing aircraft assigned at the side rear of the leading one on the same side. As is shown in figure 9, the lift-to-drag ratio is significantly high for UAV C at the cost of more power consumption of UAV A and B, for the reason that drone C can take advantage of the tip vortex of both A and B in echelon formation [32]. However, the advantage of upwash flow has not been fully taken in that formation pattern, so echelon formation may not suit movements of long distance, but it is specified in saving UAV C’s power, especially suitable for missions such as relay [32].
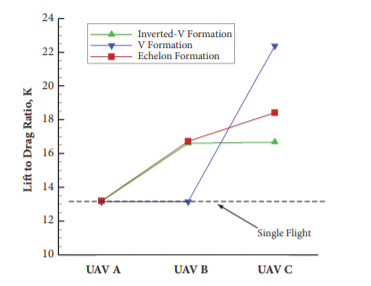
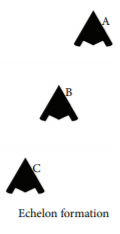
Figure 9. A comparison between Echelon formation and another two traditional formations [32].
3.2. Comparison
Table 1. A comparison between different formations in close formation flight.
Different Formations | Self-organized UAV | Relay mission | Ride quality | Endurance |
V-formation | Best | √ | √ | Best |
O-formation | × | √ | √ | √ |
Echelon Formation | √ | Best | × | × |
Comparison between formations is performed in Table 1 for close formation flight, and to conclude, different formations have their own advantages, and thus, the adoption of formations should refer to the specific tasks and requirements.
3.3. Extended formation flight
The energy conservation resulting from upwash is only available in the beneficial regions, or the effect will suffer from attenuation [16], but for large UAVs, safe separation distances are needed in case of safety concerns. Therefore, the way swarming aircrafts can both fly at a distance and benefit from the tip vortex becomes something worthy of investigating.
For close formation flight, a flat wake is an ideal model; but for extended formation flight, especially for formation with streamwise separation of 10 wingspans, a rolled-up wake model plays a vital role in the flight process [19].
In Andrew Ning and his coworkers’ study, V Formation, Echelon Formation and Inverted-V Formation are investigated, but all of these three formations have been adjusted for farther distance (about 20 wingspans) between the leader and the trailing aircrafts, just like the formations shown in figure 10 [19]. For inverted-V formation, drag conservation is mainly contributed by the last drone, thus its efficiency tends to be lower than the other two [19].
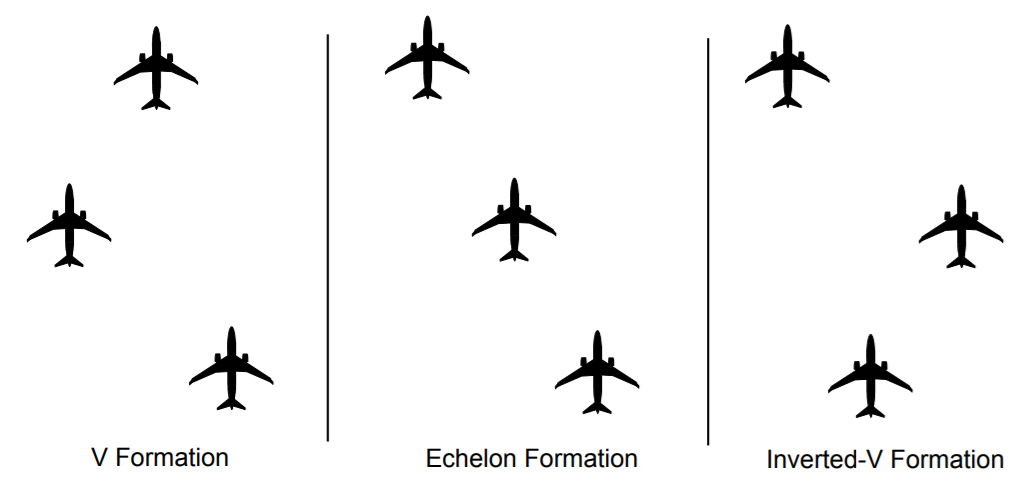
Figure 10. Different formations in extended formation flight [19].
On the other hand, as can be discovered from the figure 11, however, in a V and echelon formation, if the incoming flow is considered as viscous, trailing aircrafts will suffer from asymmetric flow interaction, and thus, load distribution will be unbalanced, resulting in viscous trim drag penalty and lower power-saving efficiency [19].
Meanwhile, tip vortices in echelon formation, which are approximated in the calculation process, will decay at an increasing rate at large distance and becomes closely related to several parameters, which makes it either increase or decrease, degrading the ride quality and leading to uncertainty in drag uncertainty [19]. In conclusion, V Formation tends to be a better choice for extended formation flight in a long distance.
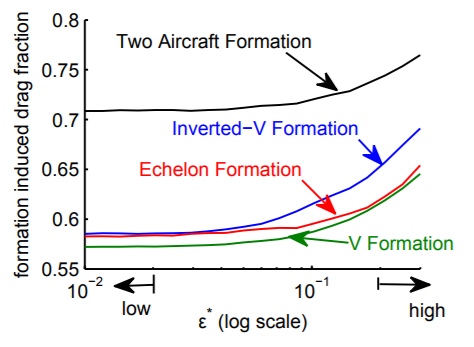
Figure 11. The relationship between formation induced drag and normalized eddy dissipation rate with distance of 20 wingspans streamwise [19].
4. Conclusions
The UAV swarm has become much more accessible than ever, thus emphasizing the importance of formation flight that can boost the performance of all aircrafts. This review looks into the connection between tip vortices and drag reduction, emphasizing that tip-to-tip distance has a close relationship with the flow interaction. Different patterns of formation in both close formation and extended formation are reviewed, indicating that the traditional V-formation can be the most widely used, with other formations investigated suitable for different application scenarios.
However, various formations have their own disadvantages. For V and echelon formation, the load distribution of aircrafts can be imbalanced in viscous flow, thus decreasing the endurance of UAVs. For inverted-V formation, the upwash is not made full use of. For O-formation, it is not specified for self-organized swarming UAVs. To conclude, formation of UAV swarm should be selected on reference to the exact mission targets and task requirements.
References
[1]. Hua, M. D., Chen, B. M., & Chen, W. H. (2013). Introduction to feedback control of underactuated VTOL vehicles. IEEE Control Systems Journal, 33(1), 61-75.
[2]. Zhou, Y., Rao, B., & Wang, W. (2020). UAV swarm intelligence: Recent advances and future trends. IEEE Access, 8, 183856-183878.
[3]. Duan, H., & Zhang, X. (2015). Phase transition of vortex-like self-propelled particles induced by an adversary particle. Physical Review E Statistical Nonlinearity and Soft Matter Physics, 92(1-1), 012701.
[4]. Boskovic, J. D., Prasanth, R., & Mehra, R. K. (1971). Multilayer autonomous intelligent control architecture for unmanned aerial vehicles. Journal of Aeronautical Computing, Information and Communications, 1(12), 605-628.
[5]. Giulietti, F., Pollini, L., & Innocenti, M. (2000). Autonomous formation flight. Control Systems IEEE, 20(6), 34-44.
[6]. Lissaman, P. B., & Shollenberger, C. A. (1970). Formation flight in birds. Science (New York), 168(3934), 1003-5. doi:10.1126/science.168.3934.1003
[7]. Badgerow, J. P., & Hainsworth, F. R. (1981). Saving energy by flying in formation? Pulse formation revisited. Journal of Theoretical Biology, 93(1), 41-52.
[8]. Maeng, J. S., Lee, S., Kim, D., & Yoon, H. S. (2013). A modeling approach for energy conservation of Canada geese in flight using computational fluid dynamics. Journal of Theoretical Biology, 320, 76-85.
[9]. Saban, D., Whidborne, J. F., & Cooke, A. K. (2009). Simulation of wake vortex effects in unmanned aircraft in close formation flight. Journal of Aeronautics - New Series - 113.1149, 727-738.
[10]. Hauert, S., Leven, S., Vásárhelyi, G., & Martinoli, A. (2014). Realistic fixed-wing robots in Reynolds swarms: Communication range versus maximum turn rate. IEEE/RSJ International Conference on Intelligent Robots and Systems.
[11]. Qiu, H. X., & Duan, H. B. (2017). From collective flight of bird flocks to autonomous swarm formation of unmanned aerial vehicles. Chinese Journal of Engineering, 2017, 1-11.
[12]. Reynolds, C. W. (1987). Flocks, herds and schools: A distributed model of behavior. ACM SIGGRAPH Computer Graphics, 21(4), 25-34.
[13]. Qiu, H. X., Duan, H. B., & Fan, Y. M. (2015). Autonomous formation of multiple UAVs based on pigeon flock behavior mechanism. Control Theory and Applications.
[14]. Yang, Q., & Duan, H. B. (2019). Verification of UAV swarm behavior mechanism based on Anser cygnoides formation. Chinese Journal of Engineering, 41(12), 1599-1608.
[15]. Mirzaeinia, A., Chamorro, L. P., Cagan, A., & Abdulrahim, M. (2019). Energy conservation of V-sharming fixed-wing drones through position reconfiguration. Aerospace Science and Technology, 94(Nov.), 105
[16]. Kang, H., Joung, J., & Kang, J. (2020). Power efficiency formation of drone swarms: like flying birds? In GLOBECOM 2020 - 2020 IEEE Global Communications Conference (pp. 1-6). IEEE.
[17]. Colombi, J., Jacques, D. R., & Lambach, J. L. (2017). Combining drone swarm systems with reduced formation drag. In 2017 IEEE International Systems Conference (SysCon) (pp. 1-6). IEEE.
[18]. Jia, Y., & Yue, X. (2021). Simulation study of leading airshow character display by UAV swarm. Unmanned Systems Technology, 4(3), 8.
[19]. Ning, A., Flanzer, T. C., & Kroo, I. M. (2011). Aerodynamic performance of extended formation flight. Journal of Aircraft, 48(1), 136-143.
[20]. Zhuang, L. Q., Yin, X. Y., & Ma, S. Y. (1990). Fluid mechanics (Revised edition). University of Science and Technology of China Press.
[21]. Liu, Z. Y. (2016). Study on the vortex drag reduction mechanism and formation parameters optimization in tight formation flight. (Doctoral dissertation, University of Science and Technology of China).
[22]. Yan, Z. Y., Lu, Z. L., & Wang, J. F. (2018). Aerodynamics. Science Press.
[23]. Phillips, W. F., & Snyder, D. O. (2000). Modern adaptation of Prandtl's classic lifting line theory. Journal of Aircraft, 37(4), 66670.
[24]. Konstadinopoulos, P., et al. (1985). A vortex-lattice method for general, unsteady aerodynamics. Journal of Aircraft, 22(1), 43-49.
[25]. Weissinger, J. (1947). Lift distribution of swept wings. Technical report archive and image library, 1120.
[26]. Li, D., et al. (2023). Aerodynamic coupling simulation study on tight formation flight of UAV. Flight Dynamics, 41(01), 14-19.
[27]. Kaden, A., & Luckner, R. (2018). Modelling of wake rolling and vortex-induced forces and moments for tight formation flight. AIAA Modeling and Simulation Technologies Conference.
[28]. Li, B., et al. (2015). Aerodynamic coupling analysis and simulation of UAV tight formation flight. Computer Simulation, 32(8), 5.
[29]. Bangash, Z. A., et al. (2012). Aerodynamics of formation flight. Journal of Aircraft, 43(4), 907-912.
[30]. Coustols, E., et al. (2003). "Minimised Wake": a Collaborative Research Programme on Aircraft Wake Vortices. Aerospace Science Meetings and Exhibits DLR.
[31]. Cattivelli, F. S., & Sayed, A. H. (2011). Modeling bird flight formations using diffusion adaptation. IEEE Transactions on Signal Processing, 59(5), 2038-2051.
[32]. Zhang, D., et al. (2018). Numerical aerodynamic characteristics analysis of the close formation flight. Mathematical Problems in Engineering, 2018, Article ID 8767802, 1-13.
Cite this article
Lu,Z. (2023). The formation of unmanned aerial vehicle swarm. Applied and Computational Engineering,10,37-46.
Data availability
The datasets used and/or analyzed during the current study will be available from the authors upon reasonable request.
Disclaimer/Publisher's Note
The statements, opinions and data contained in all publications are solely those of the individual author(s) and contributor(s) and not of EWA Publishing and/or the editor(s). EWA Publishing and/or the editor(s) disclaim responsibility for any injury to people or property resulting from any ideas, methods, instructions or products referred to in the content.
About volume
Volume title: Proceedings of the 2023 International Conference on Mechatronics and Smart Systems
© 2024 by the author(s). Licensee EWA Publishing, Oxford, UK. This article is an open access article distributed under the terms and
conditions of the Creative Commons Attribution (CC BY) license. Authors who
publish this series agree to the following terms:
1. Authors retain copyright and grant the series right of first publication with the work simultaneously licensed under a Creative Commons
Attribution License that allows others to share the work with an acknowledgment of the work's authorship and initial publication in this
series.
2. Authors are able to enter into separate, additional contractual arrangements for the non-exclusive distribution of the series's published
version of the work (e.g., post it to an institutional repository or publish it in a book), with an acknowledgment of its initial
publication in this series.
3. Authors are permitted and encouraged to post their work online (e.g., in institutional repositories or on their website) prior to and
during the submission process, as it can lead to productive exchanges, as well as earlier and greater citation of published work (See
Open access policy for details).
References
[1]. Hua, M. D., Chen, B. M., & Chen, W. H. (2013). Introduction to feedback control of underactuated VTOL vehicles. IEEE Control Systems Journal, 33(1), 61-75.
[2]. Zhou, Y., Rao, B., & Wang, W. (2020). UAV swarm intelligence: Recent advances and future trends. IEEE Access, 8, 183856-183878.
[3]. Duan, H., & Zhang, X. (2015). Phase transition of vortex-like self-propelled particles induced by an adversary particle. Physical Review E Statistical Nonlinearity and Soft Matter Physics, 92(1-1), 012701.
[4]. Boskovic, J. D., Prasanth, R., & Mehra, R. K. (1971). Multilayer autonomous intelligent control architecture for unmanned aerial vehicles. Journal of Aeronautical Computing, Information and Communications, 1(12), 605-628.
[5]. Giulietti, F., Pollini, L., & Innocenti, M. (2000). Autonomous formation flight. Control Systems IEEE, 20(6), 34-44.
[6]. Lissaman, P. B., & Shollenberger, C. A. (1970). Formation flight in birds. Science (New York), 168(3934), 1003-5. doi:10.1126/science.168.3934.1003
[7]. Badgerow, J. P., & Hainsworth, F. R. (1981). Saving energy by flying in formation? Pulse formation revisited. Journal of Theoretical Biology, 93(1), 41-52.
[8]. Maeng, J. S., Lee, S., Kim, D., & Yoon, H. S. (2013). A modeling approach for energy conservation of Canada geese in flight using computational fluid dynamics. Journal of Theoretical Biology, 320, 76-85.
[9]. Saban, D., Whidborne, J. F., & Cooke, A. K. (2009). Simulation of wake vortex effects in unmanned aircraft in close formation flight. Journal of Aeronautics - New Series - 113.1149, 727-738.
[10]. Hauert, S., Leven, S., Vásárhelyi, G., & Martinoli, A. (2014). Realistic fixed-wing robots in Reynolds swarms: Communication range versus maximum turn rate. IEEE/RSJ International Conference on Intelligent Robots and Systems.
[11]. Qiu, H. X., & Duan, H. B. (2017). From collective flight of bird flocks to autonomous swarm formation of unmanned aerial vehicles. Chinese Journal of Engineering, 2017, 1-11.
[12]. Reynolds, C. W. (1987). Flocks, herds and schools: A distributed model of behavior. ACM SIGGRAPH Computer Graphics, 21(4), 25-34.
[13]. Qiu, H. X., Duan, H. B., & Fan, Y. M. (2015). Autonomous formation of multiple UAVs based on pigeon flock behavior mechanism. Control Theory and Applications.
[14]. Yang, Q., & Duan, H. B. (2019). Verification of UAV swarm behavior mechanism based on Anser cygnoides formation. Chinese Journal of Engineering, 41(12), 1599-1608.
[15]. Mirzaeinia, A., Chamorro, L. P., Cagan, A., & Abdulrahim, M. (2019). Energy conservation of V-sharming fixed-wing drones through position reconfiguration. Aerospace Science and Technology, 94(Nov.), 105
[16]. Kang, H., Joung, J., & Kang, J. (2020). Power efficiency formation of drone swarms: like flying birds? In GLOBECOM 2020 - 2020 IEEE Global Communications Conference (pp. 1-6). IEEE.
[17]. Colombi, J., Jacques, D. R., & Lambach, J. L. (2017). Combining drone swarm systems with reduced formation drag. In 2017 IEEE International Systems Conference (SysCon) (pp. 1-6). IEEE.
[18]. Jia, Y., & Yue, X. (2021). Simulation study of leading airshow character display by UAV swarm. Unmanned Systems Technology, 4(3), 8.
[19]. Ning, A., Flanzer, T. C., & Kroo, I. M. (2011). Aerodynamic performance of extended formation flight. Journal of Aircraft, 48(1), 136-143.
[20]. Zhuang, L. Q., Yin, X. Y., & Ma, S. Y. (1990). Fluid mechanics (Revised edition). University of Science and Technology of China Press.
[21]. Liu, Z. Y. (2016). Study on the vortex drag reduction mechanism and formation parameters optimization in tight formation flight. (Doctoral dissertation, University of Science and Technology of China).
[22]. Yan, Z. Y., Lu, Z. L., & Wang, J. F. (2018). Aerodynamics. Science Press.
[23]. Phillips, W. F., & Snyder, D. O. (2000). Modern adaptation of Prandtl's classic lifting line theory. Journal of Aircraft, 37(4), 66670.
[24]. Konstadinopoulos, P., et al. (1985). A vortex-lattice method for general, unsteady aerodynamics. Journal of Aircraft, 22(1), 43-49.
[25]. Weissinger, J. (1947). Lift distribution of swept wings. Technical report archive and image library, 1120.
[26]. Li, D., et al. (2023). Aerodynamic coupling simulation study on tight formation flight of UAV. Flight Dynamics, 41(01), 14-19.
[27]. Kaden, A., & Luckner, R. (2018). Modelling of wake rolling and vortex-induced forces and moments for tight formation flight. AIAA Modeling and Simulation Technologies Conference.
[28]. Li, B., et al. (2015). Aerodynamic coupling analysis and simulation of UAV tight formation flight. Computer Simulation, 32(8), 5.
[29]. Bangash, Z. A., et al. (2012). Aerodynamics of formation flight. Journal of Aircraft, 43(4), 907-912.
[30]. Coustols, E., et al. (2003). "Minimised Wake": a Collaborative Research Programme on Aircraft Wake Vortices. Aerospace Science Meetings and Exhibits DLR.
[31]. Cattivelli, F. S., & Sayed, A. H. (2011). Modeling bird flight formations using diffusion adaptation. IEEE Transactions on Signal Processing, 59(5), 2038-2051.
[32]. Zhang, D., et al. (2018). Numerical aerodynamic characteristics analysis of the close formation flight. Mathematical Problems in Engineering, 2018, Article ID 8767802, 1-13.