


1. Introduction
To achieve signal amplification, fiber optic amplifiers are a crucial optical component in fiber optic communication systems. The equivalent rare earth ion doped fiber optic amplifier can be created by introducing a very small quantity of rare earth ions into the fiber optic core layer. The growth of fiber optic communication has been substantially aided by the appearance of fiber optic amplifiers. Research on fiber optic amplifiers is essential to further extending transmission distance, enhancing transmission quality, and boosting transmission capacity [1]. In terms of performance index, function, and cost, fiber optic communication networks now require fiber optic amplifiers due to the development of Dense Wavelength Division Multiplexing, fiber optic Community Antenna Television, and other technologies. As a result, fiber optic amplifiers are moving toward higher gain bandwidth, higher saturation output power, dynamic gain flattening, and control capability [2]. Erbium-doped fiber amplifiers are currently widely utilized, although despite their benefits of high gain, low loss, etc., their broadband amplification range can only span C-band and L-band frequencies (1520-1630 nm). The typical erbium-doped fiber amplifier can no longer match the capacity requirements of communication networks due to the rapid development of cloud computing and the Internet of Things. Based on this, fiber amplifiers doped with various rare earth ions have become popular in order to increase the efficient usage of other bandwidths, such as O-band, s-band, and other bandwidths of close to 400 nm. The amplification properties of thulium-doped fiber are still being observed and discovered by researchers, and China is also conducting extensive research on thulium-doped fiber. As a result, thulium-doped fiber holds a significant position in the field of fiber optic communication, and it is urgent to investigate its amplification gain [3]. Based on findings from prior studies, this study examine in this paper the effects of fiber length and thulium ion doping concentration on amplifier gain spectrum at signal light wavelengths of 1800-2000 nm, calculate them using MATLAB modeling, and optimize the parameters using both cyclic and genetic optimization algorithms to achieve the maximum gain of fiber [4, 5].
2. Principle of two-energy level structure
The two-energy electron leap structure, as the name implies, is composed of only two energy level structures [1]. The E1 energy level is called the ground state and the E2 energy level is called the second energy level. The electron in the ground state, when irradiated by pump light and signal light, absorbs energy and leaps to the second energy level. This leap process is influenced by the absorption rate of pump light and the absorption rate of signal light. After reaching the second energy level, the energy level structure of the electron is not stable enough. On the one hand, the signal light is excited and emitted back to the ground state. On the other hand, there is a certain chance of radiate leap to make the electron of the second energy level jump back to the ground state. During the process of leaping back to the ground state in both ways, light in the 1800-2000 nm band is emitted, and this band is the one in which we conduct this study [6-8].
For the two-energy level structure rate equation, the equation is as follows [7, 9].
\( {N_{1}}=-({W_{P}}+{W_{12}}){N_{1}}+{A_{21}}{N_{2}}+{W_{21}}{N_{2}} \) (1)
\( {N_{2}}=({W_{12}}+{W_{P}}){N_{1}}-{W_{21}}{N_{2}}-{A_{21}}{N_{2}} \) (2)
\( N={N_{1}}+{N_{2}} \) (3)
The \( {W_{P}}{, W_{12}}, {W_{21}}, {A_{21}} \) are pump light absorption rate, signal light absorption rate, signal light stimulated emission rate, radiation jumping rate.
For the two-energy level structure power equation, the equation is as follows [7, 9].
\( \frac{d{P_{P}}(z)}{dz}={Γ_{p}}[-{σ_{p}}{N_{1}}(z)-{α_{a}}]{P_{P}}(z) \) (4)
\( {\frac{d{P_{s}}(z)}{dz}=Γ_{s}}[{σ_{21}}{N_{2}}(z)-{σ_{12}}{N_{1}}(z)-{α_{s}}]{P_{s}}(z) \) (5)
\( {\frac{d{P_{ase}}(z)}{dz}=Γ_{ase}}[-{σ_{21}}{N_{2}}(z)-{σ_{21}}{N_{1}}(z)-{α_{s}}]{P_{ase}}(z)+{σ_{21}}{N_{2}}(z)hvΔv \) (6)
\( Δv=\frac{2π}{{λ^{2}}}*1{e^{-9}} \) (7)
The \( α \) , \( Δv \) are loss factor of fiber material, frequency half height full width [7, 9].
3. Research methodology
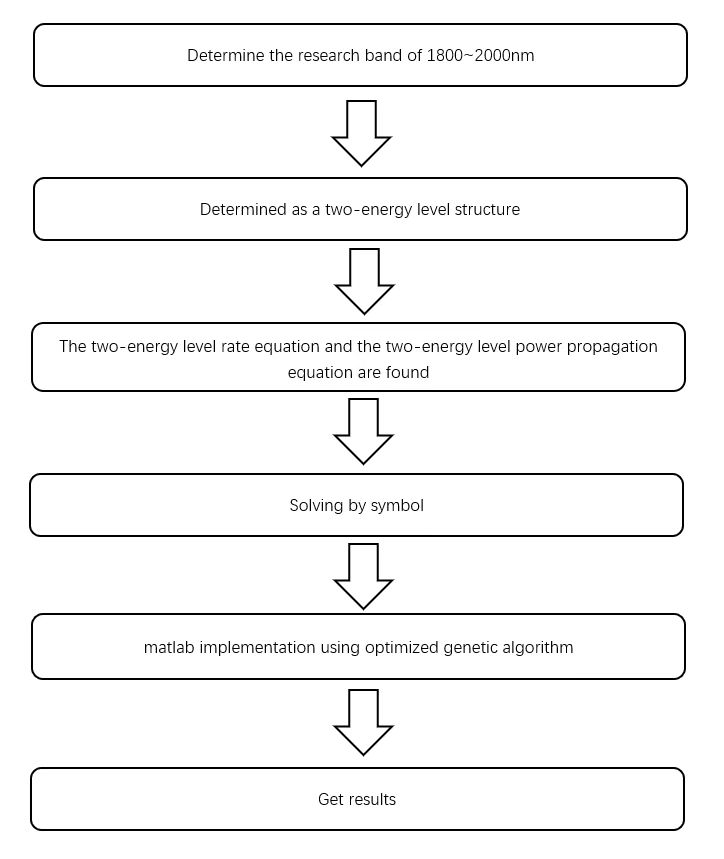
Matlab software was used for the study [6]. Two-energy level rate equation and power propagation equation were solved by symbols and then programmed using Matlab. The fitting function in Matlab and the get-date software were used to first obtain the spectral maps of thulium elements and then to obtain the fitting expressions for the functions. The absorption and emission spectra's final plot lines were obtained. An improved genetic algorithm was chosen to be used for the algorithm's application. The energetic equation is modified and then the Matlab implementation is performed using genetic algorithm. The following is the workflow diagram.
| Figure 1. Workflow diagram. |
Genetic algorithm was first proposed by American John Holland in the 1970s, which is designed based on the evolution rules of species in the nature [10]. It is a mathematical model that replicates Darwin's theory of biological evolution through genetic and natural selection. It is also a technique for finding the optimal answer by mimicking the course of natural evolution. This algorithm uses mathematical methods and computer simulation operations to turn the process of solving problems into processes such as chromosome gene crossing and mutation in biological evolution. While solving some relatively complex combination optimization problems, it usually provides better optimization results which is faster than some conventional optimization algorithms.
Prior to employing a genetic algorithm to solve a problem, one must first specify the problem's objective function, constraints, and variable encoding scheme. The initial population, a random set of feasible solutions, is then generated. The goal function's value, or the fitness value, is then determined for each individual. A selection operation is performed to choose a subset of individuals for the next generation based on the fitness value. The crossover operation, in which chromosomes are exchanged for selected individuals, produces new individuals. Mutation, where some genes are randomly altered in some individuals to increase the diversity of the population. Until a termination condition, such as the maximum number of iterations is reached or the fitness value hits a predetermined threshold, the objective function value and the four operations of selection, including crossover and mutation, are repeated. Finally, the optimal solution or optimal set of solutions is output.
The genetic algorithm makes direct use of the value of the target function as research information. It only uses the value of the fitness function to evaluate whether individuals are good and does not imply the derived or differential computation process of the value of the target function [11].
Problems of non-standard and inaccurate coding exist in genetic algorithms. As the single gene algorithm encoding cannot fully represent the constraints of the optimization problem, it should consider adopting the threshold for unworkable solutions. Genetic algorithms are generally less effective than other traditional optimization methods.
4. Results and discussion
To simulate the signal gain at the wavelength of 1800-2000 nm, this study use the following parameters in the model:
Table 1. Fiber parameters [12].
Parameter name | Specific data |
radiation transition probability A21 | \( 1000 MW \) |
pumping light absorption rate WPA | \( 460 MW \) |
pumping light emission rate WPE | \( 885 MW \) |
Signal input power | \( 472.5×{10^{-6}} W \) |
absorption cross section | \( {4.16×{10^{-25}} m^{2}} \) |
emission cross section | \( {3.59×{10^{-25}} m^{2}} \) |
|
Figure 2. The signal gain of the emission curve at the doping concentration of 0.5×1.6×1025 cm-3 as a function of fiber length. |
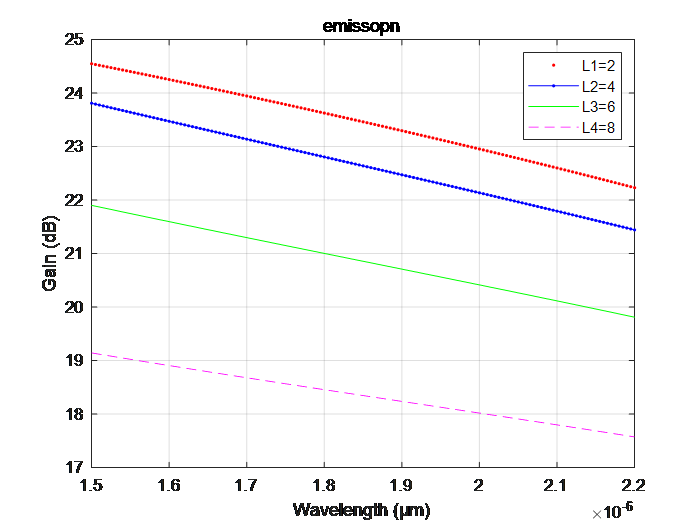
In Figure 2, red, blue, green and purple represent the signal gain curves of fiber lengths at 2, 4, 6 and 8 microns, respectively. The signal gain between 1800 and 2000 nm decreases with the increase of fiber length under the condition of constant doping concentration.
|
|
Figure 3. Relationship between signal gain and doping concentration of the emission curve at 2 microns of fiber length. | Figure 4. Relationship between signal gain and pump power of the transmit curve at 2 microns of fiber length. |
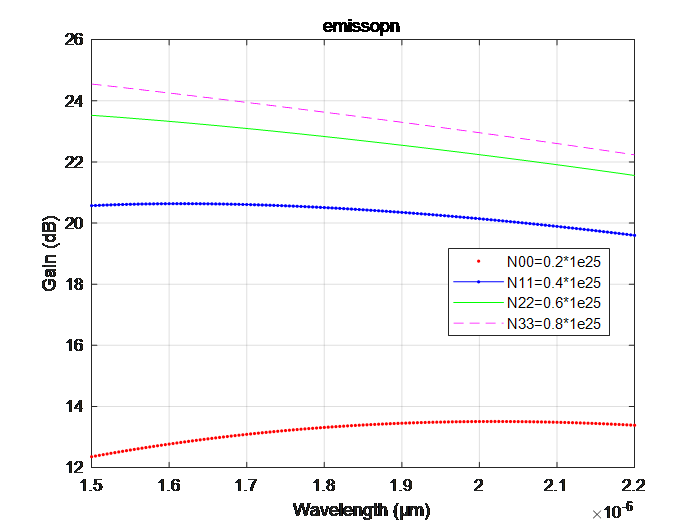
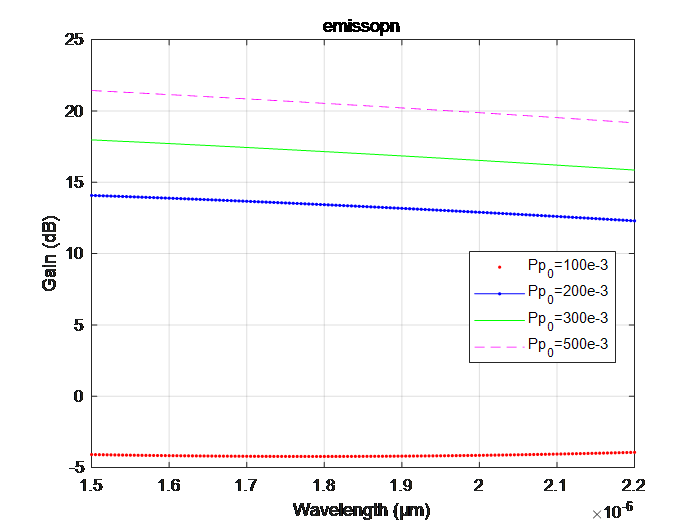
The doping concentration in Figure 2 was analyzed by selecting four values, and the four curves of red, blue, green and violet represented the change of signal gain with wavelength at concentrations of 0.2, 0.4, 0.6, 0.8×1.6×1025 cm-3. The results show that the signal gain between 1800 and 2000 nm increases with the increase of doping concentration. Then the pumping power of 100 MW, 200 MW, 300 MW and 500 MW is selected respectively, and analyzed under the condition of controlling the length of the fiber and the doping concentration. The results in Figure 4 show the same trend in pump power. It is worth mentioning that when the doping concentration is 0.2×1.6×1025 cm-3, the emission intensity of 2-micron fiber shows a slight upward trend with the increase of wavelength, and then decreases relatively later. Considering the energy gap, the edge band emission in the long wavelength region is just in the transition between the two energy levels, the low doping concentration ions are easy to be emptied in the ground state, and the similar phenomenon may occur even at the high doping concentration, but the effect on the overall curve is low [6, 13]. If the concentration is kept constant, it is possible to find the maximum signal gain between 1800 and 2000 nm at 2 μm.
|
Figure 5. A three-dimensional view of signal gain as a function of doping concentration and fiber length. |
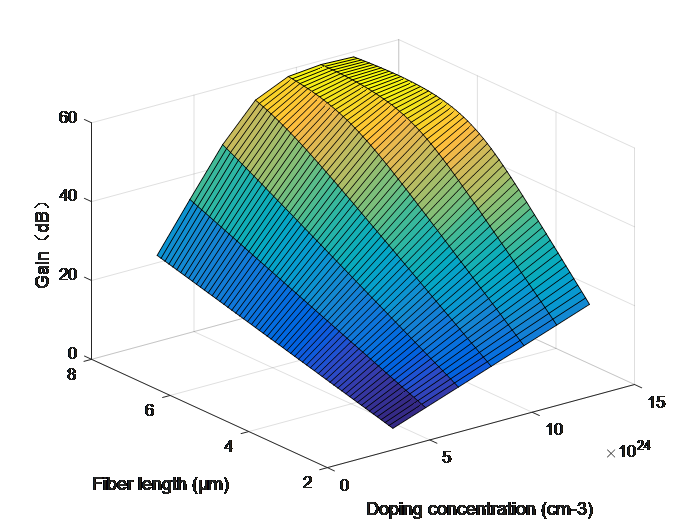
By fitting the emission spectrum curve between 1800 and 2000 nm, the central wavelength at its peak value (about 1865 nm [12, 14]) is obtained, the maximum gain of emission spectrum is 59.2257 dB at the fiber length of 6.9 µm and the doping concentration of 1.28×1.6×1025 cm-3. The X coordinate in the Figure represents the range of doping concentration (0-1.5×1.6×1025 cm-3), the y coordinate represents the range of fiber length (2-8 µm), and the z coordinate represents the signal gain. The relationship between them can be seen intuitively, and the corresponding relationship between the signal gain of the emission curve and the length of the fiber and the doping concentration is also verified.
|
| |
Figure 6. Gain optimizations based on genetic algorithm post-data. | Figure 7. Gain optimizations based on genetic algorithm post-data. |
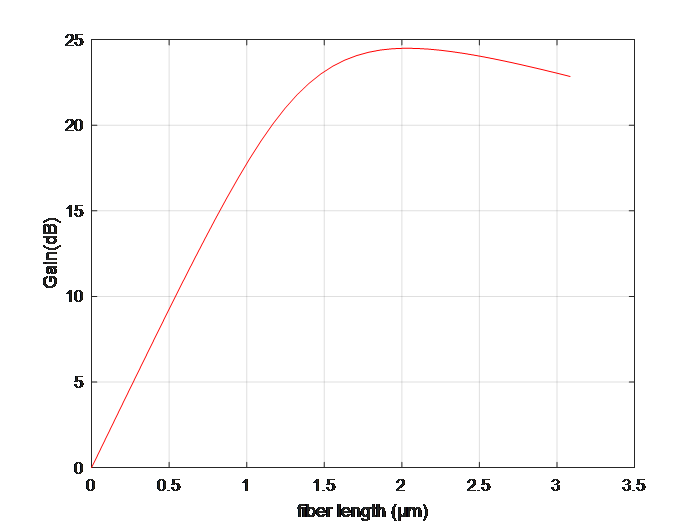
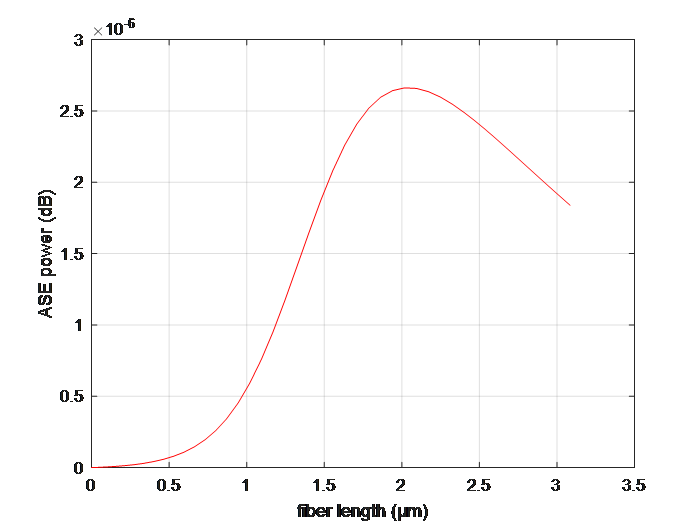
To verify the previous hypothesis, under the control of low concentration range, 0-3-micron fiber length with ASE Power, signal gain simulation comparison. Data optimization by genetic algorithm resulted in a gain maximum of 24.5299 dB at a fibre length of 1.9626 µm and a maximum ASE power.
5. Conclusion
In this paper, the main study is the maximization of signal gain in the 1800 to 2000 nm wavelength region for thulium-doped fiber amplifiers. By simulations, the optimal fibre length value is found at maximum gain in different cases using a two-tier cyclical approach and a genetic algorithm, respectively. The results of experimental simulation show that the signal gain of the emission spectrum in the wavelength region of 1800-2000 nm gradually increases with the shortening of the fiber length, and is proportional to the doping concentration and pump power. The 3D graphic visually shows the relationship between signal gain, doping concentration and fiber length, and finds the maximum gain value. The results of the gain evaluation show that the selected fiber length of 1.9626 µm has better signal gain performance between 1800 and 2000 nm at relatively low Tm3+ dop-ant concentrations. These results allow an accurate assessment of the potential of thulium-doped fiber amplifiers for high gain signal amplification in the 1800-2000 nm band.
References
[1]. Miniscalco W J 2001 Optical and Electronic Properties of Rare Earth Ions in Glasses.
[2]. Yamada M 1997 Ultra-broadband and gain-flattened EDFAs for WDM signals (Oaa97 Tech Dig).
[3]. Spector N, Reisfeld N and Boehm L 1997 Eigenstates and Radiative Transition Probabilities for Tm3+ (4f12) in Phosphate and Tellurite Glasses Chem. Phys. Lett. 49(1) p 49-53.
[4]. Kishi Y and Tanabe S 1969 Properties of Tm3+-Doped Germanotellurite Glasses for S-Band Amplifier J. Am. Ceram. Soc. (New York: Wiley–Interscience).
[5]. Mori A, Ohishi Y and Sudo S 1997 Erbium-doped tellurite glass fibre laser and amplifier.
[6]. Tanabe S 2003 Gain characteristics of Tm-doped fluoride fiber amplifier in S-band by dual-wavelength pumping. Journal of Non-Crystalline Solids: A Journal Devoted to Oxide, Halide, Chalcogenide and Metallic Glasses, Amorphous Semiconductors, Non-Crystalline Films, Glass-Ceramics and Glassy Composites.
[7]. Yuki 2005 Properties of Tm3+‐Doped Germanotellurite Glasses for S‐Band Amplifier.Journal of the American Ceramic Society.
[8]. J S 1994 Tellurite glass: a new candidate for fiber devices.
[9]. Tanabe A S 2001 Properties of Tm3+-doped tellurite glasses for 1.4 µm amplifier. Proc. SPIE. Int. Soc. Opti. Eng. pp 4282.
[10]. Wang J X, Duan L Q and Yang Y P 2018 An improvement crossover operation method in genetic algorithm and spatial optimization of heliostat field.
[11]. 2016 Optimization Design of Magnetic Gear Based on Genetic Algorithm Toolbox of Matlab J. Elec. Eng.
[12]. Lee Y W, Chien H W, Cho C H, Chen J Z, Chang J S and Jiang S 2013 Heavily Tm3+-Doped Silicate Fiber for High-Gain Fiber Amplifiers. Fibers (New York: Wiley–Interscience)
[13]. Sakamoto T 1999 Gain-equalized thulium-doped fiber amplifiers for 1460-nm-band WDM signals.
[14]. Szebesta D, Percival R M and Williams J R 2002 Highly efficient 1.064 μm upconversion pumped 1.47 μm thulium doped fluoride fibre laser.
Cite this article
Bao,J.;Cao,Y.;Huang,Q. (2023). Maximum gain optimization of thulium-doped fiber amplifier based on genetic algorithm for peak gain spectrum at 1800- 2000nm. Applied and Computational Engineering,10,72-78.
Data availability
The datasets used and/or analyzed during the current study will be available from the authors upon reasonable request.
Disclaimer/Publisher's Note
The statements, opinions and data contained in all publications are solely those of the individual author(s) and contributor(s) and not of EWA Publishing and/or the editor(s). EWA Publishing and/or the editor(s) disclaim responsibility for any injury to people or property resulting from any ideas, methods, instructions or products referred to in the content.
About volume
Volume title: Proceedings of the 2023 International Conference on Mechatronics and Smart Systems
© 2024 by the author(s). Licensee EWA Publishing, Oxford, UK. This article is an open access article distributed under the terms and
conditions of the Creative Commons Attribution (CC BY) license. Authors who
publish this series agree to the following terms:
1. Authors retain copyright and grant the series right of first publication with the work simultaneously licensed under a Creative Commons
Attribution License that allows others to share the work with an acknowledgment of the work's authorship and initial publication in this
series.
2. Authors are able to enter into separate, additional contractual arrangements for the non-exclusive distribution of the series's published
version of the work (e.g., post it to an institutional repository or publish it in a book), with an acknowledgment of its initial
publication in this series.
3. Authors are permitted and encouraged to post their work online (e.g., in institutional repositories or on their website) prior to and
during the submission process, as it can lead to productive exchanges, as well as earlier and greater citation of published work (See
Open access policy for details).
References
[1]. Miniscalco W J 2001 Optical and Electronic Properties of Rare Earth Ions in Glasses.
[2]. Yamada M 1997 Ultra-broadband and gain-flattened EDFAs for WDM signals (Oaa97 Tech Dig).
[3]. Spector N, Reisfeld N and Boehm L 1997 Eigenstates and Radiative Transition Probabilities for Tm3+ (4f12) in Phosphate and Tellurite Glasses Chem. Phys. Lett. 49(1) p 49-53.
[4]. Kishi Y and Tanabe S 1969 Properties of Tm3+-Doped Germanotellurite Glasses for S-Band Amplifier J. Am. Ceram. Soc. (New York: Wiley–Interscience).
[5]. Mori A, Ohishi Y and Sudo S 1997 Erbium-doped tellurite glass fibre laser and amplifier.
[6]. Tanabe S 2003 Gain characteristics of Tm-doped fluoride fiber amplifier in S-band by dual-wavelength pumping. Journal of Non-Crystalline Solids: A Journal Devoted to Oxide, Halide, Chalcogenide and Metallic Glasses, Amorphous Semiconductors, Non-Crystalline Films, Glass-Ceramics and Glassy Composites.
[7]. Yuki 2005 Properties of Tm3+‐Doped Germanotellurite Glasses for S‐Band Amplifier.Journal of the American Ceramic Society.
[8]. J S 1994 Tellurite glass: a new candidate for fiber devices.
[9]. Tanabe A S 2001 Properties of Tm3+-doped tellurite glasses for 1.4 µm amplifier. Proc. SPIE. Int. Soc. Opti. Eng. pp 4282.
[10]. Wang J X, Duan L Q and Yang Y P 2018 An improvement crossover operation method in genetic algorithm and spatial optimization of heliostat field.
[11]. 2016 Optimization Design of Magnetic Gear Based on Genetic Algorithm Toolbox of Matlab J. Elec. Eng.
[12]. Lee Y W, Chien H W, Cho C H, Chen J Z, Chang J S and Jiang S 2013 Heavily Tm3+-Doped Silicate Fiber for High-Gain Fiber Amplifiers. Fibers (New York: Wiley–Interscience)
[13]. Sakamoto T 1999 Gain-equalized thulium-doped fiber amplifiers for 1460-nm-band WDM signals.
[14]. Szebesta D, Percival R M and Williams J R 2002 Highly efficient 1.064 μm upconversion pumped 1.47 μm thulium doped fluoride fibre laser.