


1. Introduction
Parkinson's disease (PD) is a neurodegenerative disease affecting the body's motor functions. It is the second most common neurodegenerative disease, after Alzheimer’s disease [1]. Generally speaking, it can be caused by the accidental misfolding of proteins in neurons, leading to cell death and brain damage. There are both environmental and genetic factors that can increase the risk of Parkinson’s disease. Prior head injury and pesticide exposure may increase the risk of Parkinson’s disease. A family history of the disease may also increase the risk. Lastly, the elderly are significantly more likely to have Parkinson’s disease than younger people, and males are slightly more prone than females.
Different Parkinson's disease patients can show different signs and symptoms, but the most common symptoms include tremors, stiffness, slowing of movement, loss of balance, loss of automatic movements, and difficulty with walking, writing, or speech [2]. These symptoms tend to worsen and become more apparent over time. Oftentimes in the early stages of Parkinson’s disease, symptoms are mild and are unnoticed. Symptoms often begin on one side of the body and usually remain worse on that side, even after symptoms begin to affect the limbs on both sides. There is no known treatment that can fully cure Parkinson’s disease [3].
Today, there are over 10 million Parkinson’s patients worldwide and over 1 million in the US. Not only does the disease have a significant negative impact on patients’ health conditions and quality of life, but it also causes economic burdens such as medical costs, indirect productivity losses, non-medical costs, and disability income. The estimated total economic burden of Parkinson’s disease on the US in 2017 was $51.9 billion, and direct medical costs are estimated to be $25.4 billion, as shown in Figure 1 [4]. Thus, it is becoming more and more urgent to find ways to fight against Parkinson’s.
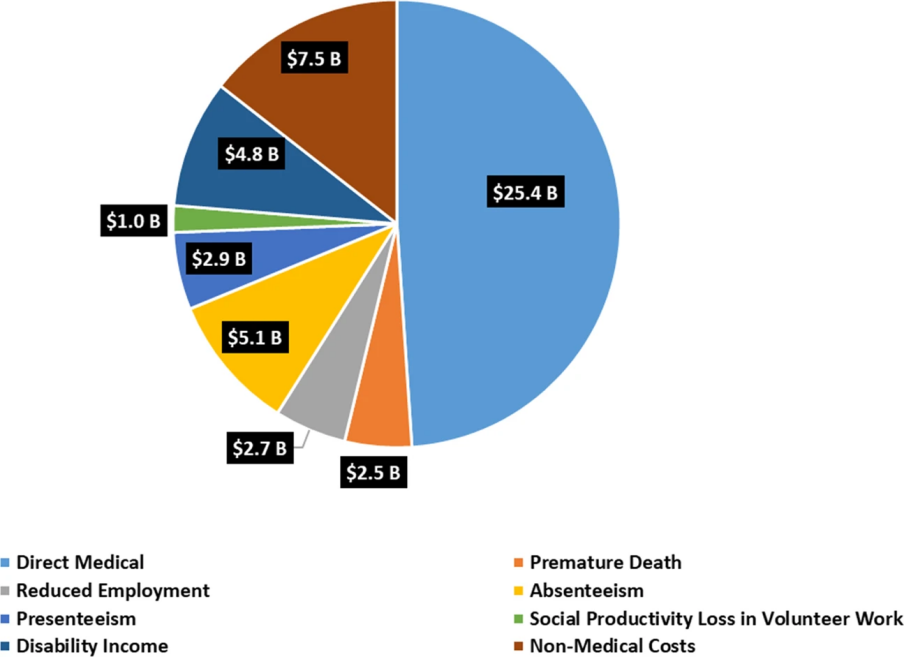
Figure 1. Economic burden of Parkinson’s on the US [4].
If Parkinson’s can be diagnosed early, before symptoms become apparent and worsen, it is possible that the disease can be better treated and the total harm to the patient will be reduced. Since Parkinson’s often affects a patient’s facial movements and facial expression ability, one approach to diagnosis is by analysing facial features, and machine learning methods can be used for early diagnosis of Parkinson’s by analysing facial data [5,6]. This can then help with identifying patterns that are hard for humans to recognize and gaining new insights into the nature of the disease, and they provide a low-cost and non-invasive method of diagnosis. Ultimately, these results will contribute to the effort to find a method to cure and prevent the disease in the future.
2. Existing research and innovations
Currently, there is no single test that can give a conclusive diagnosis of Parkinson’s disease. Doctors usually diagnose Parkinson’s through a physical or neurological examination and a careful analysis of the patient’s medical history and symptoms [3].
There has also been a reasonable amount of research done on diagnosing Parkinson’s disease using artificial intelligence (AI) and machine learning already. Primarily, the existing research involved using data collected from hospitals or research institutes and standard computer vision techniques and machine learning algorithms.
For example, one prior study by researchers Xinyao Hou et al. [7] collected 70 videos of Parkinson’s disease patients and healthy subjects from hospitals each. Using methods such as random forest, support vector machines, and k-nearest neighbors to analyze the geometric and texture features of the video data, they reached an accuracy of 88% in diagnosing Parkinson’s.
Another study by researchers Liqiong Yang et al. [8] collected facial expression data from Parkinson’s disease patients and healthy subjects using phonation tests from a hospital. The data was then analyzed using software called Noldus FaceReader 7.0. They found that in Parkinson’s patients, emotions such as happiness, surprise, and arousal were significantly lower, and emotions such as sadness, anger, fear, and disgust were much higher than in healthy subjects.
There also have been other works done in a similar vein [6,9]. These existing methods and resources can often be costly and intrusive on the patients. Therefore, this research investigated a different approach to using AI to diagnose Parkinson’s, focusing on accessibility and affordability. It examined whether AI can still produce diagnostic results of reasonable accuracy with such a focus. Additionally, this paper also investigated which machine learning models are the most accurate and effective at diagnosing Parkinson’s.
For this study, the main innovations include designing and creating an end-to-end machine learning pipeline and solution for early Parkinson’s disease diagnosis that is low-cost and optimized using hyperparameter tuning. Additionally, the system also has high model explainability as the classification models can show clearly which features were important to the system for diagnosing Parkinson’s.
3. Methods
The overall approach was to use resources that were freely available on the Internet for model development and training. As seen in the flowchart in Figure 2, the process can largely be divided into data collection, data processing, feature extraction, and model training and evaluation.
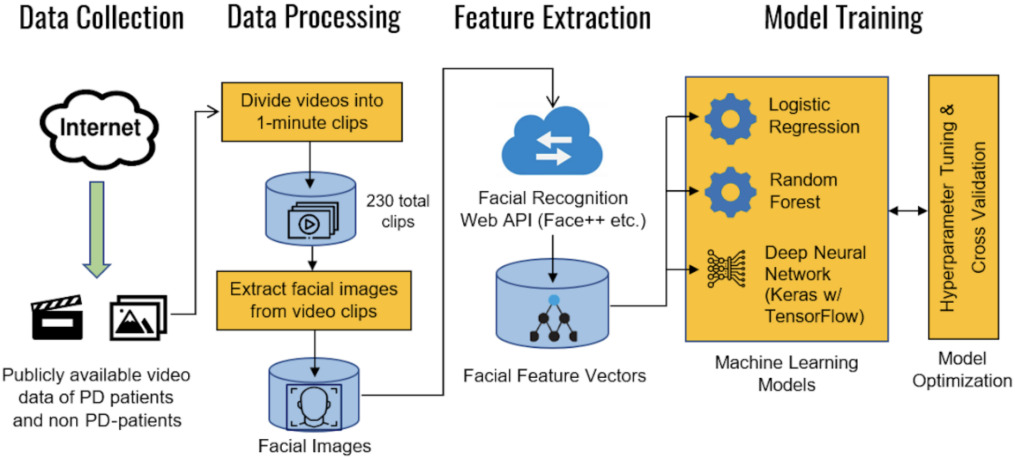
Figure 2. Overall machine learning pipeline and training process for the model.
3.1. Data collection
To reduce the cost of data collection, the training data was collected from publicly available videos of confirmed Parkinson’s patients and likely healthy individuals on YouTube. All research data collected is used solely for research purposes and so falls under fair use under section 107 of the Copyright Act of 1976 [10].
A total of 40 videos were collected, with 20 being of Parkinson’s patients and 20 being of healthy individuals. Within each group, the aimed to maintain a diverse array of individuals, making sure to include a balance of males and females, a variety of different ethnicities, and varying ages. Although since Parkinson’s typically afflicts the elderly, the choice was made to include more videos of elderly people than young people. Lastly, videos of both celebrities and regular people were also included in both groups. Figure 3 shows sample data collected for both Parkinson’s patients and healthy individuals.
Additionally, not only is this method cost-efficient, but it is also innovative in that it is easily scalable. Collecting data from patients in a hospital would be costly, slow, and hard to upscale. However, sampling videos from public sources can be much faster and the size of the dataset can be easily increased. For example, a script could be used to automatically search for and download images or videos from public sources like YouTube to serve as data.
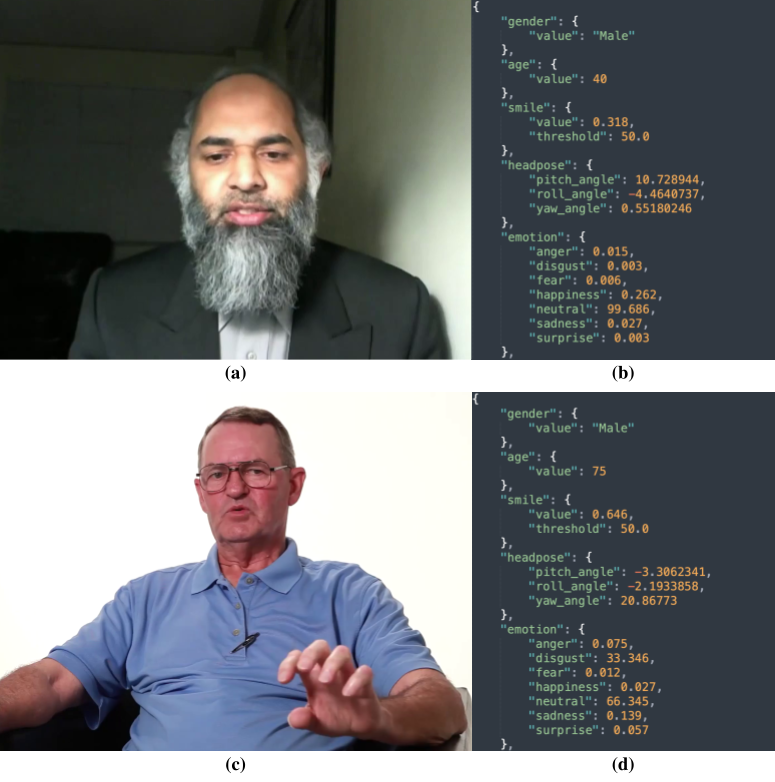
Figure 3. Sample data collected from YouTube and corresponding Face++ data. Top: (a) healthy individual and (b) Face++ JSON output, bottom: (c) Parkinson’s patient and (d) Face++ JSON output.
3.2. Data processing
Using macOS’s built-in QuickTime Player, these videos were divided into 1-minute clips containing only one person. Sections of the video not focused on the person’s face were also removed to ensure the overall quality of the data and to reduce interference with the facial detection algorithm.
The shortest videos in the dataset were divided into only one or two video clips, and the longest videos were divided into up to 15 video clips. Ultimately, there were 146 video clips of healthy individuals and 81 video clips of Parkinson’s patients.
These video clips were then separated into a sequence of frames so that they could be later inputted into Face++’s API as images.
3.3. Feature extraction
The facial detection and recognition software Face++ is used to analyze the features and attributes of each video clip, and these were stored as quantitative feature vectors for each video clip, which could then be used as input data for the machine learning models.
Face++ uses computer vision to analyze input images for human faces with high accuracy. For each face detected in the image, Face++ outputs a feature vector that can be stored as a JSON file. Each feature vector includes attributes such as the person’s perceived gender, age, emotions, and skin condition [11]. However, some of the attributes extracted by Face++, like the orientation of the person’s face or whether the person was wearing glasses, were not useful for predicting Parkinson’s and could have had confounding effects on the diagnosis.
3.4. Model training
Using each video clip as a data point, the models were trained on the video clips’ feature vectors using existing algorithms such as logistic regression, random forest, and deep learning from Python libraries including TensorFlow and scikit-learn [12].
Then, the models were further optimized and improved using hyperparameter tuning. The hyperparameters (settings) of the model were adjusted to find the ideal combination that maximized the model’s performance. For each model, a subset of the available hyperparameters was identified that would be most important to optimize. Then, for each hyperparameter selected, a range or set of values it may take was assigned. Using random search, 100 random combinations of values were generated for the hyperparameters according to the selected ranges, and the model were trained using each combination. Finally, the combination that gave the best performance was used for final training and testing.
The first model to be trained was using logistic regression, a fundamental machine learning algorithm. Logistic regression is used for binary classification problems (predicting the probability of an event occurring or not occurring), making it a natural choice for a problem like diagnosing Parkinson’s. During hyperparameter tuning, the logistic regression parameters were optimized, such as the solver (between Newton-CG, L-BFGS, LIBLINEAR), the penalty functions (between none, F1, F2, and both F1 and F2), the regularization coefficient (from 10-5 to 102), and the maximum number of iterations (from 10 to 500).
Decision trees and random forests were also used to train models. Decision trees are tree structures where the leaf nodes are the possible end categories (Parkinson’s or healthy) and the internal nodes leading up to leaves determine which path of the tree to follow based on testing the input features. Random forests are collections of multiple decision trees. For this model, the parameters were tuned, such as the number of trees (from 10 to 200) and the criterion function for tree splitting (between Gini impurity and Shannon entropy).
Lastly, deep neural network models were trained from both scikit-learn (multilayer perceptrons [13]) and Tensorflow Keras. These models have many layers of neurons which transform the data inputted from the previous layer and pass the output on to the next layer, eventually reaching the last output layer which gives the classification result. For these models, the parameters were tuned, such as the number and sizes of layers to use, the solver (between L-BFGS, stochastic gradient descent, and Adam), the activation functions (between the identity, logistic sigmoid, hyperbolic tangent, and ReLU functions), and the learning rate coefficient (from 10-5 to 10-1).
3.5. Model evaluation
After the models had finished training, they were evaluated against testing data based on performance metrics such as accuracy score (Eq. 1) and F1 score (Eq. 4) [14].
\( Accuracy=\frac{true positives+true negatives}{true positives+true negatives+false positives+false negatives} \) (1)
\( Precision=\frac{true positives}{true positives+false positives} \) (2)
\( Recall=\frac{true positives+true negatives}{true positives+false negatives} \) (3)
\( {F_{1}}=\frac{2∙true positives}{2∙true positives+false positives+false negatives} \) (4)
F1 score can be a more representative evaluation metric than accuracy when positive and negative data are unbalanced. To ensure that there is sufficient data for evaluation, 70% of the data was used for training and the remaining 30% for evaluation.
Additionally, cross-validation was used to ensure that the performance evaluation was as accurate as possible. After obtaining the optimal combination of hyperparameters from hyperparameter tuning, the total data set was divided into ten smaller samples. According to the 70-30 split for training and testing, seven of the samples were used for training and the remaining three for testing. Then, the ten data samples were iterated to divide into seven training and three testing through the different ways. Using the optimal hyperparameters, the model was trained and tested using each of the different ways to divide the data into training and testing sets, and the average of the accuracies and F1 scores were calculated for all of the combinations to find the final performance evaluation for each model.
Any video clips that were of the same person were also labeled and made sure that the same person’s video clips would either all be in the training set or all be in the testing set. This helped to eliminate any possible misevaluation of models caused by having possibly similar video clips in both the training and testing sets.
3.6. Materials and resources
This research was performed on an M1 chip MacBook Air computer, and Python3 as the primary programming language. Relevant Python libraries include NumPy, pandas, OpenCV, Python-FacePP, scikit-learn, and TensorFlow Keras. The data was collected using YouTube and processed using QuickTime Player.
4. Results and discussion
As shown by the data in Figure 4, the model with the best performance was the deep neural network from Tensorflow Keras, followed by the multi-layer perceptron neural network from scikit-learn.
The best performance achieved was an F1 score of roughly 0.86, equivalent to an accuracy of around 89% for the particular dataset used. This was quite good considering the focus on affordable and accessible model development and data collection. From this, it could be concluded that AI models can in fact give predictions of acceptable accuracy for a patient’s Parkinson’s condition before needing thorough examinations by physicians.
Notably, the MLP and deep neural network models had low accuracies without hyperparameter tuning likely due to the default hyperparameters for those models being quite poor for this case.
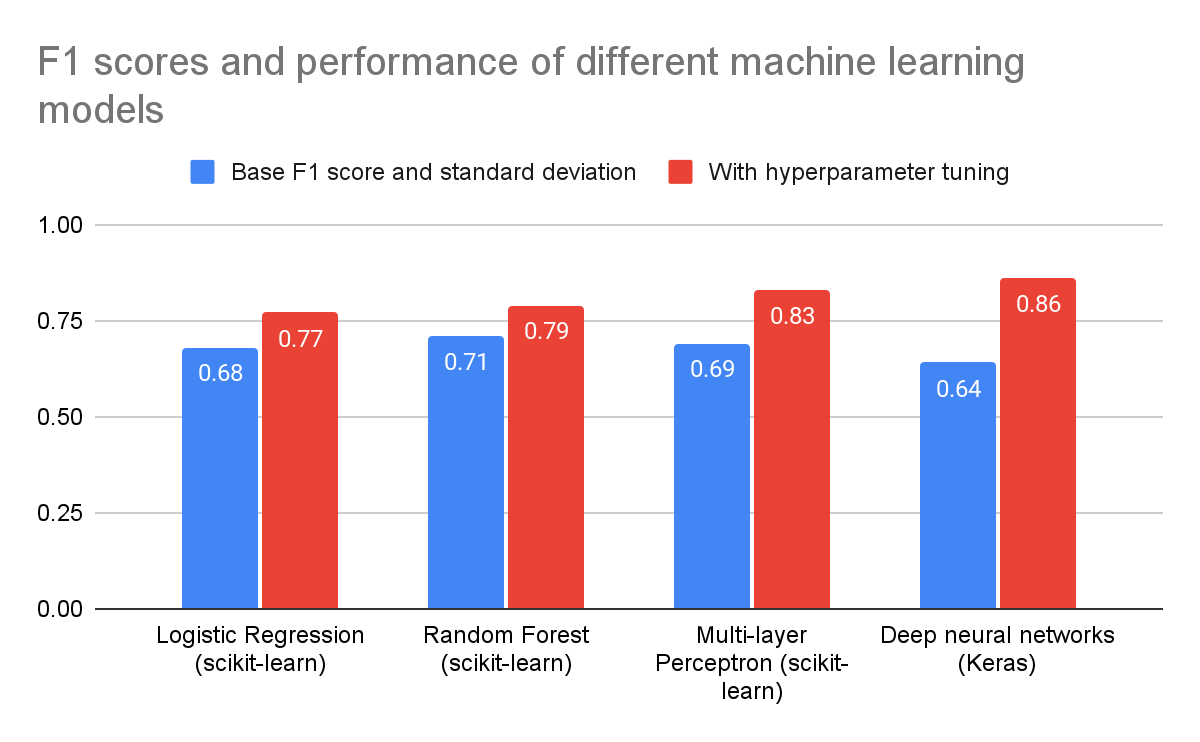
Figure 4. Performance evaluation (F1 score) for four different models tested.
There was also a noticeable improvement in each model’s performance when hyperparameter tuning was used compared to when not used.
For example, for the multilayer perceptron (MLP) model, hyperparameter tuning on the initial learning rate coefficient, as shown in Figure 5, revealed that the performance varies greatly for different values of the initial learning rate. In this example, the optimal initial learning rate was about 3×10⁻³ when considered independently from any of the other hyperparameters (solver was set to Adam, and activation function was set to logistic), which achieves an F1 score of around 0.88. Additionally, the F1 score is greater than 0.8 for initial learning rates between 6×10⁻⁴ and 3×10⁻².
The ROC curve [15] of the MLP classifier, shown in Figure 6, has an area under the curve of 0.93. This further indicates that the model performs well and has high predictive power.
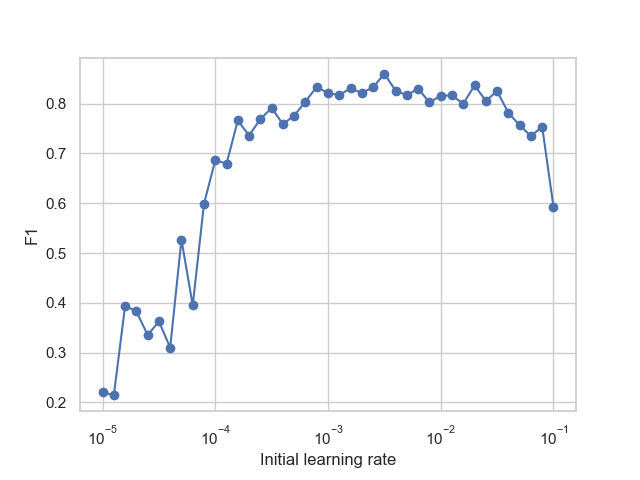
Figure 5. MLP performance as measured by F1 score for different initial learning rates.
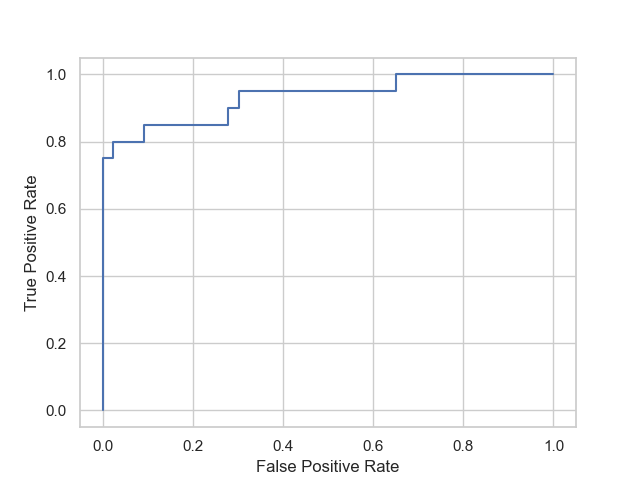
Figure 6. ROC curve of the multi-layer perceptron model.
In addition, the feature importance for the logistic regression model was analyzed, as shown in Figure 7, and it was found that the significance of different attributes in the prediction and diagnosis process varied significantly. In particular, age had the highest feature importance, which makes sense considering that Parkinson’s is disproportionately more common in the elderly population. Certain emotions, including disgust, fear, and sadness also played a relatively significant role in the model. Finally, attributes such as gender and glasses had very little importance, which was expected since they have little relation to a person’s Parkinson’s status.
These findings show that the pipeline can effectively distinguish which features are important and combine them in a reasonable way.
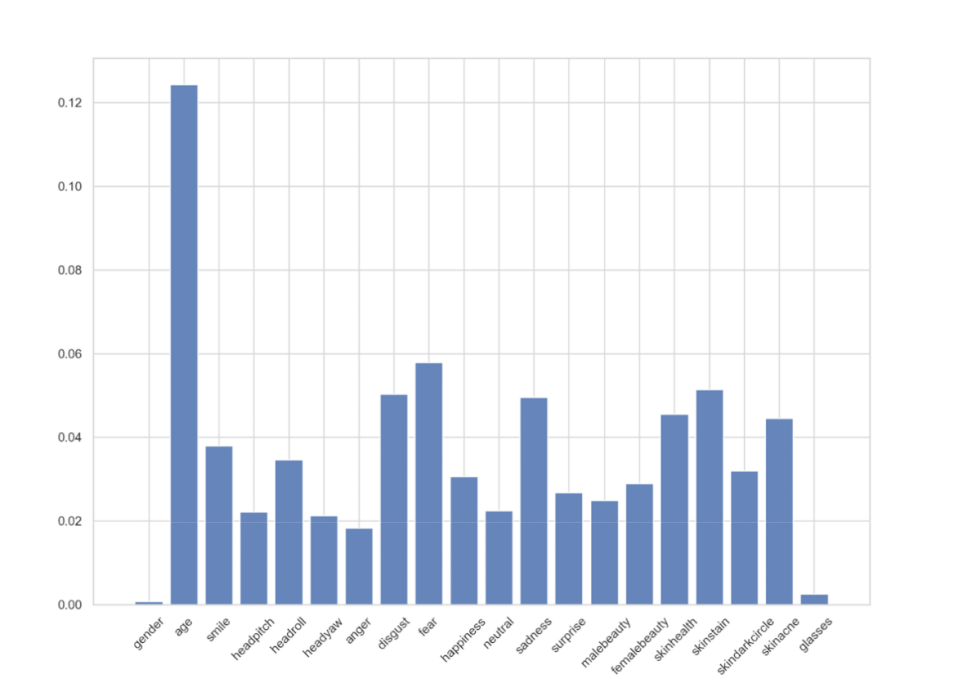
Figure 7. Feature importance analysis from the logistic regression model.
Given the emphasis on accessibility and affordability of the methods and approach, the models presented here cannot replace the diagnosis of professional doctors. Furthermore, the collected data for healthy individuals may not be entirely accurate since they could not have been clearly labeled as being healthy people. However, compared to existing methods, these models are affordable, accessible, and easy to use. As such, it can be a very useful assisting tool to complement a doctor’s diagnosis.
Regarding future work, the performance of these models can continue to be improved, either by collecting more and better data or by using more specialized and robust machine learning algorithms.
Then, these models can be further developed so that they can be used in practical situations, for example as a supplemental aid tool to provide doctors with clues about the Parkinson’s status of their patients. Alternatively, it can be used as an at-home check for individuals who are at risk of having Parkinson’s if it can be developed into an easy-to-use web or mobile application.
5. Conclusion
From this research, it could be concluded that optimized machine learning and deep learning algorithms are capable of diagnosing Parkinson’s disease by analyzing a patient’s facial data with remarkable accuracy. Additionally, this study confirms the result from prior research that analyzing emotions can be an effective way to aid the diagnosis of Parkinson’s.
If given an emphasis on affordability and accessibility, this approach can be made freely available to a wide array of people who may be at risk of having Parkinson’s with only a minor sacrifice in the accuracy of diagnoses. With further research and development, this approach could be a notable contribution to the effort against Parkinson’s disease.
References
[1]. Parkinson’s Disease: Challenges, Progress, and Promise. (2023, January 30). National Institute of Neurological Disorders and Stroke. https://www.ninds.nih.gov/current-research/focus-disorders/focus-parkinsons-disease-research/parkinsons-disease-challenges-progress-and-promise
[2]. Mayo Clinic Staff. (2023, May 26). Parkinson’s disease. Mayo Clinic. https://www.mayoclinic.org/diseases-conditions/parkinsons-disease/
[3]. National Health Service. (2022, November 11). Parkinson’s disease. The NHS Website. https://www.nhs.uk/conditions/parkinsons-disease/
[4]. Yang, W., Hamilton, J. L., Kopil, C., Beck, J. C., Tanner, C. M., Albin, R. L., ... & Thompson, T. (2020). Current and projected future economic burden of Parkinson’s disease in the US. npj Parkinson's Disease, 6(1), 1-9.
[5]. Jin, B., Qu, Y., Zhang, L., & Gao, Z. (2020). Diagnosing Parkinson Disease Through Facial Expression Recognition: Video Analysis. Journal of medical Internet research, 22(7), e18697. https://doi.org/10.2196/18697
[6]. Ali, M. R., Myers, T., Wagner, E., Ratnu, H., Dorsey, E., & Hoque, E. (2021). Facial expressions can detect Parkinson’s disease: Preliminary evidence from videos collected online. NPJ digital medicine, 4(1), 1-4.
[7]. Hou, X., Zhang, Y., Wang, Y., Wang, X., Zhao, J., Zhu, X., & Su, J. (2021). A Markerless 2D Video, Facial Feature Recognition–Based, Artificial Intelligence Model to Assist With Screening for Parkinson Disease: Development and Usability Study. Journal of Medical Internet Research, 23(11), e29554.
[8]. Yang, L., Chen, X., Guo, Q., Zhang, J., Luo, M., Chen, X., ... & Xu, F. (2022). Changes in facial expressions in patients with Parkinson's disease during the phonation test and their correlation with disease severity. Computer Speech & Language, 72, 10
[9]. Pegolo, E., Volpe, D., Cucca, A., Ricciardi, L., & Sawacha, Z. (2022). Quantitative Evaluation of Hypomimia in Parkinson's Disease: A Face Tracking Approach. Sensors (Basel, Switzerland), 22(4), 1358. https://doi.org/10.3390/s22041358
[10]. U.S. Copyright Office Fair Use Index. (2023, February). U.S. Copyright Office. https://www.copyright.gov/fair-use/
[11]. Megvii. (n.d.). Face Detection. Face++ Cognitive Services. Retrieved April 21, 2023, from https://www.faceplusplus.com/face-detection/
[12]. Scikit-learn: Machine Learning in Python, Pedregosa, F. et al., JMLR 12, pp. 2825-2830, 2011.
[13]. Banoula, M. (2023, May 29). An Overview on Multilayer Perceptron (MLP). Simplilearn. https://www.simplilearn.com/tutorials/deep- learning-tutorial/multilayer-perceptron
[14]. Korstanje, J. (2021, August 31). The F1 score. Towards Data Science. https://towardsdatascience.com/the-f1-score-bec2bbc38aa6
[15]. Hajian-Tilaki, K. (2013). Receiver Operating Characteristic (ROC) Curve Analysis for Medical Diagnostic Test Evaluation. Caspian journal of internal medicine, 4(2), 627–635.
Cite this article
Shi,H.;Wu,B. (2023). FaceTell: A novel solution to diagnosing Parkinson’s disease with facial expressions and deep learning. Applied and Computational Engineering,21,53-62.
Data availability
The datasets used and/or analyzed during the current study will be available from the authors upon reasonable request.
Disclaimer/Publisher's Note
The statements, opinions and data contained in all publications are solely those of the individual author(s) and contributor(s) and not of EWA Publishing and/or the editor(s). EWA Publishing and/or the editor(s) disclaim responsibility for any injury to people or property resulting from any ideas, methods, instructions or products referred to in the content.
About volume
Volume title: Proceedings of the 5th International Conference on Computing and Data Science
© 2024 by the author(s). Licensee EWA Publishing, Oxford, UK. This article is an open access article distributed under the terms and
conditions of the Creative Commons Attribution (CC BY) license. Authors who
publish this series agree to the following terms:
1. Authors retain copyright and grant the series right of first publication with the work simultaneously licensed under a Creative Commons
Attribution License that allows others to share the work with an acknowledgment of the work's authorship and initial publication in this
series.
2. Authors are able to enter into separate, additional contractual arrangements for the non-exclusive distribution of the series's published
version of the work (e.g., post it to an institutional repository or publish it in a book), with an acknowledgment of its initial
publication in this series.
3. Authors are permitted and encouraged to post their work online (e.g., in institutional repositories or on their website) prior to and
during the submission process, as it can lead to productive exchanges, as well as earlier and greater citation of published work (See
Open access policy for details).
References
[1]. Parkinson’s Disease: Challenges, Progress, and Promise. (2023, January 30). National Institute of Neurological Disorders and Stroke. https://www.ninds.nih.gov/current-research/focus-disorders/focus-parkinsons-disease-research/parkinsons-disease-challenges-progress-and-promise
[2]. Mayo Clinic Staff. (2023, May 26). Parkinson’s disease. Mayo Clinic. https://www.mayoclinic.org/diseases-conditions/parkinsons-disease/
[3]. National Health Service. (2022, November 11). Parkinson’s disease. The NHS Website. https://www.nhs.uk/conditions/parkinsons-disease/
[4]. Yang, W., Hamilton, J. L., Kopil, C., Beck, J. C., Tanner, C. M., Albin, R. L., ... & Thompson, T. (2020). Current and projected future economic burden of Parkinson’s disease in the US. npj Parkinson's Disease, 6(1), 1-9.
[5]. Jin, B., Qu, Y., Zhang, L., & Gao, Z. (2020). Diagnosing Parkinson Disease Through Facial Expression Recognition: Video Analysis. Journal of medical Internet research, 22(7), e18697. https://doi.org/10.2196/18697
[6]. Ali, M. R., Myers, T., Wagner, E., Ratnu, H., Dorsey, E., & Hoque, E. (2021). Facial expressions can detect Parkinson’s disease: Preliminary evidence from videos collected online. NPJ digital medicine, 4(1), 1-4.
[7]. Hou, X., Zhang, Y., Wang, Y., Wang, X., Zhao, J., Zhu, X., & Su, J. (2021). A Markerless 2D Video, Facial Feature Recognition–Based, Artificial Intelligence Model to Assist With Screening for Parkinson Disease: Development and Usability Study. Journal of Medical Internet Research, 23(11), e29554.
[8]. Yang, L., Chen, X., Guo, Q., Zhang, J., Luo, M., Chen, X., ... & Xu, F. (2022). Changes in facial expressions in patients with Parkinson's disease during the phonation test and their correlation with disease severity. Computer Speech & Language, 72, 10
[9]. Pegolo, E., Volpe, D., Cucca, A., Ricciardi, L., & Sawacha, Z. (2022). Quantitative Evaluation of Hypomimia in Parkinson's Disease: A Face Tracking Approach. Sensors (Basel, Switzerland), 22(4), 1358. https://doi.org/10.3390/s22041358
[10]. U.S. Copyright Office Fair Use Index. (2023, February). U.S. Copyright Office. https://www.copyright.gov/fair-use/
[11]. Megvii. (n.d.). Face Detection. Face++ Cognitive Services. Retrieved April 21, 2023, from https://www.faceplusplus.com/face-detection/
[12]. Scikit-learn: Machine Learning in Python, Pedregosa, F. et al., JMLR 12, pp. 2825-2830, 2011.
[13]. Banoula, M. (2023, May 29). An Overview on Multilayer Perceptron (MLP). Simplilearn. https://www.simplilearn.com/tutorials/deep- learning-tutorial/multilayer-perceptron
[14]. Korstanje, J. (2021, August 31). The F1 score. Towards Data Science. https://towardsdatascience.com/the-f1-score-bec2bbc38aa6
[15]. Hajian-Tilaki, K. (2013). Receiver Operating Characteristic (ROC) Curve Analysis for Medical Diagnostic Test Evaluation. Caspian journal of internal medicine, 4(2), 627–635.