


Introduction
While providing convenience for people's life, work and travel, the automobile also causes serious personal injury and huge economic and property losses. There are many causes of traffic accidents, among which the traffic accidents caused by fatigue driving is 12%, which is a major factor affecting driving safety. Most of the accidents are largely related to the driver's lack of sleep the previous dad [1]. If the driver in the day before the sleep time to seven hours, is the initiative of the probability of traffic accident will increase greatly, and the day before the driving sleep time not to four hours of the driver, the probability of traffic accident is the driver meet the normal sleep time 15 times, therefore, fatigue driving is likely to lead to car accident. The main cause of fatigue driving is the reduction in the perceptual sensitivity and the ability to identify the distance when the driver is in a state of exhaustion. At the same time, their reactions are becoming dulled, thinking and judgment is slow, the reaction time will be extended by about 0.2s, when stimulated by complex situations, the reaction time will double [1]. The characteristics of tired driving can be summarized as: frequent blinking, yawning and nodding, body tilt, slow reaction, etc. These fatigue characteristics may all be important factors in causing major or major traffic accidents. Therefore, fatigue driving detection has become an important research topic in the field of traffic safety, which has a very long-term significance to People's Daily life and the economic development of the country. In this paper, fatigue detection based on driver behavior characteristics is an indirect detection method, which mainly uses head sensors and machine vision technology to detect the changes of the driver's head and face, including eye closure ratio, yawning frequency, nodding frequency and line of sight direction deviation angle.Another is that the fatigue detection based on the physiological characteristics of the driver, which uses the sensor in direct contact with the driver's body to obtain physiological parameters to distinguish the fatigue or not. The methods include EEG signal detection [2], ECG signal detection, eye telecom signal detection and heart rate variability detection [3]. By testing whether the driver is tired in the driving process, so as to reduce the fatigue driving behavior in the driving process, so as to improve the driving safety and ensure safe driving. Reduce a variety of car accidents caused by fatigue driving in China. Our detection based on driver physiological characteristics could use the frequency change of EEG images to visually reflect the driver's sleepy state, use ECG to determine whether physiological burden is abnormal, and collect biological signals of muscle at rest or contraction through EGM technology [4]. Driver face features are detected by face detection by YOLOX [1] and face keypoint detection and head posture by PFLD [5]. Finally, the relevant indicators are used to judge whether the driver is tired.
Fatigue driving detection study
Detection based on the driver's physiological characteristics
Through the physiological data monitoring of the driver to judge the driving state mainly through the analysis of the physiological state of the driver is awake, has a good driving state. The detection of physiological data when the driver fatigue state will deviate from the normal data track.
Electroencephalography. The data monitoring of EEG is closely related to the sleep structure. The frequency change of the EEG image can directly reflect the sleepy state of the driver, so as to judge the fatigue degree of the driver. According to the basis of EEG waveform test fatigue: when the cerebral cortex is in different states, the EEG performance is different: δ wave, frequency 1 ~ 3.5 H z; θ wave, frequency 3.5 ~ 7.5 H z; α wave, frequency 7.5 ~ 1 2.5 H z; β wave, frequency 1 2.5 ~ 3 0 H z [2]. The is found that among the four ripple attributes, α wave is the most able to reflect the driver's desire to sleep. When the brain needs to sleep, the α wave frequency increases significantly and the β wave frequency decreases significantly. However, because the EEG method requires professional instruments and the brain signals are susceptible to external information, the test conditions are harsh, and the price of individual differentiation is too high, the practicability of the EEG method is limited and cannot be put into the market.
Electrocardiogram. ECG is mainly used to detect the physiological burden of the driver. When the physiological burden of the driver is too large, the ECG will send out a striking and regular downward trend signal, indicating that the driver is in a state of fatigue. The most important physiological indicators to determine whether the physiological burden is abnormal are heart rate and heart rate variability (HRV), respectively. Through some simulated driving experiment, the fatigue degree can be quantified by four ECG time and frequency domain indexes [3].
The advantages and disadvantages of ECG method are obvious, but the equipment of this method is easy and the system is easy to cut. This technology is expected to carry out dynamic detection and real-time processing, but the disadvantages are that the sensitivity and analysis and judgment ability of the hormone are poor, and it needs to cooperate with other technologies to make up for the technical loopholes that cannot be broken in this technology.
Electromyography. EGM technology collects biological signals from muscles at rest or during contraction to determine the functional status of peripheral nerves, neurons, neuromuscular joints and the muscle itself. With the emergence of physiological fatigue with the deepening of fatigue EMG data will gradually decline. Wang Feng et al designed a front-end surface myographic signal (SEMG), which has the advantages of high input resistance [4], low noise and strong interference resistance. This technique uses wavelet analysis to determine the characteristics of SEMG during muscle fatigue, which is more flexible than Borleaf transformation.
This technique is very suitable for dynamic signal processing and can accurately and efficiently extract the nonstationarity of signals. It is the most complete detection method to detect the driver's driving state at present.
Test method. EEG, ECG, and EMG all use the same test sequence. The sequence is divided into four parts: 1) Collect information: collect information about heartbeat, brain signals and muscle expansion. This step is the only one to do in the cockpit, and the other three steps are done on a cloud processor. 2) paramete rcalculation:electrocardiogram, electroencephalogram and EMG cannot be used directly as calculation data, because generally the machine is a data comparison (graphics is too complex for data, not convenient for accurate comparison), the step usually use specific formula to collect the graphic information into digital data. 3) Data preprocessing: Use specific formulas to calculate the data of graphic information. 4) Parameter comparison: submit the data from the first three steps to the cloud processor for comparison with the expected threshold data. If the expected threshold is exceeded, it will be judged as abnormal or otherwise, and the results will be sent to the cloud server [6].
After sending to the cloud server, the server will not directly convey the results to the driver, because the cloud service will simultaneously receive three information about the comparison of the EEG data, ECG data, and EMG data with the expected threshold. When two or more items of data are greater than the expected threshold, when the result given by the cloud server in the fourth step of the detection method sequence is abnormal, the cloud server will determine the driver status as fatigue driving, and the cloud server will send the results to the driver in the first time.
Detection based on driver facial features
Face detection based on YOLOX. Face detection technology is mainly divided into two categories. One is the traditional computer vision algorithm, which primarily extracts features from the input image manually, and then trains the detector with the extracted features, so as to use the detector to complete face detection. The other type is deep learning technology. On the one hand, target detection network suitable for various tasks can detect faces, such as Faster-RCNN and YOLO series algorithm; on the other hand, face detection, such as CascadeCNN and MTCNN. The detection accuracy of such method is slightly higher than that of YOLO series, but the detection speed cannot meet the requirements of real-time system. Therefore, considering the demand of fatigue driving detection for face detection in this paper, the target detection network YOLOX is selected to conduct the driver's face detection. The prediction network module YOLOX Head can output the prediction box of the detected target, and its structure is shown in Figure 1.
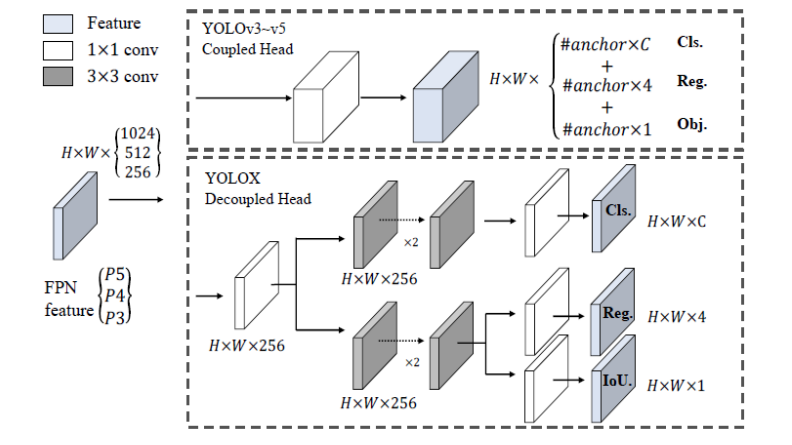
Figure 1. YOLOX Head, Network structure[1]
YOLOX use of Decoupled Head (predicted branch decoupling) [4] not only greatly improves the convergence rate, but also brings 4.2%AP improvement over the end-to-end decoupling of YOLOv3 to v 5. Decoupled Head, 1 * 1 convolution was used to first unify the features of originally different channel to 256 for dimension reduction, and then two parallel branches were used for classification and regression. The FPN feature pyramid is able of output three enhanced features of different shape, which are then input into the YOLOX Head prediction network to obtain the prediction results. Finally, three predictions can be obtained for each feature layer, which are: Reg (h, w, 4): the regression parameters used to judge each feature point, which can be obtained after adjustment Forecast box; (2) Obj (h, w, 1): used to judge whether each feature point contains an object; (3) Cls (h, w, num_classes): used to judge the type of objects included in each feature point. Finally, the three predictions are stacked to obtain the prediction results of the detected target.
Face keypoint detection and head pose estimation based on PFLD: 1) Face keypoint detection and head posture estimation: In the recognition of faces, we need to detect the key points of the face through the key points in the figure below to judge whether the person is tired in the process of driving. In this paper, 98 key points are used to identify the face diagram, as shown in Figure 2, to outline the facial features such as eyebrows, eyes, nose, mouth and face in a certain order.
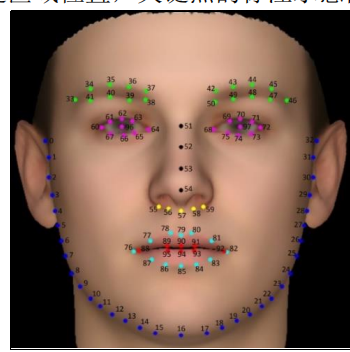
Figure 2. A Schematic diagram of the 98 key points identifying the human face[7]
Head posture estimation is to judge the driver in the process of driving, if fatigue, will cause a certain head Angle deviation, or the opening of the eyelid reduced. The above figure is the 2D model constructed. We can build a 3D model to better judge the degree of increase and decrease of various indicators of drivers. In 3D space, the head posture can be represented by three Euler angles: pitch (pitch), yaw Angle (yaw), and roll Angle (roll). The elevation angle represents the de-rotation using the x-axis, the yaw angle indicates the rotation of the y-axis, and the rolling angle represents the rotation of the z-axis as shown in Figure 3. With the central point of the head as the origin of the spatial coordinate system, pitch refers to the rotation around the x axis, indicating the amplitude of the nod up and down; yaw refers to the rotation around the y axis, indicating the amplitude of the left and right head, and roll refers to the rotation around the Z axis, indicating the amplitude of the left and right head.
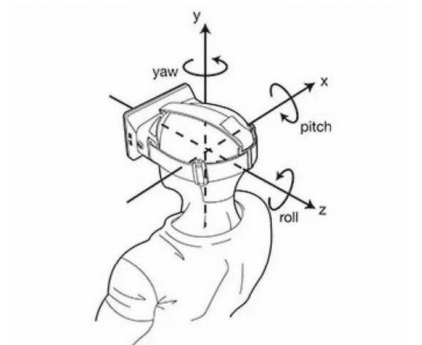
Figure 3. Schematic diagram of Euler angles[8]
2) PFLD, and the network structure:In the real driving environment, the key point detection faces complex lighting conditions in the driving process, and the face may be blocked by the driver wearing a mask. During the driving process, the driver may change positions in real time, and may be affected by the shooting equipment and lighting environment, resulting in different image quality.
The above situations will cause certain interference to the accuracy and speed of key point detection. In view of the difficulties of these face key point detection, Guo Xiaojie et al. proposed PFLD algorithm [9]. The algorithm is a practical algorithm with fast running speed and high accuracy, which breaks through the speed and accuracy limit of the previous face key point detection algorithm. The algorithm is not only fast, but also achieves the best evaluation index on the same data set, that is, maintains the high accuracy of the face key point positioning, and greatly reduces the complexity of the model. Therefore, the PFLD model was used to detect face keypoints. The network structure of the PFLD model consists of two parts: predicting landmark backbone network and the head pose auxiliary network. The Figure 4 showed the schematic diagram of Euler angles.
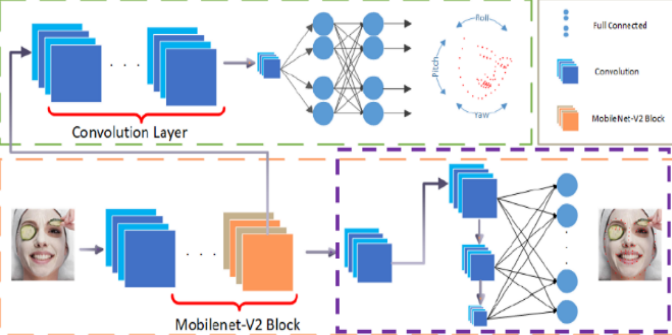
Figure 4. Schematic diagram of Euler angles[5]
The structure-optimized MobileNet-V2 lightweight network is adopted as the backbone network of the PFLD model [9]. The network is used to locate the position coordinates of facial key points. Due to its unique network structure, the quantity of parameters and calculations of the model are greatly reduced, and the execution speed of the model is improved.head pose The auxiliary network is a branch of the backbone network for head pose prediction during training to improve the positioning accuracy of key points. By default, the secondary network is not used during testing. The purpose of this is to adjust the loss parameters according to the acquired head attitude angle during the training process, so that the model pays more attention to rare samples and samples with too large attitude angle, and the predicted key point position coordinates are more stable and more robustness.
The PFLD model optimizes the network structure of Mobilenet-V2, using multiscale fusion to enhance the model expression capacity. The multi-scale full connection layer can increase the receptive field and can also better obtain the overall structure of the face, and then improve the positioning accuracy of the network, so as to obtain more accurate key point coordinates of the face.
The Loss function can calculate a value obtained after each training, which is the value between the real value and the predicted value, so as to ensure that the next training time can get a smaller error. In addition to network model structure and the quality of the selected samples that can determine the model training, the loss function also plays a crucial role.
The general loss function is difficult to deal with data imbalance, such as L2-loss loss function:
\(L: = \frac{1}{M}\sum_{m = 1}^{M}{\sum_{n = 1}^{N}{\gamma_{n}||d_{n}^{m}||}}\) (1)
Where M is the number of samples, and N is the number of feature points, representing the weight values of different key points. The loss function of the PFLD algorithm takes into account that the number of samples of different categories in the training sample may differ greatly, and the head pose angle obtained in the branch is applied to the loss penalty, so that the rare sample is given higher weight for further refinement. The optimized loss function;
\(L: = \frac{1}{M}\sum_{m = 1}^{M}{\sum_{n = 1}^{N}{(\sum_{c = 1}^{C}{\omega_{n}^{c}\sum_{k = 1}^{K}{(1 - \cos\theta_{n}^{k}}}))||d_{n}^{m}||_{2}^{2}\ }}\) (2)
among, \(\sum_{c = 1}^{C}{\omega_{n}^{c}\sum_{k = 1}^{K}{(1 - \cos\theta_{n}^{k}}}\)for the final sample weight, C represents different categories of faces. In the PFLD paper, faces are divided into multiple categories, including positive face, side face, tilted head and exaggerated expression. K represents the deviation of the three Euler angle values of the head pose estimation, and w is the given weight corresponding to the category. The loss function can solve the problem of unbalanced training samples, adjust the training weight of different categories of samples, and give a small weight to the samples with large data volume (such as positive face, samples with small θ value), thus reducing the contribution of samples with large sample size to the model training; for rare samples (such as side face, lower face, head, local occlusion, etc.), so as to improve the contribution in the backpropagation of the gradient, so as to solve the imbalance of training samples.
Extraction of fatigue features and status determination. a. Judgment of eye fatigue: a. PERCLOS is the physical quantity of fatigue/sleepiness proposed by the Carnegie Mellon Institute after repeated experiments and arguments [10]. PERCLOS It is recognized as the most effective and widely used indicator of fatigue. It has three classification criteria:
1) P70: When the upper eyelid covers more than 70% of the pupil area, it is regarded as closed eyes, and then the proportion of closed eyes time per unit time is calculated;
2) P80: When the upper eyelid covers more than 80% of the pupil area, it is regarded as closed eyes, and then the proportion of closed eyes time per unit time is calculated;
3) EM: When the upper eyelid covers more than half of the pupil area, it is considered as a closed eye, and then the unit is calculated Proportion of time.
The ratio of eye closure time to unit time calculated according to the P80 standard is the PERCLOS value per unit time, and the principle is shown in Figure 5.
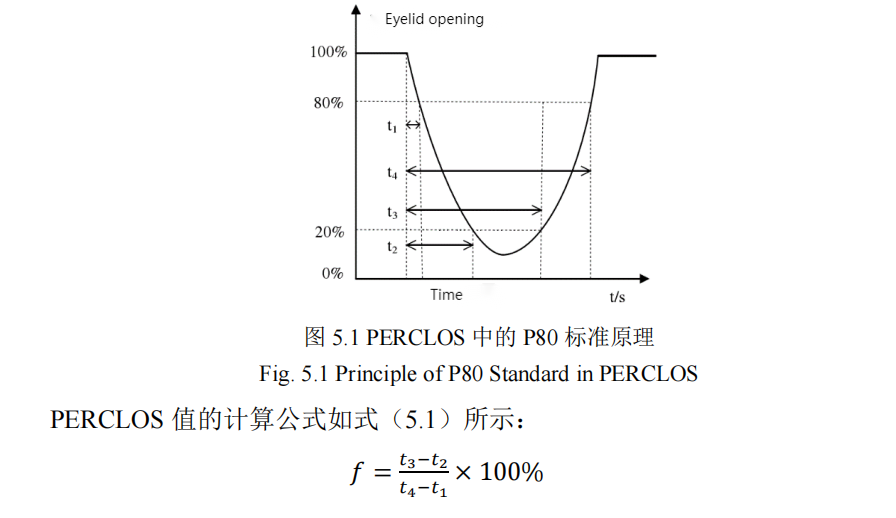
Figure 5. The P80 standard principle in PERCLOS[4]
The formula for calculating the PERCLOS value is shown in formula 3:
\(f = \frac{t_{3} - t_{2}}{t_{4} - t_{1}} \times 1\)00% (3)
b. Blink frequency
Blink frequency refers to the number of blinks per unit time, and the driver has a certain blink frequency in the awake state Small amplitude fluctuations in the range of. If the driver feels tired and conscious, his eyes will feel dry, and alleviate dryness by frequent blinking, the corresponding blinking frequency parameter becomes larger; when the fatigue gradually increases, the blink time will become longer, and the driver will suddenly open his eyes at a moment of fatigue, and then continue to blink after a short period of time, changing the blink frequency between brief awareness and blur until closed. Therefore, the ratio of the number of blinks to the statistical time. Blink frequency is like:
\(f = \frac{N_{B}}{N_{p}}\) (4)
Characteristics of mouth fatigue: During driving, the driver will have his mouth close, talk or yawn. The driver is tired During tired and frequent yawning, the opening and duration of the mouth will be significantly different from that of awake, so the aspect ratio (Mouth Aspect Ratio, MAR) can be calculated to determine the opening of the mouth, so as to distinguish the three states according to the threshold value. The key point distribution of the extracted mouth area of the face is shown in Figure 6.
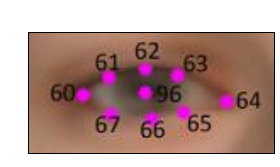
Figure 6. The distribution of key points in the face and mouth[4]
The MAR is calculated as in Eq:
\(EAR = \frac{|y_{61} - y_{67}| + |y_{63} - y_{65}|}{2|x_{60} - x_{64}|}\) (5)
Characteristics of head fatigue: a. Nodding frequency: The nodding frequency refers to the frequency of nodding per unit time, which is one of the head characteristics of the driver. The nodding frequency was performed as indicated:
\(f = \frac{N_{N}}{N_{T}}\) (6)
This is the number of nodding movements in time T and the total number of frames collected in time T.
b. Head posture and Euler angle: Head posture euler Angle is another can be used to identify the driver fatigue head characteristics, mainly by patch, yaw and roll three head posture Angle to reflect the change of the driver head movement, the parameter value can be used to calculate the nod frequency and head abnormal posture, which can assist in determining the driver's state of fatigue. The calculation formula of the head abnormal posture index is shown in the formula:
\(f = \frac{N_{P}}{N_{T}}\) (7)
This is the number of frames judged as abnormal attitude in the statistical time T, and the total number of frames collected during time period T.
Discussion
Assessing driver fatigue through physiological signals can yield relatively accurate and objective results that more accurately reflect the driver's true state. These devices collect data continuously, allowing real-time monitoring of the driver's condition and thus early detection of signs of fatigue. However, physiological signals can be affected by many factors, including individual differences, environmental factors, and emotional states. The use of EEG, ECG and EMG devices may require drivers to wear special equipment or attach sensors to their bodies, which may cause discomfort and may even interfere with normal driving behaviour. Moreover, such equipment can be quite expensive and also requires regular maintenance and calibration to ensure accuracy and reliability.
PFLD-based detection of face keypoints can run quickly on a variety of devices to adapt to real-time needs, PFLD can detect many keypoints of the face to deal with the detection of keypoints of the face in multiple viewpoints, and the detection of the driver's eyes, mouth, and head fatigue features can also improve driving safety and help prevent traffic accidents. However, PFLD requires a large amount of data with accurate labelling for training, and data acquisition and labelling is a difficult and time-consuming task. Under changing lighting conditions, PFLD may suffer from a decrease in detection accuracy. This may affect the accurate detection of driver fatigue.
A feasible solution for detecting fatigue driving is derived based on driver physiological characteristics and PFLD-based methods for estimating face keypoints and head pose. Firstly, a large amount of physiological data and facial images of drivers during driving need to be collected. These data are also labelled to identify fatigue and non-fatigue states. Then use PFLD for face key point detection and head pose estimation method. PFLD can effectively identify the driver's key points such as eyes and mouth, as well as head pose. This information will be used as a key input for detecting the driver's fatigue state. These features are correlated with the labelled fatigue state and trained to obtain a model capable of recognising fatigued driving. In practical applications, real-time collected driver physiological data and facial images are input into the model to detect the driver's fatigue state in real time. If the driver is detected to be in a fatigue state, can take appropriate measures.
Conclusion
Road traffic safety and driver's life safety guarantee the possibility of fatigue driving detection technology, which has important social significance. Although the technology has emerged in recent years due to economic development and academic breakthroughs, this technology still needs to be improved. 1) The fatigue driving testing standards need to be further clarified. Fatigue driving perception includes cross-integration of biological, biochemical, behavioral science, ergonomics, and other fields. Existing detection methods cannot accurately classify fatigue levels and judge the relationship between fatigue and detection indicators, so this level and relationship need to be quantified in future studies. Through further study of fatigue characteristics and characteristics, construct the perception quality of fatigue driving. 2) Information fusion is one of the most important directions of fatigue detection. Due to the individual differences and complexity of physiological factors is difficult to estimate the driver fatigue, so there is only one standard and evaluation system, namely based on the recruitment information convergence measurement method can complement different sensor methods under the premise of comprehensive analysis of fatigue, artificial intelligence, digital image processing and mobile communication technology more effectively improve the detection accuracy and reliability. 3) Fatigue detection technology based on computer vision will continue to be further studied. Although fatigue driving monitoring devices are close to commercial, the high cost will hinder the wide application of inspection equipment, and computer desktop technology is expected to provide simple, cheap, comfortable, reliable wide range of market inspection products.
Authors Contribution
All the authors contributed equally and their names were listed in alphabetical order.
References
[1]. Wang S, Research on fatigue driving detection technology based on facial features. 2022 Shenyang University of Technology 64.
[2]. Xu L. Design of a vehicle-mounted intelligent cockpit controller system. 2023 Times Automobile 114-116.
[3]. Zhang R, Zhu T, Zhou Z. Review on the methods of driver fatigue driving detection. 2022 Computer Engineering and Applications. 58(21) 53-66.
[4]. Lv G, Software architecture design and development of intelligent cockpit controller. 2022 Shandong University 98.
[5]. Jing F, Research and implementation of driving fatigue detection based on deep learning. 2021 University of Electronic Science and Technology of China 83.
[6]. Bo C, Xu G,Song P. A. Review of the methods of fatigue driving detection. 2013 J. Dalian Nationalities University 15 266-271.
[7]. Jing B, Research on design and control strategy of vehicle intelligent cockpit controller. 2022 Henan University of Science and Technology 85.
[8]. Wang T, Research on the status quo and development trend of automotive intelligent cockpit design. 2021 Times Automobile 23 158-159.
[9]. Zhang M, Research and implementation of driving fatigue detection based on deep learning. 2020 Southwest University 72.
[10]. Wang D, Research on the status quo of domestic driver fatigue driving detection methods. 2018 Think Tank Era 41 118-119.
Cite this article
Jiang,M.;Yang,X. (2024). Study on Fatigue Driving Detection based on Physiological Characteristics of Drivers. Applied and Computational Engineering,32,223-231.
Data availability
The datasets used and/or analyzed during the current study will be available from the authors upon reasonable request.
Disclaimer/Publisher's Note
The statements, opinions and data contained in all publications are solely those of the individual author(s) and contributor(s) and not of EWA Publishing and/or the editor(s). EWA Publishing and/or the editor(s) disclaim responsibility for any injury to people or property resulting from any ideas, methods, instructions or products referred to in the content.
About volume
Volume title: Proceedings of the 2023 International Conference on Machine Learning and Automation
© 2024 by the author(s). Licensee EWA Publishing, Oxford, UK. This article is an open access article distributed under the terms and
conditions of the Creative Commons Attribution (CC BY) license. Authors who
publish this series agree to the following terms:
1. Authors retain copyright and grant the series right of first publication with the work simultaneously licensed under a Creative Commons
Attribution License that allows others to share the work with an acknowledgment of the work's authorship and initial publication in this
series.
2. Authors are able to enter into separate, additional contractual arrangements for the non-exclusive distribution of the series's published
version of the work (e.g., post it to an institutional repository or publish it in a book), with an acknowledgment of its initial
publication in this series.
3. Authors are permitted and encouraged to post their work online (e.g., in institutional repositories or on their website) prior to and
during the submission process, as it can lead to productive exchanges, as well as earlier and greater citation of published work (See
Open access policy for details).
References
[1]. Wang S, Research on fatigue driving detection technology based on facial features. 2022 Shenyang University of Technology 64.
[2]. Xu L. Design of a vehicle-mounted intelligent cockpit controller system. 2023 Times Automobile 114-116.
[3]. Zhang R, Zhu T, Zhou Z. Review on the methods of driver fatigue driving detection. 2022 Computer Engineering and Applications. 58(21) 53-66.
[4]. Lv G, Software architecture design and development of intelligent cockpit controller. 2022 Shandong University 98.
[5]. Jing F, Research and implementation of driving fatigue detection based on deep learning. 2021 University of Electronic Science and Technology of China 83.
[6]. Bo C, Xu G,Song P. A. Review of the methods of fatigue driving detection. 2013 J. Dalian Nationalities University 15 266-271.
[7]. Jing B, Research on design and control strategy of vehicle intelligent cockpit controller. 2022 Henan University of Science and Technology 85.
[8]. Wang T, Research on the status quo and development trend of automotive intelligent cockpit design. 2021 Times Automobile 23 158-159.
[9]. Zhang M, Research and implementation of driving fatigue detection based on deep learning. 2020 Southwest University 72.
[10]. Wang D, Research on the status quo of domestic driver fatigue driving detection methods. 2018 Think Tank Era 41 118-119.