


1.Introduction
The rapid development of socio-economics and the increasing trend of aging populations have accelerated urban social processes, while the issues of social development have become increasingly apparent. Global pandemics and nuclear leakages have posed significant threats to urban residents' lives [1]. Against this backdrop, urban social resilience has gradually emerged as a new research direction, bringing the society's ability to prevent, respond to, and recover from public health emergencies into the public eye[2]. Considering the post-epidemic era as a recent major public health emergency faced by cities, and mega and super-large cities can more prominently demonstrate the impact of events on the city. Therefore, how to scientifically evaluate urban social resilience remains a problem that the academic community and the practical field urgently need to solve.
Currently, domestic and international scholars have conducted some research in the field of urban resilience evaluation. The research mainly focuses on disaster risk governance, multiple disturbance impacts, and dynamic change process analysis in the direction of theoretical framework construction[3]; in the direction of comprehensive index evaluation, scholars mainly establish an index system of different urban resilience elements based on the connotation of urban resilience, calculate the resilience index to comprehensively evaluate the level of urban resilience [4]; in the direction of remote sensing models, scholars focus on the spatial heterogeneity and spatiotemporal evolution process of urban resilience [5]. In addition, scholars' evaluation of urban resilience also includes resilience network evaluation, functional model assessment, resilience maturity model evaluation, and other multifaceted research[6].
However, starting from the existing literature, existing research mainly focuses on the comprehensive evaluation of urban resilience under the existing urban structure, and there is less research on the dimension of urban social resilience from the perspective of public health emergencies. Moreover, most of them are theoretical studies, and the research angles are mostly concentrated on the community level rather than the city level, and there is no unified analysis of indicators related to urban social resilience combined with practical application [7]. It can be seen that establishing a scientific and comprehensive urban social resilience evaluation index system to deal with public health emergencies has become an urgent need in the current academic community and social practice.
This paper takes mega and super-large cities in the post-epidemic era as the research object, aiming to use grounded theory and the DPSIR conceptual model to construct an urban social resilience evaluation index system based on the background of public health emergencies. By using the combination of entropy weight method - variation coefficient method for weighting and BP neural network comprehensive evaluation method, a new urban social resilience evaluation model is established. An application analysis of 21 mega and super-large cities across the country is conducted to comprehensively assess the capabilities of the city's social dimension in the face of public health emergencies, providing a scientific basis for government decision-making, improving the public's cognition and understanding of public health emergencies, and promoting the stable and harmonious development of society.
2.Comprehensive Evaluation Index System
2.1.Data Sources
In this paper, a collection of previous research literature was conducted. Through academic databases such as CNKI (China National Knowledge Infrastructure), Baidu Academic, and official websites of the National Emergency Management Department and the National Standardization Management Committee, 24 relevant literatures and documents that are in line with this research were identified. Based on Grounded Theory, Nvivo 14.0 was used to randomly code 2/3 of the collected literature, totaling 16 samples, for open coding analysis. This was followed by manual open coding to identify different index subjects, with the remaining 1/3 used for theoretical saturation testing [8].
2.2.Evaluation Index System
To verify the accuracy and comprehensiveness of the dimensions of urban social resilience under public health emergencies as defined in this paper, the DPSIR conceptual model was introduced, drawing on the coding ideas of Grounded Theory for exploratory research on the evaluation index system of urban social resilience under public health emergencies, forming the results of qualitative research. Through the collection and coding process of raw data, the evaluation index system of urban social resilience under public health emergencies is summarized into the 5 main dimensions of the DPSIR model: Driving force, Pressure, State, Impact, and Response, with 10 axial codings and 22 open codings, thus forming 10 secondary indicators and 22 initial tertiary indicators, as shown in the table.
Table 1: Evaluation System
|
Target Layer |
Criterion Layer |
Element Layer |
Indicator Layer |
|
Urban Social Resilience Evaluation Index System under Public Health Emergencies |
Driving Force :D |
Economic Development Driving Force (D1) |
D11 Per Capita Disposable Income (Yuan) |
|
D12 Fiscal Revenue (Billion Yuan) |
|||
|
Social Development Driving Force (D2) |
D21 Non-elderly Population Proportion (%) |
||
|
D22 University and Above Education Population per 100,000 People (People) |
|||
|
D23 Proportion of Non-disabled Population (%) |
|||
|
Pressure: P |
Emergency Service Pressure: P1 |
P11 Proportion of General Public Service Expenditure in Local Government Expenditure (%) |
|
|
P12 Proportion of Disaster Prevention and Emergency Management, Public Safety Expenditure in Local Government Expenditure (%) |
|||
|
Medical Supply Pressure: P2 |
P21 Number of Doctors per 10,000 People |
||
|
P22 Number of Hospital Beds per 10,000 People |
|||
|
Status: S |
Social Relationship Network: S1 |
S11 Urban Coverage Rate (%) |
|
|
S12 Number of College Students per 10,000 People |
|||
|
Organizational Support Capability: S2 |
S21 Proportion of Social Security and Employment Expenditure in Local Government Expenditure (%) |
||
|
Organizational Support Capability: S2 |
S22 Proportion of Health and Wellness Expenditure in Local Government Expenditure (%) |
||
|
Impact: I |
Industrial Structure and GDP: I1 |
I11 Share of the Tertiary Sector in GDP (%) |
|
|
I12 Per Capita GDP (10,000 Yuan) |
|||
|
Information Transmission and Material Transportation Capability: I2 |
I21 Fixed Broadband Household Penetration Rate (%) |
||
|
I22 Total Volume of Posts and Telecommunications Business (Billion Yuan) |
|||
|
Response: R |
Promotion and Education: R1 |
R11 Proportion of Cultural Media Expenditure in Local Government Expenditure (%) |
|
|
R12 Proportion of Education Expenditure in Local Government Expenditure (%) |
|||
|
Scientific and Technological Innovation Capability: R2 |
R21 Proportion of Science and Technology Innovation Expenditure in Local Government Expenditure (%) |
||
|
R22 Proportion of Employment in the Science and Technology Sector (%) |
|||
|
R23 Proportion of Employment in the Creative Industries (%) |
3.Empowerment by Combination of Entropy Weight Method and Variation Coefficient Method - Construction and Application of BP Neural Network Evaluation Model
Through the normalization of the collected data, the model employs a combination of the entropy weight method and the variation coefficient method for empowerment, followed by simulation with a Backpropagation (BP) neural network, ultimately resulting in an integrated evaluation analysis model based on the combination of the entropy weight method and variation coefficient method, as well as the BP neural network.
3.1.Data Sources
This paper is based on the updated data from the seventh national census, selecting samples for model application [9]. Data from 21 mega and super cities across the country are comprehensive and updated quickly. The social resilience indicators data for each city in 2022 are chosen as the network learning samples. Among them, Shanghai, Harbin, Kunming, and Zhengzhou have not yet released the 2023 statistical yearbook during the writing process of this paper. Therefore, the national economic and social development statistical bulletins for 2022, as well as the quarterly and monthly statistical data for the whole year of 2022, are selected to integrate and calculate the specific social indicator data for each city in 2022. This is done to better train the learning samples, making the evaluation results more convincing. All relevant evaluation indicators for the level of urban social resilience under public health emergencies are quantitative indicators, and the indicator data can be obtained from official websites and statistical materials for direct quantification or formula-derived quantification.
3.2.Determination of Expected Values in BP Neural Network
Training Training requires a comparison of expected values with output values to meet the error requirements. Based on the weights determined by the combination of the entropy weight method and the variation coefficient method and the summation of standardized data weighted by these weights, all expected values are obtained. That is, the expected values for the level of social resilience in 21 mega and super cities under public health emergencies are shown in Table 2.
Table 2: Expectations of social resilience in 21 national megacities
|
Cities |
Expected Value |
|
Chengdu |
0.5455 |
|
Hangzhou |
0.4464 |
|
Beijing |
0.4199 |
|
Shanghai |
0.3998 |
|
Shenzhen |
0.3762 |
|
Nanjing |
0.3127 |
|
Changsha |
0.2781 |
|
Wuhan |
0.2850 |
|
Foshan |
0.2622 |
|
Xi'an |
0.2316 |
|
Kunming |
0.2718 |
|
Guangzhou |
0.2289 |
|
Dongguan |
0.2469 |
|
Jinan |
0.2620 |
|
Zhengzhou |
0.2366 |
|
Tianjin |
0.2265 |
|
Qingdao |
0.2249 |
|
Dalian |
0.2159 |
|
Harbin |
0.1798 |
|
Shenyang |
0.1959 |
|
Chongqing |
0.1613 |
3.3.BP Neural Network Simulation Training
This paper selects 19 cities as training samples. The remaining cities with extreme expected values, Chengdu and Chongqing, are chosen as test samples to illustrate the universality of the evaluation model.
(1) Input Layer: In the neural network model, the number of nodes in the input layer typically reflects the complexity of the features or indicators involved in the model. In this paper, 22 third-level indicators are selected as input nodes, which means the model takes into account a wide range of evaluation factors, thereby more comprehensively analyzing the performance of urban social resilience in public health emergencies.
(2) Hidden Layer: Combining the situation of urban social resilience and existing research, this paper adopts the following calculation formulas to determine the number of nodes in the hidden layer [10]:
\( L=\sqrt[]{n+m}+a,L=\sqrt[]{nm} \),\( L=\frac{n+m}{2},L={log_{2}}{n} \)
Where L represents the number of nodes in the hidden layer, n represents the number of nodes in the input layer, and m represents the number of nodes in the output layer. The value of a ranges from 1 to 10 and a is taken as an integer [11]. This paper calculates the approximate range of the number of hidden layer nodes to be [4, 16]. Through multiple trials and adjustments, when the number of hidden layer nodes is set to 16, the training observed that the error reached a minimum value of 0.000256. Therefore, this paper selects 16 as the number of nodes in the hidden layer.
(3)Output Layer: The node is set to 1 and the rating is divided. As shown in Table 3.
Table 3: Division of toughness level and grade
|
Evaluation Grading |
Output Result Value |
Resilience Level |
|
A |
(0.51, 1.00] |
High Resilience |
|
B |
(0.42, 0.51] |
Moderately High Resilience |
|
C |
(0.33, 0.42] |
Moderate Resilience |
|
D |
(0.24, 0.33] |
Moderately Low Resilience |
|
E |
(0.15, 0.24] |
Low Resilience |
Utilizing MATLAB R2021a software, the neural network is configured with 22 neurons in the input layer, 16 neurons in the hidden layer, and 1 neuron in the output layer. The training function trainlm is employed, with a learning rate of 0.05, a default momentum factor of 0.9, a training precision requirement of 1×10−41×10−4, a maximum number of training epochs set to 10,000, and a training target function error goal of 1×10−41×10−4 [133-135]. Sample data is then input into the model. Through the BP neural network training, relevant training comparison values are obtained, and the experimental results indicate that the expected output values are close to the actual output values.
Model Validation Results The well-trained model is applied to Chengdu and Chongqing for validation, and the output results are presented in Table 4.
Table 4: Comparison table of the expected sample and the output results of training
|
City |
Training Value |
Expected Value |
Absolute Error |
Relative Error |
|
Chengdu |
0.543652245 |
0.545490264 |
0.001838019 |
0.34% |
|
Chongqing |
0.162624535 |
0.161282348 |
0.001342187 |
0.83% |
In summary, the evaluation model established in this paper performs well in approximating both the training and test samples, thus it is considered effective and can be used to assess the social resilience levels of other cities.
4.Comprehensive Evaluation Results Analysis
The study found that the current average level of urban social resilience in China is 0.28609. Among the 21 cities, except for Shanghai, Beijing, Shenzhen, Chengdu, Nanjing, and Hangzhou, the social resilience levels of the remaining 15 cities are below the average. This indicates that although many cities in China have started to pay attention to the development and construction of urban resilience, there is a significant disparity in the current levels of social resilience. The scoring and resilience levels of each city are shown in Figure 1.
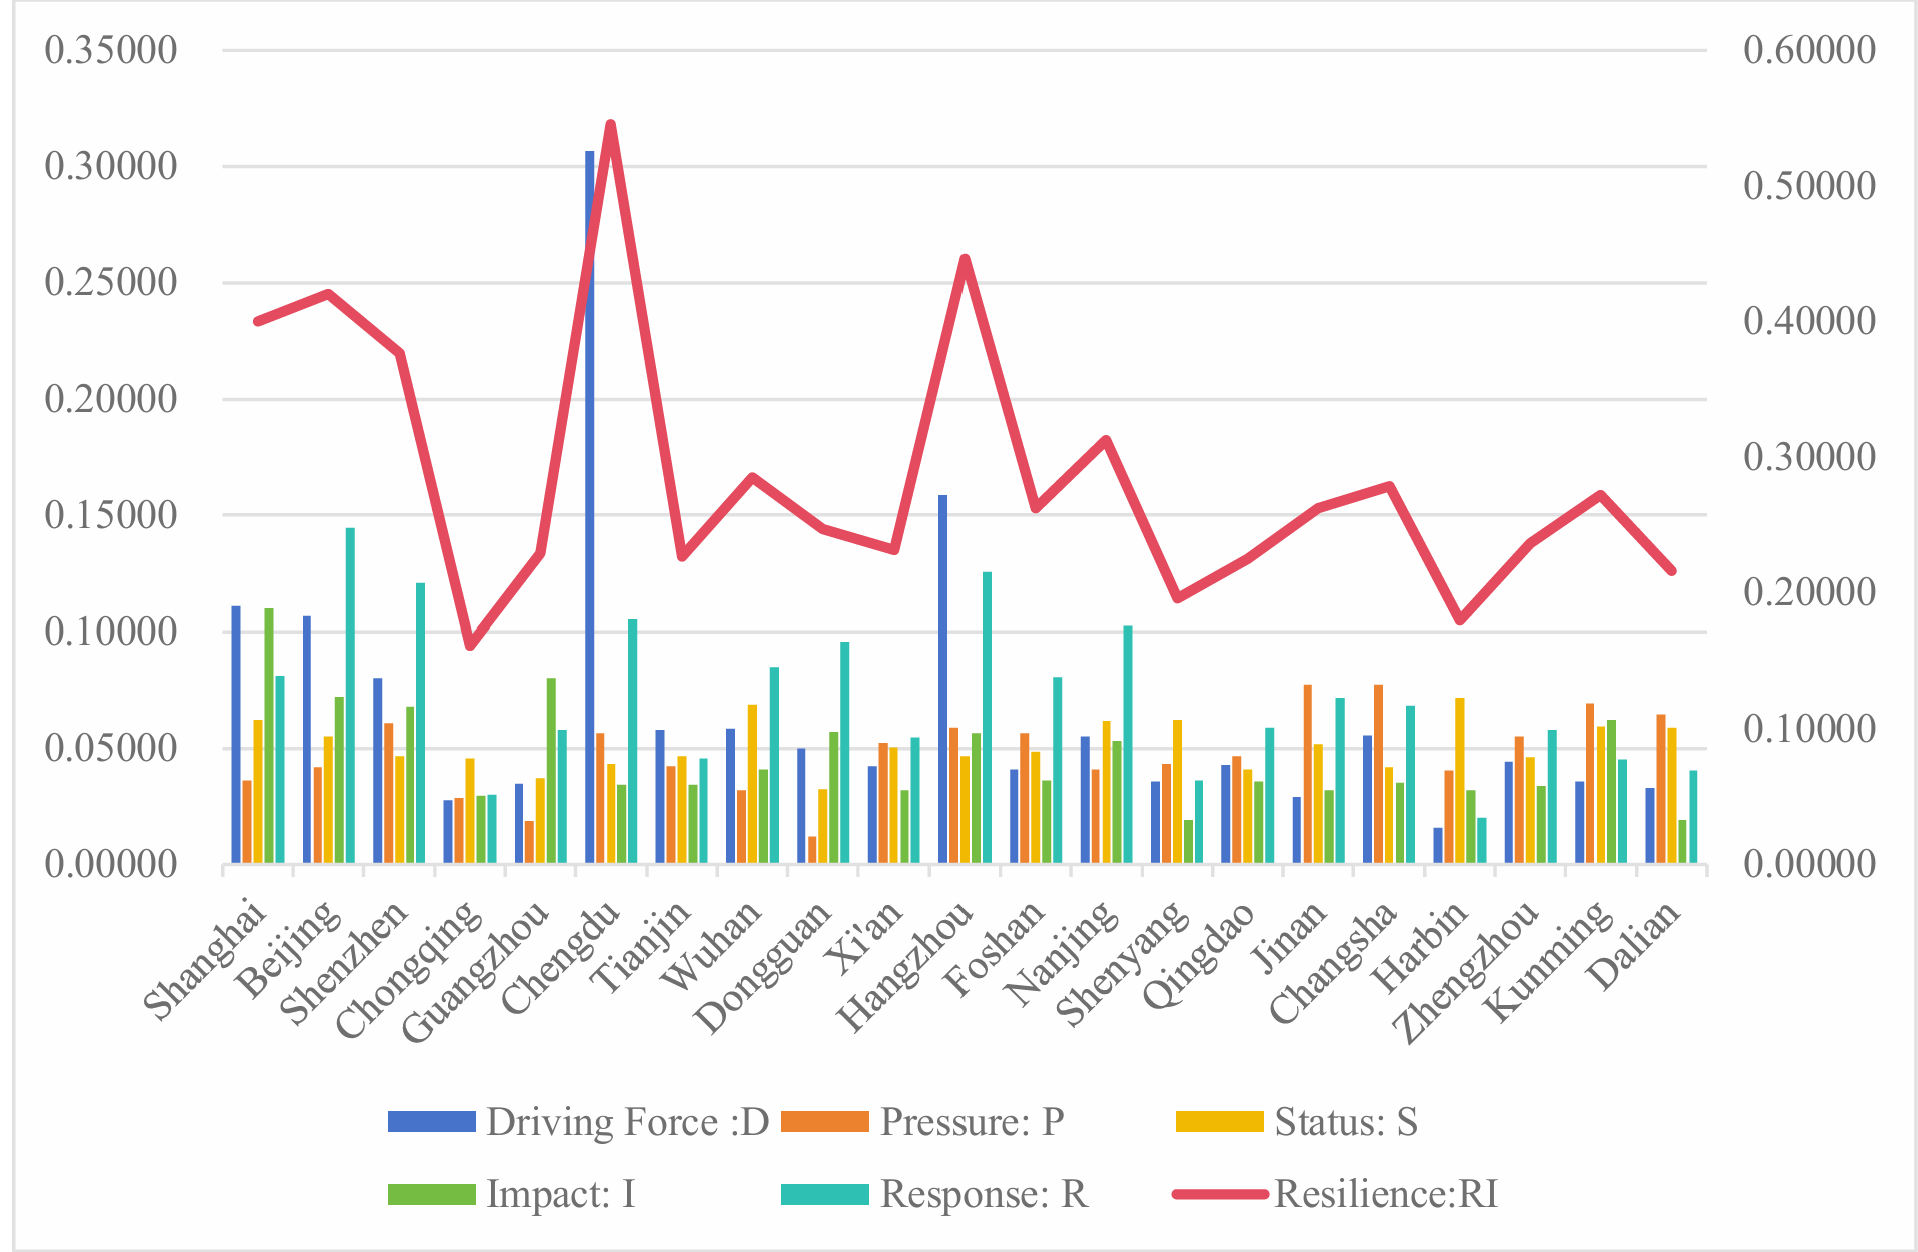
Figure 1: Score status and resilience level chart of each city
5.Conclusions
Firstly, this paper constructs an evaluation index system for urban social resilience under public health emergencies. Focusing on the social resilience of cities in the context of public health emergencies, the paper establishes common evaluation indicators from the five dimensions of the DPSIR conceptual model. It also optimizes and constructs the index system by combining grounded theory for the urban level under public health emergencies. This index system includes ten aspects: economic development and social development at the driving force level, emergency services and medical supplies at the pressure level, social relationship networks and organizational support capabilities at the state level, industrial structure and GDP as well as information transmission and material transportation capabilities at the impact level, and promotion and education and scientific and technological innovation capabilities at the response level.
Secondly, this paper constructs an evaluation model for urban social resilience under public health emergencies based on the BP neural network, using 21 mega and super cities as sample data for the application study. By employing the combination of the entropy weight method and the variation coefficient method for empowerment, a BP neural network simulation model is constructed. The model is trained based on samples from 21 mega and super cities across the country and simulated using MATLAB software. It reflects the resilience situation in various dimensions of large cities nationwide and retains the data of the test cities to verify the model's effectiveness, that is, whether it can reflect the social resilience of cities. This model only requires objective data and does not need subjective scoring by experts, thus obtaining evaluation results and having a broad application prospect.
References
[1]. Zhang Yiye. Research on the Evaluation of Government Resilience Governance Capability in Major Public Health Emergencies in Large Cities [D]. Hangzhou: Zhejiang University of Finance and Economics, 2022.
[2]. Yang Zhe. Research on the Information Reporting of Public Health Emergencies in China [D]. Taiyuan: Shanxi University, 2023.
[3]. Zhao Lin, Feng Zhenyu, An Jianmin. A Glimpse of the Emergency Management System for Public Health Emergencies in the United States [J]. Continuing Medical Education, 2007, (30): 7-9.
[4]. Zhao Ruidong, Fang Chuanlin, Liu Haomeng. Research Progress and Prospects of Urban Resilience [J]. Progress in Geography, 2020, 39(10): 1717-1731.
[5]. Yang Yuzhu. Research on the Measurement of Urban Resilience and Influencing Main Factors in the Beijing-Tianjin-Hebei Region [D]. Shijiazhuang: Hebei GEO University, 2020.
[6]. Xiao Cuixian. Comprehensive Evaluation Research on Urban Resilience in China [D]. Nanchang: Jiangxi University of Finance and Economics, 2021.
[7]. Zheng Yan, Lin Chenzhen. The Theoretical Basis and Assessment Methods of Resilient Cities [J]. City, 2017, (6): 22-28.
[8]. Wang Wanqing. Research on the Mechanism of Disaster Causation by Multi-Factor Coupling of Fire Risk in Commercial Complexes and Evaluation Model [D]. Beijing: Capital University of Economics and Business, 2020.
[9]. Ning Jizhe. The Main Data of the Seventh National Population Census [J]. China Statistics, 2021(05): 4-5.
[10]. Dai Pingjuan. Research on the Evaluation of Tourism Competitiveness in Smart Tourism Cities [D]. Guilin: Guangxi Normal University, 2015.
[11]. Zhou Liyong, Li Juanjuan, Li Baoshan, et al. Research on Mutton Price Forecasting Based on PCA-BP Neural Network [J]. Heilongjiang Animal Science and Veterinary Medicine, 2020, (14): 5-7.
Cite this article
Li,L.;Wu,Y. (2024). The Study of an Urban Social Resilience Evaluation Index System under the Context of Public Health Emergencies. Advances in Economics, Management and Political Sciences,95,157-163.
Data availability
The datasets used and/or analyzed during the current study will be available from the authors upon reasonable request.
Disclaimer/Publisher's Note
The statements, opinions and data contained in all publications are solely those of the individual author(s) and contributor(s) and not of EWA Publishing and/or the editor(s). EWA Publishing and/or the editor(s) disclaim responsibility for any injury to people or property resulting from any ideas, methods, instructions or products referred to in the content.
About volume
Volume title: Proceedings of the 2nd International Conference on Management Research and Economic Development
© 2024 by the author(s). Licensee EWA Publishing, Oxford, UK. This article is an open access article distributed under the terms and
conditions of the Creative Commons Attribution (CC BY) license. Authors who
publish this series agree to the following terms:
1. Authors retain copyright and grant the series right of first publication with the work simultaneously licensed under a Creative Commons
Attribution License that allows others to share the work with an acknowledgment of the work's authorship and initial publication in this
series.
2. Authors are able to enter into separate, additional contractual arrangements for the non-exclusive distribution of the series's published
version of the work (e.g., post it to an institutional repository or publish it in a book), with an acknowledgment of its initial
publication in this series.
3. Authors are permitted and encouraged to post their work online (e.g., in institutional repositories or on their website) prior to and
during the submission process, as it can lead to productive exchanges, as well as earlier and greater citation of published work (See
Open access policy for details).
References
[1]. Zhang Yiye. Research on the Evaluation of Government Resilience Governance Capability in Major Public Health Emergencies in Large Cities [D]. Hangzhou: Zhejiang University of Finance and Economics, 2022.
[2]. Yang Zhe. Research on the Information Reporting of Public Health Emergencies in China [D]. Taiyuan: Shanxi University, 2023.
[3]. Zhao Lin, Feng Zhenyu, An Jianmin. A Glimpse of the Emergency Management System for Public Health Emergencies in the United States [J]. Continuing Medical Education, 2007, (30): 7-9.
[4]. Zhao Ruidong, Fang Chuanlin, Liu Haomeng. Research Progress and Prospects of Urban Resilience [J]. Progress in Geography, 2020, 39(10): 1717-1731.
[5]. Yang Yuzhu. Research on the Measurement of Urban Resilience and Influencing Main Factors in the Beijing-Tianjin-Hebei Region [D]. Shijiazhuang: Hebei GEO University, 2020.
[6]. Xiao Cuixian. Comprehensive Evaluation Research on Urban Resilience in China [D]. Nanchang: Jiangxi University of Finance and Economics, 2021.
[7]. Zheng Yan, Lin Chenzhen. The Theoretical Basis and Assessment Methods of Resilient Cities [J]. City, 2017, (6): 22-28.
[8]. Wang Wanqing. Research on the Mechanism of Disaster Causation by Multi-Factor Coupling of Fire Risk in Commercial Complexes and Evaluation Model [D]. Beijing: Capital University of Economics and Business, 2020.
[9]. Ning Jizhe. The Main Data of the Seventh National Population Census [J]. China Statistics, 2021(05): 4-5.
[10]. Dai Pingjuan. Research on the Evaluation of Tourism Competitiveness in Smart Tourism Cities [D]. Guilin: Guangxi Normal University, 2015.
[11]. Zhou Liyong, Li Juanjuan, Li Baoshan, et al. Research on Mutton Price Forecasting Based on PCA-BP Neural Network [J]. Heilongjiang Animal Science and Veterinary Medicine, 2020, (14): 5-7.